Operations | Monitoring | ITSM | DevOps | Cloud
June 2023
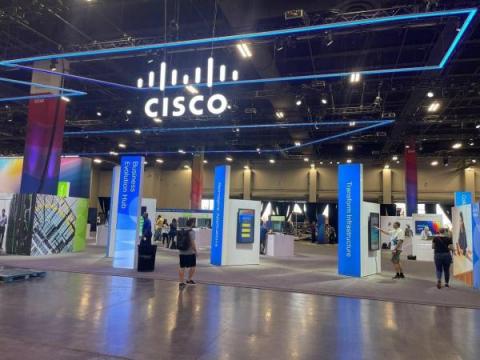
The Buzz for CloudFabrix at Cisco Live
Logs vs. Events: Exploring the Differences in Application Telemetry Data
What is the difference between logs and events in observability? These two telemetry data types are used for different purposes when it comes to exploring your applications and how your users interact with them. Simply put, logs can be used for troubleshooting and root cause analysis, while events can be used to gain deeper application insights via product analytics. Let's review some application telemetry data definitions for context, then dive into the key differences between logs and events and their use cases. Knowing more about these telemetry data types can help you more effectively use them in your observability strategy.
Graphite Metrics Delay: Why it Happens and What to Do
To understand why Graphite metrics delay occurs, we must first know what Graphite is. Graphite is an open-source tool used to track the performance of websites, applications, and network servers. It makes it simple to monitor, store, retrieve, and visualize numeric time-series data. While Graphite does make it easier to render graphs on-demand, the struggle of dealing with large amounts of data with minimum delay is real.
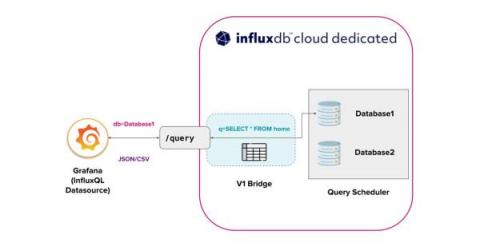
The Rebirth of InfluxQL in 3.0: A Quick Start Guide to Configuration and Usage
If we turn the clocks back to September 2013, we released InfluxQL alongside InfluxDB. InfluxQL is a SQL-like query language, specifically designed to query time series data. For many of our users, InfluxQL still remains the primary way they interact with InfluxDB. Based on this feedback, InfluxQL has been reborn in InfluxDB 3.0 alongside native support for the SQL query language. So what do I mean by reborn?
Improving the Elastic APM UI performance with continuous rollups and service metrics
In today's fast-paced digital landscape, the ability to monitor and optimize application performance is crucial for organizations striving to deliver exceptional user experiences. At Elastic, we recognize the significance of providing our user base with a reliable Observability platform that scales with you as you’re onboarding thousands of services that produce terabytes of data each day.
The power of generative AI for retail and CPG
The retail and consumer packaged goods (CPG) industry has undergone significant transformations due to advancements in technology. Technological innovations have reshaped various aspects of the industry, including customer engagement, inventory optimization, and supply chain management. These innovations have helped drive digital transformation, improve operational efficiency, enhance the customer experience, and promote sustainability.
Blackfire is now even closer to home!
As you probably already know, Blackfire and Platform.sh joined forces back in June 2021. And since then our collective teams have been working together to provide a seamless integration for a complete Git workflow and Observability solution. Blackfire was already part of the Platform.sh product experience for Enterprise and Elite users for quite some time now thanks to the Platform.sh Observability suite.
Building, deploying and observing SDKs as a Service - Part 2
In the first part of our series on Building, Deploying, and Observing SDKs as a Service, we delved into the world of APIs and successfully deployed our own REST APIs by wrapping the existing pet store APIs. Now, it’s time to take our journey further and unlock the true potential of SDKs. In this second part, we’ll explore how to build an SDK for the pet store API using the OpenAPI spec and the OpenAPI Generator project.
HEAL's vital AIOPS features
Artificial intelligence (AI) is one of the hottest topics in the world today, there are so much potential for this technology to help all sorts of Enterprise challenges. HEAL has been a leader in leveraging AI to help IT operations management for years. Our customers include some of the largest banks to the largest telcos in the world, working with them has enabled us to strengthen the AI in our core product to address many of the challenges faced by corporations large and small.
Azure Logic App Standard Monitoring on key metrics
How Ultimate improved workflow, adoption, and more with Grafana IRM
“So you get paged and wake up in the middle of the night, you don’t know what’s going on, and there you are needing to figure things out — What kind of tabs do I need open? Where do I find the logs? Where are the dashboards and the metrics?” If you’ve ever been on call, this refrain, voiced by Alexander Rösel, Senior Software Engineer at Ultimate, will sound all too familiar.
Netdata Parents (Streaming and Replication)
A “Parent” is a Netdata Agent, like the ones we install on all our systems, but is configured as a central node that receives, stores and processes metrics data from other Netdata “Child” nodes in our infrastructure. Netdata Parents are flexible. You can have one big active-active cluster of Netdata Parents, or you can spread a lot of independent Parents across the infrastructure. This “distributed still centralized” setup provides a lot of benefits.
Are you Ready For Microsoft Teams Premium?
Microsoft Teams Premium is here, with many of its new features now live and already adding benefits to businesses everywhere. Is it something you’re thinking about investing in? If it is, here’s the lowdown on some of the key additions and what they really mean for your organization.
Empowering Observability Engineers: Using Mezmo to Overcome Critical Challenges
The dynamic nature of the IT landscape poses complex challenges for organizations, necessitating the involvement of observability engineers. These skilled professionals have become indispensable in addressing critical pain points and optimizing system performance. In this blog post, we delve into the challenges observability engineers face and showcase how Mezmo's comprehensive telemetry solution empowers them to overcome these hurdles and achieve optimal results.
Monitoring Android Data with MetricFire
Understanding the performance of Android applications, user interactions, and problem-solving is significantly reliant on data monitoring. As the realm of mobile technology continues to expand, developers are tasked with managing an increasingly large amount of data. When this data is correctly harvested and scrutinized, it can yield valuable insights that inform strategic choices and lead to improvements in the app.
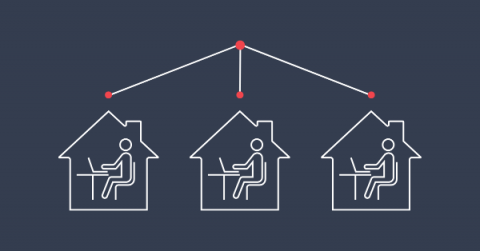
Streamline monitoring for remote teams: 4 ways the SCOM Connector for Microsoft Teams can help
Take back control of your Monitoring
Take back control of your Monitoring with Levitate - a managed time series data warehouse.
Webinar Recap: The Single Pane of Glass Myth
The observability landscape is constantly changing and evolving. Despite this, one question often plagues operations leaders: "How can we consolidate disparate data sources and tools to view system performance comprehensively?" These leaders have sought the answer in a single-pane-of-glass solution. However, as Jason Bloomberg and Buddy Brewer discussed in the Mezmo webinar "Solving the Single Pane of Glass Myth," this idea is more myth than reality.
Changes to Grafana plugins in Grafana 10 with David Harris (Grafana Office Hours #03)
VictoriaMetrics Meetup June 2023: Introducing VictoriaLogs | Open Source Logs management
OpenTelemetry vs OpenTracing: How to choose?
Data-Led Growth: How FinTechs Win with App Event Analytics
ManageEngine secures overall leadership position for Unified Endpoint Management in KuppingerCole Leadership Compass 2023
Attention, all tech enthusiasts! We are thrilled to announce that ManageEngine has once again been positioned as an Overall Leader for UEM in the KuppingerCole Leadership Compass. This marks the second consecutive time we have achieved this recognition. We have been acknowledged as leaders in all three leadership categories: Product Leadership, Innovative Leadership, and Market Leadership.
Get Deep Insights Into Your Heroku Applications with Our Comprehensive Cheatsheet
Are you looking to streamline your development process, boost productivity, and deploy your applications effortlessly? Look no further! We are thrilled to announce the release of our Heroku monitoring cheatsheet, designed to be your go-to resource for monitoring Heroku applications.
How Kentik reduces the likelihood of a full-blown cyber-attack before it happens
Organizations are under constant attack, and it’s critical to reduce the time it takes to detect attacks to minimize their cost. This first article in our new security series dives deep into how Kentik helps customers before, during, and after a cyber attack.
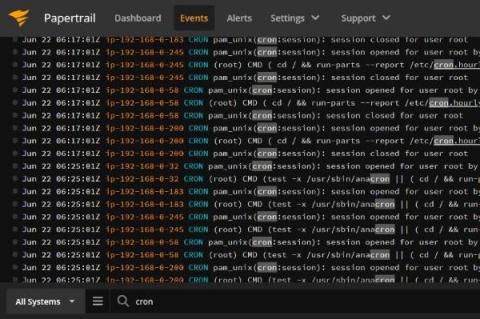
Streamline Your Scheduling With the Best 9 Cron Job Monitoring Tools
Welcome to the world of cron job monitoring tools, ensuring your scheduled tasks run like clockwork and devices connected to the internet are still up and running! Cron job monitoring is sending you alerts if something goes wrong and we don’t receive a request from your end. They keep you informed with real-time alerts and provide multiple benefits.
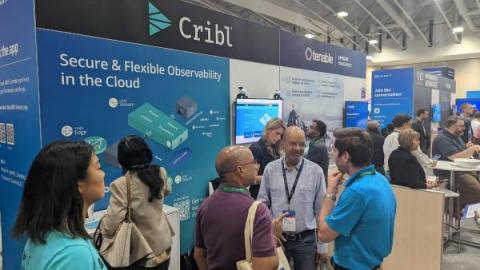
Search the Edge with Cribl Search and Cribl Edge
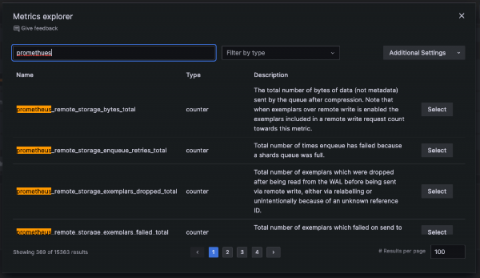
Build better PromQL queries with Grafana's metrics explorer
As more people and organizations adopt Prometheus and Grafana for observability, we at Grafana Labs want to make it easier for this expanding pool of users to answer questions about their systems, regardless of whether they’re experts or novices. That’s why we’re adding a feature to enhance metric browsing in the Prometheus query builder in addition to the metric select.
Coralogix vs Elastic Cloud: Support, Pricing, Features & More
With various open source platforms on the market, engineers have to make smart and cost-effective choices for their teams in order to scale. Elastic Cloud, and its flagship product Elasticsearch, are one of several options available, but how do they compare to a full-stack observability platform like Coralogix? This article will provide a complete breakdown between Coralogix and Elastic Cloud, from essential industry features, like logs, metrics and traces, to pricing models and support services.
Reduce Software Licensing Costs | Digital Workplace Games
Streamlining Observability: The Journey Towards Query Language Standardization
One of the most captivating discussions I had at KubeCon Europe 2023 in Amsterdam was about standardization of a query language for observability. This query language standard aims to provide a unified way of querying observability data across logs, metrics, traces, and other relevant signals. The conversation shed light on the pressing need for a standardized approach to overcome the challenges posed by the plethora of query languages currently in use.
Data Independence Day: Taking Back Control of Your Data!
On July 4th we celebrate. We celebrate freedom of movement, freedom of assembly, removal of excessive taxation, and much, much more. But what about digital independence? Removing the tyrannical yoke of control over your observability data. Authoritarian vendors restrict access and movement; they dictate proprietary formatting and even limit what can be commingled with your data, then apply enormous tax burdens (i.e. license fees) just to store your data.
Counting the Cost of Disruptions: Why you need Website Experience Monitoring
Every business today is now a tech company, regardless of the product or service they offer. While Tesla is a tech company that manufactures automobiles, one may argue that Footlocker is also a tech company that happens to sell sneakers.
Stop Overspending and Optimize Your Cloud Costs with Advanced Anomaly Detection
“Time is money” couldn’t be truer than in managing cloud costs. By way of proactive anomaly detection, a chance is given to save time that could have been spent on issue recognition and resolution. Anomaly detection for the Cloud can be tricky since there can be changes in prices & data on billing history anytime. Not to mention, seasonality can mess things up as well.
What's New in Sysdig - May and June 2023
This month, Sysdig has released Process Tree which enriches the Events feed for workload-based events. This helps with identifying all the processes that led up to the offending process. This is in technical preview status. Sysdig has also released Sysdig Secure Live.
SD-WAN Monitoring: Why Edge-to-Edge Coverage Isn't Enough
In recent years, network operations teams have had to contend with several critical challenges, including: In response to these challenges, teams are increasingly turning to SD-WAN. The market for SD-WAN is massive, and continuing to grow, potentially reaching $47 billion by 2031. Through SD-WAN technologies, organizations are able to realize a number of benefits. However, these benefits aren’t a sure thing. In fact, many teams encounter challenges with their SD-WAN implementations.
Quick Fix: Updating Telegraf Configs to Send Data to InfluxDB 3.0
We recently introduced a new version of InfluxDB, rewritten from the ground up to improve performance across the board. As with any undertaking of this nature, developers will need to make some adjustments to their applications in order to incorporate the new database. We even faced this challenge internally. We had many Telegraf instances sending data to legacy versions of InfluxDB.
Lightrun Attendance at FinOps X 2023: Unveiling Key Insights, Highlights and Takeaways from the Show
This week Lightrun attended the annual FinOps X event. The event was sold out and packed with great speakers, practitioners, and amazing atmosphere. Compared to last year which had over 300 attendees, this year the event brought over 1200! Above is a screenshot taken from the venue entrance reminding the audience with the core principles of FinOps.
What is High Cardinality Data?
Decoding Logic App Dilemmas: How to validate if a JSON property is not an empty string?
Watch Grafana 10 demos: New visualizations, plugin tools, and more from the latest Grafana release
With every major release of Grafana, we strive to give our users a broader, more powerful and more streamlined set of features for data visualization. Grafana 10, unveiled this month at GrafanaCON 2023, is certainly no exception. From more intuitive navigation to updated plugin development tools, Grafana 10 enhancements benefit new and seasoned users alike.
From Migration to Production-Ready: Compete's Serverless Journey with Lumigo
Microsoft Teams Outage, TM612617: Users may be unable to access Microsoft Teams using web browsers
This morning, Microsoft Teams suffered an outage with users unable to access Microsoft Teams unless they were using the Teams client. Editor’s Note: This outage lasted about 2 hours including the time to roll out a fix, Exoprise customers knew of the issue around 35 minutes before Microsoft. Exoprise proactive monitoring first detected the outage in North America starting at 7:20 AM EDT.
Monitoring High Cardinality Metrics
Monitoring is all about data. When you implement a monitoring tool, you have to make sure that the monitoring software can handle data. Today, data flows at high speeds and in large volumes. Data also comes in diverse forms, which increases the complexity of data ingestion. Because of this, monitoring solution providers promote, among others, their data processing capacities. If a monitoring platform can handle large and diverse data that comes in at a high velocity, it becomes a big advantage.
Netreo Q2 2023 Product Enhancement Roundup
To wrap up Q2, our Product Roundup highlights our more exciting Netreo UX and product enhancements, plus gives you a glimpse into what’s in store for the rest of 2023. Thanks for your continued support, and don’t forget to submit your ideas for improving Netreo through our in-product suggestion portal.
Strengthening Aviation Cybersecurity: Take Flight with Teneo and Akamai Guardicore
In today’s digital landscape, the aviation industry faces increasingly sophisticated cyber threats that can compromise the safety and security of critical systems. To combat these challenges, the Transportation Security Administration (TSA) has implemented new cybersecurity requirements. In this blog post, we’ll explore how Teneo, in collaboration with Akamai Guardicore, can help aviation organizations meet these requirements and strengthen their cybersecurity defenses.
Cloud Monitoring on our radar #Analysis #Uptime
GitOps: An Introductory Guide
This post was written by Pete Osah, a software developer who is familiar with web technologies, passionate about new software technologies, and keen on developing ways to pass knowledge to others in a simple manner. Thanks to new technologies, developers can release software and features to production at a faster pace and with greater efficiency. But maintaining software dependability and integrity requires having the necessary tools in place.
Database Sharding: What is it, and How it Works?
Today’s world runs on data. We are constantly improving our solutions thanks to the plethora of data available to us in the public domain. Our society has seen a behavioral change when it comes to formulating remedies. We are increasingly adopting data-driven decisions, and rightly so. Now, talking about this whole data logic, where do you think this enormous amount of data gets stored? Well, the answer is a database!
What is Network Traffic Analysis?
How much network traffic is received by a business in the United States on average? More specifically, how many gigabytes do you think it is? The numbers may surprise you. According to Statista, the average traffic received was nearly 200 BILLION gigabytes (178.21 billion GB). And it is expected to grow to 224.08 in 2023. Another interesting statistic involving traffic, with numbers provided by Broadband Search, is that users in America generate 3.1 million GBs per minute every minute.
The Future of Logz.io: Simple, Cost-effective Observability
Asaf and I founded Logz.io in 2015 to provide developers with the ultimate open source log management experience. With our product, logging with the ELK Stack was simple, efficient, and automated for the first time – so customers could save engineering costs and accelerate MTTR.
Lightrun's Product Updates - Q2 2023
During the second quarter of this year, Lightrun persisted producing a wealth of developer productivity solutions and enhancements, aiming for greater troubleshooting of distributed workload applications, reduction of MTTR for complex issues, and cost optimization within cloud-computing. Read more below the main new features as well as the key product enhancements that were released in Q2 of 2023!
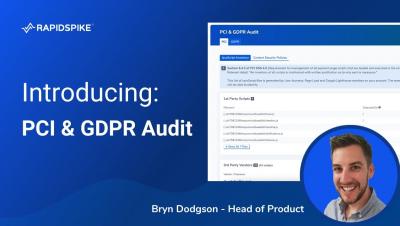
RapidSpike PCI & GDPR Audit
Sentry Customer Story: Cloudlfare (60-second version)
Announcing Complete Azure Observability for Kentik Cloud
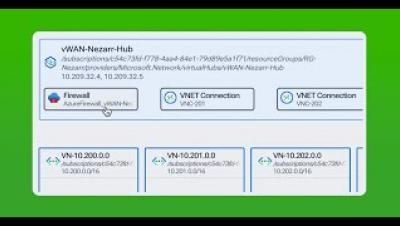
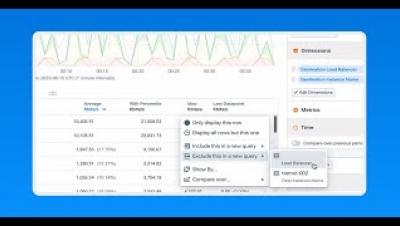
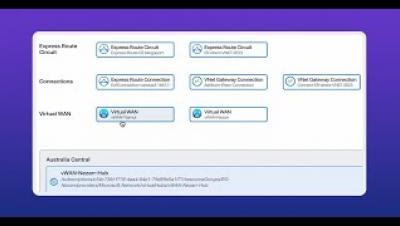
Kentik customers can now map traffic and performance of Microsoft Azure infrastructure with visibility into Azure Firewalls, Express Routes, Load Balancers, VWANs, and more in Kentik Cloud.
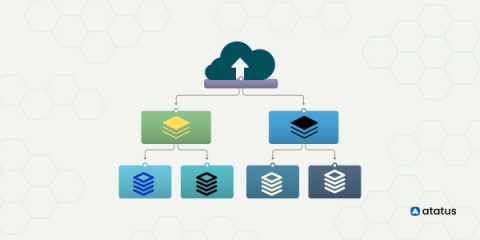
Benefits of GitOps in IT app development
Benefits of GitOps in IT monitoring The GitOps model has gained popularity as a software development approach. It enables IT teams to deliver higher-quality software faster and more efficiently. By streamlining and automating the development process, GitOps provides substantial productivity improvements while ensuring comprehensive observability for monitoring and control.
Open-sourcing sysgrok - An AI assistant for analyzing, understanding, and optimizing systems
In this post I will introduce sysgrok, a research prototype in which we are investigating how large language models (LLMs), like OpenAI's GPT models, can be applied to problems in the domains of performance optimization, root cause analysis, and systems engineering. You can find it on GitHub.
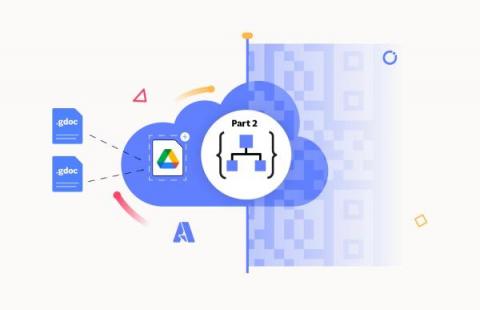
Decoding Logic App Dilemmas: Copying .gdoc files from Google Drive using Azure Logic App
An inside look at how React powers Grafana's frontend
Grafana dashboards enable millions of users to visualize and analyze their data. And working behind the scenes of the widely used open source platform is React, a frontend JavaScript library for building user interfaces. In this post — which was inspired by my recent presentation at React Summit 2023 in Amsterdam — we’ll explore why we chose to use React for Grafana, and the benefits and challenges we’ve seen along the way.
15 surprisingly scary application security statistics
Take a research-based look at the state of application security and learn how leveraging security builds user trust, resilience and revenue growth. According to the cybersecurity readiness index released by Cisco in March of 2023, less than 10% of all companies worldwide are considered mature enough to tackle today’s cybersecurity issues. In part, this lag in maturity can be attributed to 92% of technologists prioritizing rapid innovation across application development ahead of app security.
Safeguarding Cryptocurrency Exchanges: The Power of Machine Learning Monitoring
Bitcoin and Coinbase have been in some hot water lately. How they handle cryptocurrency might not be legal or safe. The lack of regulations is causing concern from the government about potential criminal activity, fraud, and money laundering. The good news? Rules are being implemented for crypto exchanges to stop corrupt events from happening. Regulations like Know Your Customer (KYC) are an absolute must for exchanges to keep operating legally.
Underutilized Azure Firewall Analysis with Kentik
Troubleshooting an Azure Load Balancer in Kentik Cloud
Azure Virtual WAN Observability with Kentik Cloud
Optimize Azure Costs and Boost Network Performance with Kentik
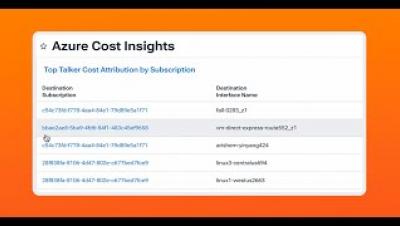
Azure Cost Attribution by Subscription with Kentik Cloud
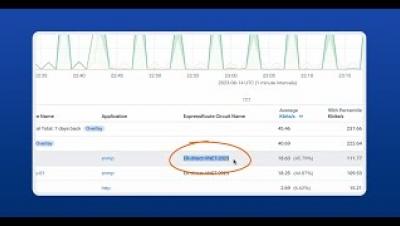
Troubleshooting an Azure ExpressRoute with Kentik Cloud
Putting the Network in Observability
Sumo Logic Customer Brown Bag - Observability - Performance Tuning - June 27th, 2023
Unleash the Potential of Your Log and Event Data, Including AI's Growing Impact
Advice when starting a new project.
Sentry Performance: application performance monitoring built for Developers
Network visibility makes all the difference! The key to Managed Service Providers to protecting your customer data
Best practices for monitoring CDN logs
By storing copies of your content in geographically distributed servers, content delivery networks (CDNs) enable you to extend the reach of your app without sacrificing performance. CDNs lessen the demand on individual web hosts by increasing the number and regional spread of servers that are able to respond to incoming requests for cached content. As a result, they can deliver web content faster and provide a better experience for your end users.
Troubleshoot with Kubernetes events
When Kubernetes components like nodes, pods, or containers change state—for example, if a pod transitions from pending to running—they automatically generate objects called events to document the change. Events provide key information about the health and status of your clusters—for example, they inform you if container creations are failing, or if pods are being rescheduled again and again. Monitoring these events can help you troubleshoot issues affecting your infrastructure.
Goliath Technologies ChromeOS Monitoring
Nearly 20 million new ChromeOS devices were shipped globally in 2022 according to IDC figures, with the large US education sector being by far the prime market for the platform. That’s a lot of endpoints to monitor and troubleshoot and Goliath Technologies has stepped up to this challenge, leveraging their exclusive access to some of Google’s API’s to build a platform to discover, check, and diagnose devices running the OS.
Exploring the Benefits and Trade-Offs of Microservices and Serverless Architectures
Just how in demand is serverless computing, really? Popularized by Amazon in 2014, serverless computing had already clinched the title of the highest-growth public cloud service as early as 2018. With its total market value shooting past the USD 9 billion mark in 2022 and projected to hit a jaw-dropping USD 90 billion by 2032, it’s safe to say this relative newcomer is doing quite alright for itself.
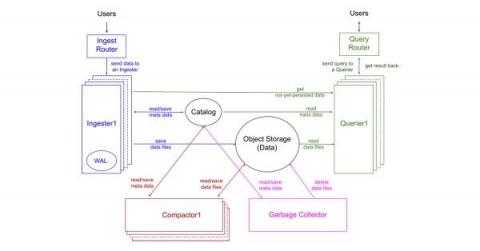
InfluxDB 3.0: System Architecture
InfluxDB 3.0 (previously known as InfluxDB IOx) is a (cloud) scalable database that offers high performance for both data loading and querying, and focuses on time series use cases. This article describes the system architecture of the database. Figure 1 shows the architecture of InfluxDB 3.0 that includes four major components and two main storages.
Expand Your Monitoring Capabilities with AppSignal's Standalone Agent Docker Image
Want to monitor all of your application's services? Our Standalone Agent allows you to monitor processes our standard integrations don't monitor by default, helping you effortlessly expand your monitoring capabilities. To help simplify the process of configuring our standalone agent, we're excited to announce the launch of our Standalone Agent's Docker image, available on Docker Hub under the name appsignal/agent.
Should I Stay or Should I Go? Get smarter about your refresh cycles
Deciding what to migrate, what to modernize, and what to retain on-premises is part of enterprise IT infrastructure management. When a refresh cycle is up in your data center, there are two very different types of competing motions you need to evaluate. While they may appear to be independent, they’re also kind of not, so it can be tricky to decide which one to execute—or even to execute both—and to do so smoothly.
How to Trial Honeycomb and OpenTelemetry
Insightful proof-of-concepts with a tool can be difficult to undertake due to the demands on valuable resources: time, energy, and people. With a task as grand as observability, how could one truly test if Honeycomb and OpenTelemetry are right for their organization and meet their requirements? For this thought experiment, here’s a comprehensive description of the ideal product evaluation over the course of four weeks, given unlimited resources.
The Curious Case Of Kubernetes Health Checks
Health checks for cloud infrastructure refer to the mechanisms and processes used to monitor the health and availability of the components within a cloud-based system. These checks are essential for ensuring that the infrastructure is functioning correctly and that any issues or failures are detected and addressed promptly. Health checks typically involve monitoring various parameters such as system resources, network connectivity, and application-specific metrics.
Azure Incident Management with Escalation Policy
Grafana k6 v0.45.0 release: gRPC streaming support, cloud script updates without running tests and more!
Grafana k6 v0.45.0 has been released, featuring a new experimental module for gRPC streaming support, a new browser recorder extension for Firefox and Chrome, and tons of improvements for Grafana k6 OSS and Grafana Cloud k6. Here’s a quick overview of the latest k6 release and all the news from the community.
The lowdown on Loki for log aggregation: 5 demos you don't want to miss
Looking to get started with log aggregation? Or perhaps take your logging game to a whole new, more advanced level? You’ve come to the right place. Grafana Loki is a key component of Grafana Labs’ open and composable Grafana LGTM stack (Loki for logs, Grafana for visualization, Tempo for traces, Mimir for metrics).
Monitoring with Graphite: Architecture and Concepts
In this article, we provide a concise guide to help you get started with Graphite quickly and efficiently. We cover the basic concepts, architectural considerations, and metrics aggregation of Graphite. We also explain the data feeding methods, metrics format, and storage using Graphite's file-based database. Additionally, we discuss visualization options, including Graphite-Web and Grafana.
Code Refactoring and why you should refactor your code
Software does not expire, but it “rots”. Its quality degrades over time. As you build your project and add features, you probably won’t always build it in a clean, orderly and mindful way. Especially if you have a tight deadline. So aside from features, you also produce bugs, code smells, and technical debt. That “rots” your software, but your job as a software engineer is to maintain its “freshness” while building on top of it.
The Goal With Every Release: Stay Laser Focused on Driving Value for Customers
As our customers share their frustrations with the volume and growth of their observability data, we’ve got our eyes set on making it easier to manage. Our Spring 4.1 Launch involved enhancements to the Cribl suite of products — Cribl Stream, Cribl Edge, and Cribl Search — that give users more choice and control over their end-to-end observability architecture.
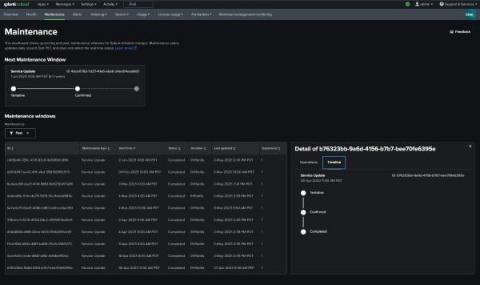
Announcing the General Availability of Cloud Monitoring Console's Maintenance Dashboard
NetOps in Action: Fidelity National Information Services, Inc. (FIS)
Fidelity National Information Services, Inc. (FIS) is an American multinational corporation which offers a wide range of financial products and services. FIS is most known for its development of Financial Technology, or FinTech. FIS has a portfolio of products for the financial services sector, including both retail and investment banking. FIS global customers connect to services from FIS’s Little Rock, AR datacenter.
3 models for logging with OpenTelemetry and Elastic
Arguably, OpenTelemetry exists to (greatly) increase usage of tracing and metrics among developers. That said, logging will continue to play a critical role in providing flexible, application-specific, event-driven data. Further, OpenTelemetry has the potential to bring added value to existing application logging flows.
What is Packet Duplication & How to Identify It
Application-Centric EUC Monitoring is Key to Digital Employee Experience (DEX)
Taking an application-centric approach to monitoring EUC technologies is essential to ensuring success and optimal DEX (Digital Employee Experience) when delivering desktops and apps via VDI / DaaS or from the Cloud. The EUC (End User Computing) community in recent years has increasingly focused on user experience and DEX (Digital Employee Experience) as key measures of success. Any EUC service ultimately needs to ensure users are satisfied and can work productively.
Engineers Read Reviews of Their Products Vol. 3
Centralized Observability: What, Why, and How?
Centralized Observability may not be a buzzword but its practicality and importance can’t be denied. Let’s see why is that. As DevOps and IT teams recognize the importance of Observability, it becomes a critical component to monitor the stack and ensure data reliability. That being said, enterprises are rapidly embracing modern data stacks to harness the power of data. Therefore, a host of platforms require data observability as a tool for reliable and trustworthy data management.
The Ultimate Beginner's Guide to AIOps
AWS ECS pricing optimization: Maximizing cost efficiency with CloudSpend
Amazon Elastic Container Service (ECS) is an extremely scalable and high-performing container orchestration solution that allows for the effortless execution, termination, and administration of Docker containers within a cluster. As more organizations embrace containerization, optimizing the costs of running containerized applications is essential, especially when using managed services like Amazon ECS.
Anomaly Detection With Graphite
Graphite is used by many organizations to track and visualize various metrics that their applications or servers send out. But what happens if there are too many of these metrics or the company doesn't want to use its human resources to monitor the behaviour of metrics constantly? In this article, we will use Hosted Graphite by MetricFire to learn about Graphite's ability to notify users about the abnormal behaviour of services or infrastructure in a timely manner.
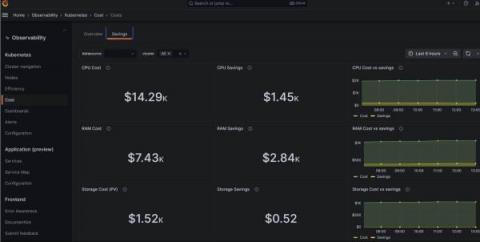
Rein in spending with Kubernetes cost monitoring in Grafana Cloud
As your Kubernetes infrastructure — and your business — grows, so too does the headache of managing your stack. And since controlling costs is crucial for your organization’s well-being, you need visibility into your complex system to ensure you’re spending your money wisely. That’s why we’re excited to introduce Kubernetes cost monitoring as a new feature in Grafana Cloud.
How to monitor an Apache CouchDB cluster with Grafana Cloud
We’re excited to introduce a dedicated Grafana Cloud integration for Apache CouchDB, a NoSQL document database that stores data in a JSON-based document format. Known for its scalability, availability, and easy replication of data across multiple servers, Apache CouchDB comes with a whole host of features designed to make it easy to run resilient distributed systems, with built-in bi-direcitonal replication allowing for simple replication across multiple servers and data centers.
5 reasons why Site24x7's plugin integrations can supercharge your infrastructure visibility
Delivering seamless digital experiences is a top priority for every business today. However, the IT infrastructures that fuel these experiences are getting increasingly complex. The rapid adoption of technologies like containerization, microservices, and cloud and serverless computing, along with traditional infrastructure, is creating increasingly hybrid and distributed IT ecosystems, making it a challenge for organizations to manage them effectively.
Cribl Stream Simplifies Complexity in Multi Cloud Adoption
You may be thinking of investing in multiple cloud vendors to increase redundancy and deal with the complexity of your enterprise requirements. You are not alone. Many enterprises are moving in this direction to take advantage of the options offered by competing cloud vendors. Adopting one major cloud vendor is a complex project that can consume a company for months if not years.
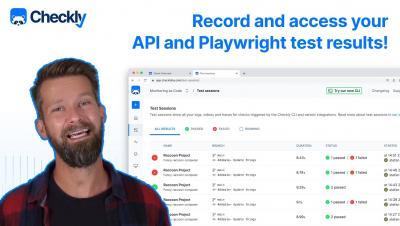
How to Record your API and Playwright tests with Checkly Test Sessions
Harnessing an observability solution to gain valuable insights into business operations
In my previous articles, I discussed how to design considerations for observability solutions and how observability can augment your security implementation. In this article, I will discuss how an observability solution can provide valuable insights into your business operations through the collected data from various systems, applications, and services.
Querying InfluxDB Cloud with the C++ Flight SQL Client
InfluxDB Cloud 3.0 is a versatile time series database built on top of the Apache ecosystem. You can query InfluxDB Cloud with the Apache Arrow Flight SQL interface, which provides SQL support for working with time series data. In this tutorial, we will walk through the process of querying InfluxDB Cloud with Flight SQL, using C++. The C++ Flight SQL Client is part of Apache Arrow Flight, a framework for building high-performance data services.
There Are No Repeat Incidents
People seem to struggle with the idea that there are no repeat incidents. It is very easy and natural to see two distinct outages, with nearly identical failure modes, impacting the same components, and with no significant action items as repeat incidents. However, when we look at the responses and their variations, we can find key distinctions that shows the incidents as related, but not identical.
AI-Augmented Software Engineering
Transformations in network technology
Streamlining Data Management for Enterprise Security | SpyCloud
Azure Event Grid Domain Monitoring: How to Configure
On-prem and more! | Netdata Office Hours #3
Modernizing your APM solution with a unified observability platform
Dashboard Fridays: Home Solar Power Monitoring dashboard
Dashboard Fridays: DORA Metrics
Dashboard Fridays: Scuba Diving
SigNoz - Open-source alternative to Dynatrace
Trace exemplars now available in Managed Service for Prometheus
Connect your metrics to your traces with exemplars to quickly troubleshoot and resolve latency issues.
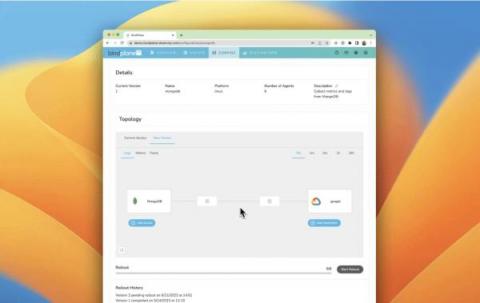
Configuration Management in BindPlane OP
AIOps as a time, quality and customer enabler
Time is precious and not for sale. Or is it? UMB AG, a leading Swiss IT service and managed services provider, takes the opposite view. Under the company motto "Creating Time", UMB provides its customers with more time which they use for their core business instead of IT administration. A core UMB service is complete support for SAP landscapes, be it on premise, in the UMB data centers or in the cloud. Here, UMB has relied on the artificial intelligence of the Avantra AIOps platform for a good five years in order to manage both its own SAP systems and its customers' as efficiently as possible.
Improving Access to Digital Services
Device level monitoring is a relic of the past. Today's global IT landscape delivers services not devices and support organizations need to keep pace in an ever changing and evolving consumption driven world.
How to check if a website is online
Querying InfluxDB 3.0 Using JDBC Driver for Tableau
InfluxDB 3.0 now offers support for connecting Tableau to InfluxDB 3.0 to query data for visualization using the Apache Arrow Flight SQL JDBC driver (Flight SQL driver). In this blog post, we will explore the capabilities and benefits of this integration and provide some instructions on how to connect them.
Exotic Trace Shapes
OpenTelemetry and Beelines were designed with assumptions about the types of traffic that most users would trace.
New in Grafana 10: Securely monitor and query network-secured data sources from Grafana Cloud
Grafana is designed to visualize data in beautiful dashboards, no matter where the information lives. However, if you are considering the hosted Grafana Cloud observability stack for visualizing your data, you might run into a roadblock: network security. The problem is that some data sources, like MySQL databases or Elasticsearch clusters, are hosted within private networks.
Sumo Logic Customer Brown Bag - Observability - Get Control - May 23rd 2023
Sumo Logic Customer Brown Bag -- Logging -- Performance Tuning -- June 13th 2023
Windows agents: Manual and unattended installation
How to connect a private data source
Decoding Logic App Dilemmas: How to Recurrence Trigger a Logic App at different hours and minutes?
Scaling Prometheus with Thanos for Long-Term Data
Prometheus, developed by SoundCloud, is a powerful open-source system for service monitoring and time series data storage. It collects metrics from configured targets, evaluates rule expressions, presents results, and triggers alerts based on defined conditions. Thanos, on the other hand, is a collection of components designed to create a highly available metric system with limitless storage capacity.
Top 12 Microsoft 365 Metrics
Essential metrics for monitoring M365 environments When it comes to managing your Microsoft 365 environment, monitoring metrics are essential to ensure the health and performance of your systems. With so many different metrics to track, it can be challenging to know where to begin. In this post, we will discuss the top 12 Microsoft 365 monitoring metrics that every expert should be tracking.
Leading oil and gas company saves $100,000 on downtime in a year with Applications Manager
The Carbon Daemons: Graphite monitoring
Graphite is a powerful open-source time series database used for storing, retrieving, and visualizing changing numeric data points over time. With its robust monitoring system, Graphite can efficiently handle large data loads without compromising performance. In this article, we delve into the basics of Graphite, focusing on its primary component, Carbon.
VictoriaMetrics bolsters move from monitoring to observability with VictoriaLogs release
Today we’re happy to announce our new open source, scalable logging solution, VictoriaLogs, which helps users and enterprises expand their current monitoring of applications into a more strategic ‘state of all systems’ enterprise-wide observability. Many existing logging solutions on the market today offer IT professionals a limited window into live operations of databases and clusters.
Founder & Friends: Making It Work with Scott Hanselman
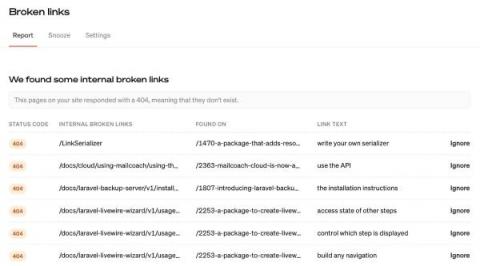
Monitoring for Broken Pages and Links
As the first point of contact with customers, a well-performing website can have a significant impact on the overall reputation of your business. Therefore, if a page is not functioning as it should on your website, this could have a detrimental effect. Have you ever been on a website and found it is not working as it should?
A User Guide for OpenSearch Dashboards
Over the last decade, log management has been largely dominated by the ELK Stack – a once-open source tool set that collects, processes, stores and analyzes log data. The ‘k’ in the ELK Stack represents Kibana, which is the component engineers use to query and visualize their log data stored in Elasticsearch. Sadly, in January 2021, Elastic decided to close source the ELK Stack, and as a result, OpenSearch was launched by AWS as an open source replacement.
Introduction to Apache Arrow
Customers First Always: Cribl's Support Team Shines in Gartner Peer Insights
Easy to implement, effective data management tools that provide fast time to value are the exception rather than the rule, and top-notch support for those tools is also hard to come by. That’s why Cribl prioritizes creating products that make the lives of engineers and systems admins as easy as possible. The reviews on Gartner Peer Insights give us a glimpse into how well we’re holding up our end of the bargain.
Smarter Database Monitoring: Tackling Performance Hiccups and Leveraging Data for Success
The cloud is the hub for data management nowadays. DevOps teams are all about preventing any hiccups that could make customers unhappy. And with more companies moving to cloud databases and services like SnowFlake, Redshift, RDS, and BigQuery, they’re operating on a bigger scale with better quality.
Using the Elastic Agent to monitor Amazon ECS and AWS Fargate with Elastic Observability
AWS Fargate is a serverless pay-as-you-go engine used for Amazon Elastic Container Service (ECS) to run Docker containers without having to manage servers or clusters. The goal of Fargate is to containerize your application and specify the OS, CPU and memory, networking, and IAM policies needed for launch. Additionally, AWS Fargate can be used with Elastic Kubernetes Service (EKS) in a similar manner.
Thousands of Customer-Driven Splunk Ideas Help Accelerate Meaningful Innovation
Metadata 101: Definition, Types & Examples
Using the Common Expression Language for Metric Filtering with Telegraf
Telegraf is an open-source plugin-driven agent for collecting, processing, aggregating, and writing time series data. When collecting metrics it is common to filter out or pass through metrics with specific names, tags, fields, or timestamp values. The Common Expression Language (CEL) is an open-source language that provides a set of semantics for expression evaluation.
How can you improve conversions on your website?
In this bi-weekly micro webinar series, Catchpoint and ITOps Times have teamed up to discuss six critical topics that are essential for ensuring Internet Resilience for your business. We’ve explored the importance of Internet Resilience and Internet Performance Monitoring (IPM). We’ve examined how Internet Resilience can drive revenue for e-commerce players and how companies can enhance their network and API performance.
Smart Monitoring and Predictive Analytics for Operations (OT) and Manufacturing
5 Easy Automation Opportunities to Simplify Your IT Processes
Ask Maria von Trapp from the Sound of Music what her favourite things are, and she’ll quickly rattle off a list including, raindrops on roses and whiskers on kittens and even brown paper packages tied up with strings. But over the years if you’ve ever asked me what my favourite things are (to Automate), I’ve often struggled to give an answer. The problem is, there is so much to choose from and where do you begin?
Logic App Best Practices, Tips, and Tricks: #35 Generate a Unique Identifier
From Troubleshooting to Business Analysis with Log Analytics
The generative AI societal shift
Once upon a time, not so long ago, the world was a different place. The idea of a "smartphone" was still a novelty, and the mobile phone was primarily a tool for making calls and, perhaps, sending the occasional text message. Yes, we had "smart" phones, but they were simpler, mostly geared toward business users and mostly used for, well, phone stuff. Web browsing? It was there, but light, not something you'd do for hours.
Dashboard Fridays: Fantasy Premier League Football Dashboard with Web API
Learn the top 4 best practices for effective firmware vulnerability management
Synthetic Monitoring for Microsoft Azure DaaS
The adoption of Microsoft Azure Desktop as a Service (DaaS) has significantly improved how businesses access and manage their desktop environments. However, as the number of users relying on DaaS increases, ensuring a seamless and reliable user experience becomes increasingly challenging. This blog post will explore businesses' key challenges in monitoring Microsoft Azure DaaS and how Synthetic Monitoring can help ensure a seamless user experience.
Enabling Cloud-Based Monitoring for Microsoft System Center Operations Manager
Accelerate your Microsoft SCOM-based monitoring in the cloud with cloud-based Monitoring for Microsoft System Center Operations Manager. Seamlessly integrate Microsoft’s new Azure Monitor SCOM Managed Instance (Azure SCOM MI) to complement your current monitoring capabilities and ensure optimal performance. Azure SCOM MI empowers you to bridge the gap between your on-premise and cloud environments, enabling you to scale your operations while reducing costs.
What Observability-Driven Development Is Not
At Honeycomb, we are all about observability. In the past, we have proposed observability-driven development as a way to maximize your observability and supercharge your development process. But I have a problem with the terminology, and it is: I don’t want observability to drive your development.
Monitoring Your IoT Devices Using Mosquitto and Graphite
Monitoring IoT devices is a very important process for analyzing their behavior and ensuring their performance. You need to choose the right monitoring tools to effectively collect and analyze metrics. In this article, we will learn how to monitor your IoT devices using Mosquitto and Graphite. You will also find out what benefits you can get using a Hosted Graphite solution from MetricFire. Check out MetricFire’s free trial to test all the features it provides.
WhatsUp Gold 2023.0: Greater Transparency and Wider Access to Network Data
One of the greatest challenges for an IT team is visibility. How can you prove the value of your IT team’s accomplishments when no one can see what – or how well – you’re doing? Progress WhatsUp Gold release 2023.0, available as of June 21, 2023, is set to change that. This release includes several exciting updates meant to provide better data access to all.
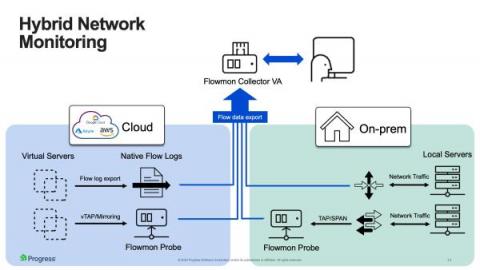
What's Your Flow? The Differences Between J-Flow, NetFlow and More
To track IP traffic flows and record metadata, IT professionals use network flow monitoring protocols and supporting solutions to collect and analyze data.
Monitor network access with Twingate's offering in the Datadog Marketplace
Twingate is a network access platform that enables customers to deploy a zero trust authentication layer with their infrastructure as code (IAC) provider of choice. Using this model, you can program strict access control rules that can be updated and co-deployed alongside changes to your infrastructure. Each time a user establishes or closes a connection to a resource, Twingate documents the event with details such as the port, the volume of data transferred, and user identification.
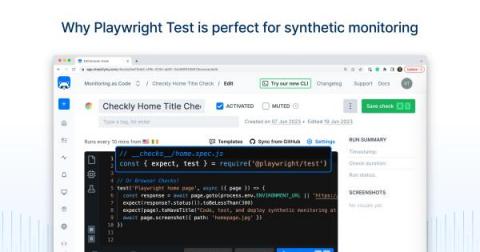
Synthetic Monitoring With Checkly and Playwright Test
One of the most effective ways to monitor a critical user flow on a website—or monitor the operation of a critical API that other applications depended on—is to adopt synthetic monitoring. Synthetic monitoring is an approach to monitoring websites and applications that simulates the actions of real users via browser automation. It mirrors the actions that a visitor may take on your website, say browsing an online shop, adding items to a shopping cart, and then checking out.
Netreo How To: Troubleshooting Configuration Backup Issues
Self-service can be a point of contention when it comes to certain industries, products and customer groups. Not everyone has the time or inclination for any type of DIY automobile fix, for example. Conversely, time is always of the essence when it comes to ensuring the real-time performance of business technology solutions. Therefore, many IT pros, especially those in network management, are more than willing to do it themselves.
Building big picture insights for better digital public services
Leverage context and insights across applications and infrastructure to deliver high-performing public sector digital experiences for citizens and staff. Digital transformations are accelerating everywhere, and the public sector is no exception. Like most organizations, federal, state and local agencies rely on infrastructure to deliver the most critical applications and services to citizens.
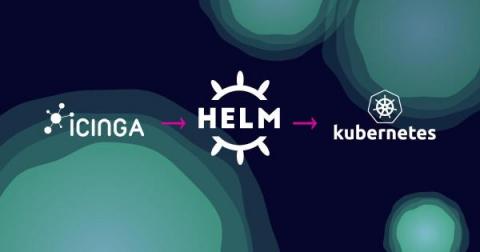
Icinga Kubernetes Helm Charts
Before attending Icinga Berlin in May this year, Daniel Bodky and Markus Opolka from our partner NETWAYS developed the very first Icinga Kubernetes Helm Charts and released it in an alpha version. If you have ever wanted to deploy an entire Icinga stack in your Kubernetes cluster, now is your chance. I also want to highlight Daniel’s talk again on how Icinga can run on Kubernetes and the challenges involved.
Monitoring Real-Time Stock Quotes with MetricFire
In the ever-evolving stock market landscape, immediate access to accurate information is crucial for investors and financial experts alike. In this piece, titled "Monitoring Real-Time Stock Quotes with MetricFire," we dive deep into the realm of advanced technology, focusing on its potential to transform stock market tracking and decision-making procedures.
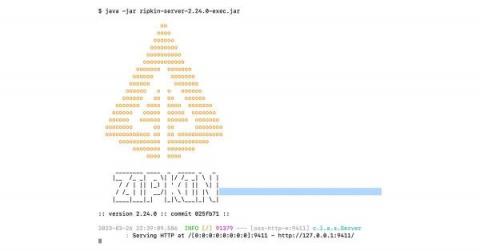
Perform Distributed Tracing with Zipkin
Open source Zipkin offers a robust set of features that make it easier for developers to understand and optimize complex distributed systems. Distributed tracing is a technique you can use to trace and monitor requests propagating through a distributed system. It can work in environments where multiple services process a request, making it an essential tool for modern microservices architectures. Zipkin is an open source distributed tracing system for monitoring and troubleshooting complex systems.
GrafanaCON 2023 keynote: Grafana 10, cool new dashboards, and more
Logic App Best Practices, Tips, and Tricks: #34 How to validate JSON messages
Quickly and securely enable monitoring for your entire Google Cloud environment
A foundational component of monitoring Google Cloud environments with Datadog is our Google Cloud Platform integration. This integration continuously collects metrics from all of your Google Cloud services and enriches them with tags, enabling you to scope dashboards and monitors to the relevant resources and seamlessly pivot across logs, metrics, and traces inside the Datadog platform.
Why Observability is Better with a Storage-less Architecture
In today’s data-driven world, the need for comprehensive observability has never been greater. Organizations rely on observability to gain insights into their systems’ and applications’ performance, availability, and behavior. However, the traditional approach to observability, which involves ingesting, processing, and storing massive amounts of data, is becoming increasingly challenging and expensive.
Azure Integration with Graphite and Grafana
In this article, we will see how we can integrate an Azure data source with Graphite and Grafana. This will allow us to monitor metrics from the applications hosted in the Azure cloud on a Grafana dashboard. We will also see how to integrate Azure Active Directory with MetricFire’s Hosted Graphite and Grafana. You don’t need fully functional cloud services running with Azure to understand this article, but it assumes that you have basic familiarity with Azure Cloud.
Understanding Network Traffic Monitoring
Network traffic monitoring has become critical in today's digital age, where businesses rely on various applications and services to operate. As the amount of data transmitted over networks continues to grow exponentially, network administrators must keep a close eye on the traffic to ensure optimal network performance and security. Network administrators must have a deep understanding of packet flows, collection methods, and analytics to ensure that their networks are secure and performing optimally.
The Evils of Data Debt
In this livestream, Jackie McGuire and I discuss the harmful effects of data debt on observability and security teams. Data debt is a pervasive problem that increases costs and produces poor results across observability and security. Simply put — garbage in equals garbage out. We delve into what data debt is and some long term solutions. You can also subscribe to Cribl’s podcast to listen on the go!
Goats on the Road: 3 Key Takeaways From the 2023 AWS Summit in Washington, DC
The Cribl team just wrapped up the 2023 AWS Summit in Washington, DC, and we were thrilled to spend a few days chatting with public sector organizations looking to gain the freedom and flexibility our products offer.
How to observe your TensorFlow Serving instances with Grafana Cloud
The world of AI and machine learning has evolved at an accelerated pace these past few years, and the advent of ChatGPT, DALL-E, and Stable Diffusion has brought a lot of additional attention to the topic. Being aware of this, Grafana Labs prepared an integration for monitoring one of the most used machine learning model servers available: TensorFlow Serving. TensorFlow Serving is an open source, flexible serving system built to support the use of machine learning models at scale.
How many metrics? A guide to estimating the size of your system in Grafana Cloud
Grafana Cloud, our composable observability platform, is billed based on usage. A common question we get is: “How much will it cost to monitor N servers?” Well, the recently expanded Grafana Cloud Free tier includes up to 10,000 active series. To help you understand what that translates to in terms of time series requirements, here’s a rough guide to estimating what you’ll need.
Introduction to Collecting Traces with OpenTelemetry
OpenTelemetry (also abbreviated as OTEL) is an increasingly popular open-source observability platform under the Cloud Native Computing Foundation (CNCF), which is currently the most active project in the CNCF after Kubernetes. It was created to establish a unified and vendor-agnostic way for instrumenting, collecting, and exporting telemetry data for your system and application across traces, logs, and metrics.
15 years of unwavering customer trust: the Site24x7 story
Drawing synergy from ManageEngine, Zoho Corporation's business IT division, Site24x7 grew steadily to cover all geographies and sectors. We extended observability to cover the entire gamut of the rapidly changing IT infrastructure landscape. Today, Site24x7 is an AI-powered, comprehensive IT monitoring solution with a keen eye on privacy and security.
Parsing websites in C# with Html Agility Pack or AngleSharp
While developing the "new" canonical check feature for elmah.io Uptime Monitoring, I had to parse a website from C# and inspect the DOM. I have been using Html Agility Pack in the past so this was an obvious choice. I also looked at what happened in the space and found that AngleSharp is an excellent alternative. In this blog post, I'll showcase both frameworks to help you get started.
OpenTelemetry Security: How To Keep Telemetry Data Safe
Production Driven Development: An Approach for Highly Effective Organizations
Testing is still the most arduous, painful, and expensive task within a DevOps practice, regardless of framework or approach. Why? Because the current approaches to testing and development are not focused on production. Production-Driven Development (PDD), allows for rapid iteration without sacrificing stability or confidence. Following PDD, a small team or single developer can launch an application in weeks that used to take multiple teams months or a year.
Sustainable IT Is the Future & The Future Is Now
At Nexthink, we are committed to supporting our customers as they accelerate sustainable IT improvements in the global fight against climate change. Through our Sustainable IT solution, we aim to provides vital insights to help IT and EUC professionals embed sustainability into the core of their IT strategy. The great news is that doing this leads directly to operational efficiency and cost savings. We hope every company keeps this in mind as they accelerate their sustainable IT efforts.
Applying Zero Trust to Data Centre Networks
Zero trust isn’t an approach that can be delivered by buying a single product that claims to provide it. Instead, it is an approach that needs to be understood and implemented in complementary ways across an organization’s IT systems. We recently hosted a webinar titled Applying Zero Trust to Data Centre Networks to provide guidance on how organizations can use zero trust to enhance the security of their IT systems. The webinar details are below, after a summary of the topics covered.
Logic App Best Practices, Tips, and Tricks: #33 Specifying JSON Schema restrictions
New Features in Goliath Performance Monitor 12.1 Release
Goliath monitoring & troubleshooting software for EUC workspace environments lets you perfectly monitor your Citrix/VMware end-user computer environment. With their GPM 12.1 release, Goliath has added many new features to help you better monitor end user experience. In this blog, I will explain the new features and give real-world use cases for these features.
Monitor NetFlow traffic data with Datadog
NetFlow is a network protocol that enables devices to report key traffic flow data such as origin, direction, and overall volume.
Stack Trace to Error - Direct Link
Application Monitoring 101 - Developer's Top Five Tips for Monitoring Application Performance
Cloud Native Application Observability - Trace-Logs Correlation
Errors Playground: Episode 2 Recap & What's next
Engineers Read Reviews of Their Products Vol. 2
Graphite vs Prometheus
Compare Graphite and Prometheus, two leading open-source monitoring solutions.
Protocol analyzer: What is it, and why does your organization need one?
IT admins are expected to keep the organization’s network reliable and resilient all while the complexity of today’s networks grows. From adopting hybrid infrastructures and maintaining multi-cloud environments’ security to managing ever-increasing bandwidth demands, enterprise network management is getting more difficult by day.
Impact of AI on IT Operations
Revolutionize Your Enterprise Operations with CloudFabrix Observability Data Modernization
Grafana Plugins Explained
Grafana is a powerful open-source visualization solution that provides valuable insights into the performance of infrastructure, applications, and servers. With customizable visualizations and support for diverse data sources and formats, Grafana allows IT teams to collect and visualize data from various sources.
Top 15 Infrastructure Monitoring Tools
The history of monitoring on the web
Real time, per-second System Monitoring with Netdata!
HA Kubernetes Monitoring using Prometheus and Thanos
In this article, we will deploy a clustered Prometheus setup that integrates Thanos. It is resilient against node failures and ensures appropriate data archiving. The setup is also scalable. It can span multiple Kubernetes clusters under the same monitoring umbrella. Finally, we will visualize and monitor all our data in accessible and beautiful Grafana dashboards.
Business Observability: Everything Fintech Companies Want to Know
Fintech companies operate in a complex technological and regulatory environment. They rely heavily on cloud-native technologies and microservices architectures to handle financial transactions and data, often at a massive scale. To maximize application reliability, fintech companies need full visibility into their software systems and applications. An agile monitoring solution like observability is crucial to improving performance and user experience.
The 2023 Observability Market Map - Key Trends, Players, and Directions
Cribl has a unique position right in the middle of the observability market, giving us a distinct view of all things security, APM, and log analysis. Observability as a concept has exploded into specialized areas over the past two years, and making sense of the players and market forces, particularly in a difficult macro environment, can be tricky. Let’s break it down.
Logic App Best Practices, Tips, and Tricks: #32 Specifying JSON Schema required elements
How To Perform Dynamic Code Instrumentation in a Python Application
Code instrumentation is an essential practice in modern software development. Not only does it aid in debugging, it ultimately impacts the MTTR (Mean Time to Resolve) for software running in production. With changing software architectures and deployment patterns over the years, approaches to code instrumentation have also undergone a significant shift.
Discover Pandora FMS best features 2022-2023 (Part II)
RapidSpike ROI Calculator
Our lessons from the latest AWS us-east-1 outage
Stile Education's Best-of-Breed Observability Strategy
New in Cloud Monitoring: Better tools for analysis, uptime checks, and alerts
We recently launched several new Cloud Monitoring features to improve your visualization and troubleshooting experience.
2022 State of DevOps Report data deep dive: Documentation is like sunshine
The State of DevOps Report finds a clear link between documentation quality and an organization’s ability to meet its performance goals.
Celebrating Grafana 10: Torkel's top 10 moments from a decade of dashboarding
Grafana creator Torkel Ödegaard will never forget the very first GrafanaCON in 2015, when he shared some big news with the audience gathered in New York City. “I’ll always remember standing on stage and announcing that we just reached 12,000 instances and being super proud because it was just a couple of months after we started tracking these numbers,” says Torkel, who also launched Grafana Labs with co-founders Raj Dutt and Anthony Woods in 2014.
FWaaS (Firewall as a Service): How to Monitor Your Traffic Through Cloud
Cybersecurity remains a key concern for any organization. The cost of cybercrime is expected to rise to $8 trillion in 2023 and reach $10.5 trillion by 2025. Various cybersecurity solutions are available, with Firewall as a Service (FWaaS) emerging as one of the most valuable assets when it comes to protecting your interests. We will investigate FWaaS solutions, how they work, how they're different from traditional firewalls, and what benefits they can provide for a range of organizations.
Improving LLMs in Production With Observability
Quickly: if you’re interested in observability for LLMs, we’d love to talk to you! And now for our regularly scheduled content: In early May, we released the first version of our new natural language querying interface, Query Assistant. We also talked a lot about the hard stuff we encountered when building and releasing this feature to all Honeycomb customers. But what we didn’t talk about was how we know how our use of an LLM is doing in production!
Troubleshooting Microsoft OneDrive
Release 1.40.0 - Dashboard Summary Tiles, Silencing alerts, ML tweaks and more!
Querying and Writing to InfluxDB Cloud and the Status of Client Libraries
InfluxDB 3.0 is a versatile time series database built on top of the Apache ecosystem. The 3.0 product suite includes two cloud-based versions: InfluxDB Cloud Serverless, and InfluxDB Cloud Dedicated. For the purposes of this post, InfluxDB Cloud refers to these specific versions of InfluxDB. This post provides an update on the status of the client libraries for InfluxDB Cloud, as well as all the available resources to get started querying and writing data to InfluxDB.
What Is A Time-Series Metric?
Today, businesses and organizations rely heavily on metrics and analytics to make informed decisions. Metrics are important whether you’re a developer, a marketer, or the head of a company. One type of metric that is widely used is a time-series metric. Time-series metrics provide insights into how data changes over time. With time-series data, businesses can track trends, detect anomalies, and make predictions.
Introducing Goliath Technologies ChromeOS Device Monitoring and Troubleshooting Solution
Goliath Technologies recently introduced their ChromeOS Device Monitoring and Troubleshooting Solution. They have partnered with Google to be able to provide rich data about the performance and health of ChromeOS and ChromeOS Flex devices. Goliath Technologies is the only monitoring and troubleshooting platform that has access to the Google APIs to get this ChromeOS data. The Goliath Technologies solution tackles issues using a user experience monitoring model.
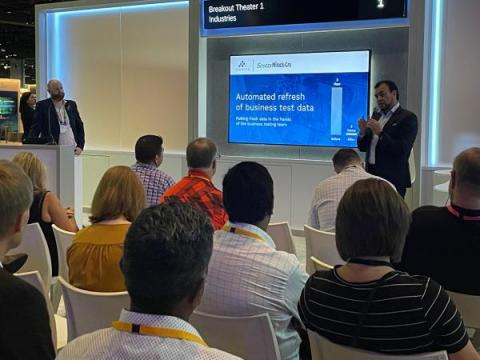
Not staying in Vegas - Cisco Live 2023 Trends and Innovations
Ronak Desai, SVP & GM, Cisco AppDynamics & Full-Stack Observability shares his thoughts on a week full of game-changing announcements and digital transformation at Cisco Live. Cisco Live is always one of my favorite weeks, and this year did not disappoint. As someone who has been with Cisco for over two decades, this event was especially significant for me, as it marked my first Cisco Live US leading Cisco AppDynamics and Full-Stack Observability.
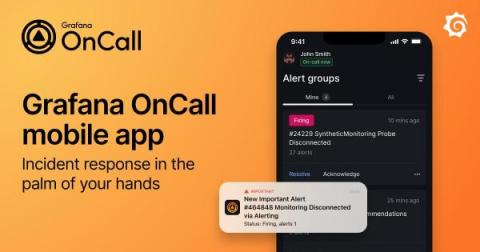
Introducing: Grafana OnCall mobile app
Getting Your Logs In Order: A Guide to Normalizing with Graylog
If you work with large amounts of log data, you know how challenging it can be to analyze that data and extract meaningful insights. One way to make log analysis easier is to normalize your log messages. In this post, we’ll explain why log message normalization is important and how to do it in Graylog.
Short Descriptions in BindPlane OP
Top 10 Log Management Tools in 2023
Log Management tools are crucial for the security and performance of your IT infrastructure. With the right log management system, you can quickly detect and respond to any anomaly or performance issue. Presently, there are numerous log management platforms. Each with its own unique set of features and benefits. While most of these platforms offer industry-standard capabilities, what sets them apart from each other are the stand-out features, pricing, and overall user experience.
PostgreSQL Database Monitoring
PostgreSQL is one of the most popular relational databases on the market today with more than 1.5 billion users. This article will discuss everything you need to know about monitoring PostgreSQL, and how you can use it to optimize your site's data monitoring. If you want to get started right away on PostgreSQL database monitoring with MetricFire, you can book a demo or sign up for the free trial today.
The Challenges of Switching from MPLS to Broadband
Let's start by simply stating that MPLS is arguably still the leading way to interconnect remote offices back to the company’s primary data centers. MPLS is also great for real-time traffic (like video conferencing). Yet even with those facts working in MPLS’s favor, its usage is dropping year after year. According to TeleGeography’s annual WAN Manager Survey, there was a 24% drop from 2019 to 2020 – and that trend hasn’t slowed down.
eG Innovations achieves Amazon Web Services (AWS) Digital Workplace Competency status
We are delighted to be able to share that eG Innovations has become one of a very small number of partners to have achieved the AWS “Digital Workplace Competency” award following a lengthy and rigorous technical audit process. The designation differentiates eG Innovations, alongside EUC vendors such as Citrix and VMware, as having a solution that meets AWS’s own standards for enterprise software.
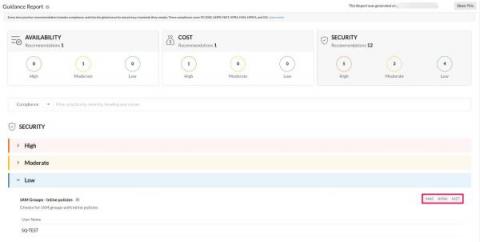
Top 7 compliance checks that you shouldn't miss in AWS monitoring
AWS Monitoring-Guidance report compliance checks As a business owner, you may experience lapses in the compliance and security checks in your AWS environment. With Site24x7 AWS guidance reports, businesses can ensure their deployments adhere to standards in cost, performance, and the security of their AWS environment and make informed decisions about how to optimize their cloud infrastructure.
Fundamentals of Searching Observability Data: Understanding the Search Process Can Save Time, Complexity, and Money!
On June 28th I will be hosting a webinar, ‘The Fundamentals of Searching Observability Data’. So why should you attend? Because things have, and will continue to change in the way we manage the IT data collected across the enterprise. A recent study shows that enterprises create over 64 zettabytes (ZB) of data, and that number is growing at a 27 percent compound annual growth rate (CAGR). The scary part?
Storing Secrets with Telegraf
Telegraf is an open source plugin-driven agent for collecting, processing, aggregating, and writing time series data. Telegraf relies on user-provided configuration files to define the various plugins and flow of this data. These configurations may require secrets or other sensitive data. The new secret store plugin type allows a user to store secrets and reference those secrets in their Telegraf configuration file.
C-Suite Call Troubleshooting | Digital Workplace Games
Organizational Change Management Models: 4 Models for Driving Change
Where No (Enterprise) WAN Has Gone Before
Today’s modern enterprise WAN is a mix of public internet, cloud provider networks, SD-WAN overlays, containers, and CASBs. This means that as we develop a network visibility strategy, we must go where no engineer has gone before to meet the needs of how applications are delivered today.
The Ultimate IPM Checklist
Infrastructure performance management (IPM) is the process and associated tools for ensuring the overall health of your entire IT ecosystem so it operates at optimal levels. Because your infrastructure supports your entire enterprise—from daily operations to strategic initiatives—the stakes are high.
Accelerating Log Management with Logging as a Service
The basic goal of log management is to make log data easy to locate and understand so that users can identify how their services are performing and troubleshoot more quickly. Logging as a Service, or LaaS, takes log management a step further by providing a solution that seamlessly scales and manages your log data via cloud-native architecture.
What Is AWS EKS, and How Does It Work With Kubernetes?
Make Monitoring Easier with Simple Tools.
Everything You Need to Know About Log Management Challenges
Distributed microservices and cloud computing have been game changers for developers and enterprises. These services have helped enterprises develop complex systems easily and deploy apps faster. That being said, these new system architectures have also introduced some modern challenges. For example, monitoring data logs generated across various distributed systems can be problematic.
How to Identify Network Bottlenecks: From Snail Mail to Warp Speed
How to Diagnose Network Problems: The Ultimate Handbook
Save 15% on Hardware Renewals | Digital Workplace Games
Digital Leap: Understanding the Transformative Impact of Software on Healthcare
5 important Oracle Cloud Compute monitoring metrics
Applications Manager offers Oracle Cloud Compute monitoring that tracks the health, availability, and performance of your Oracle Cloud Infrastructure (OCI) instances. Applications Manager effectively enables DevOps teams to establish a secure and dependable environment for application development and deployment. Without an Oracle Cloud Compute monitor like Applications Manager, administrators would have to manually check each component of an instance to identify performance issues and rectify them.
Understanding Multi Cloud Observability
IT, DevOps, and security teams are figuring out the best ways to manage their complex, ever-growing, ever-changing environments. And one contributing factor to all the complexity is the rise of using multiple cloud services. One cloud service to manage is difficult enough, but adding more to the mix — each with its own interface and set of tools — makes everyone’s job significantly more difficult.
Logic App Best Practices, Tips, and Tricks: #31 Specifying JSON Schema elements nullable
The 4 Best Datadog Alternatives for 2023
If you work as a CTO, then you already know that having robust monitoring and analytical tools for your technology stack is a prerequisite to getting your job done right. Many companies that started off using Datadog discovered that it can become prohibitively expensive and complex when they needed to scale. As such, there are a lot of people out there currently seeking out alternatives.
The 5 Best Log Monitoring Tools for 2023
Any web-based business must have effective log monitoring in place to guarantee the efficient operation of its applications and systems. Tools for log monitoring are essential for error detection, performance analysis, and problem-solving. The top five log monitoring tools will be examined in this post, along with their features, prices, advantages, and disadvantages.
No, the average cost of downtime is not $5600 per minute
Monitor GitLab with Datadog
GitLab is a DevSecOps platform that helps engineering teams automate software delivery. Using GitLab, teams can easily collaborate on projects and quickly deliver application code with robust CI/CD, security, and testing features. Datadog’s GitLab integration enables you to monitor your GitLab instances alongside the rest of your infrastructure by collecting GitLab metrics, logs, and service checks.
Monitor machine learning models with Fiddler's offering in the Datadog Marketplace
With the growing utilization of AI, modern business applications rely more and more on machine learning (ML) models. But the complexity of these models poses significant challenges to data scientists, engineers, and MLOps teams seeking to maintain and optimize performance.
Simplifying log data management: Harness the power of flexible routing with Elastic
In Elasticsearch 8.8, we’re introducing the reroute processor in technical preview that makes it possible to send documents, such as logs, to different data streams, according to flexible routing rules. When using Elastic Observability, this gives you more granular control over your data with regard to retention, permissions, and processing with all the potential benefits of the data stream naming scheme. While optimized for data streams, the reroute processor also works with classic indices.
Dynamic Observability Tools for API Live Debugging
Application Programming Interfaces (APIs) are a crucial building block in modern software development, allowing applications to communicate with each other and share data consistently. APIs are used to exchange data inside and between organizations, and the widespread adoption of microservices and asynchronous patterns boosted API adoption inside the application itself.
Getting Started with Honeycomb Buildevents and GitHub Actions
Workshop: 2023 Kubernetes Troubleshooting Challenge
Federated Data Explained: Empowering Privacy, Innovation & Efficiency
Using Data for Good: The Web Vitals Index
RapidSpike is committed to revolutionising website reliability, performance, and security — to make the web faster, safer, and easier for everyone to use. With the direct correlation between website speed and conversion now widely acknowledged, even marginal gains of 0.1% could represent millions of extra revenue for the UK’s largest brands.
A Strategic Approach to Replacing Data Historians
Recently, I wrote an article discussing why industrial organizations should migrate from legacy data historians to modern, open source technologies. The reasons for such a migration remain valid; however, it dawned on me that such a heavy-handed approach is not always right for every organization.
Understanding Linux Logs: 16 Linux Log Files You Must be Monitoring
Logging provides a wealth of information about system events, errors, warnings, and activities. When troubleshooting issues, logs can be invaluable for identifying the root cause of problems, understanding the sequence of events leading to an issue, and determining the necessary steps for resolution. By regularly analyzing logs, administrators can identify performance bottlenecks, resource limitations, and abnormal system behavior.
No, You Haven't Missed the Streaming Telemetry Bandwagon - Part 1
Streaming telemetry holds the promise of radically improving the reliability and performance of today’s complex network infrastructures, but it does come with caveats. In the first of a new series, Kentik CEO Avi Freedman covers streaming telemetry’s history and original development.
How Our Love of Dogfooding Led to a Full-Scale Kubernetes Migration
The benefits of going cloud-native are far reaching: faster scaling, increased flexibility, and reduced infrastructure costs. According to Gartner®, “by 2027, more than 90% of global organizations will be running containerized applications in production, which is a significant increase from fewer than 40% in 2021.” Yet, while the adoption of containers and Kubernetes is growing, it comes with increased operational complexity, especially around monitoring and visibility.
What is High Cardinality
Overview of what is high cardinality in the context of monitoring using Prometheus and Grafana.
Hello cron job monitoring & alerts, goodbye silent failures
Recap of Icinga Camp Berlin 2023
It was a nice sunny morning, the weather really with us, for our Icinga Camp Berlin this year. When I peeked outside after helping with the setup, people were already mingling, getting ready to check in and get their first coffee to prepare for the day ahead. Bernd took the stage, welcoming everyone with genuine enthusiasm, setting the tone for what promised to be an engaging event. Surrounded by our community, I felt right at home – ready to dive into the talks and connect with new friends.
The Rise of Open Standards in Observability: Highlights from KubeCon
Today’s IT systems are ever more fragmented. It is commonplace to see polyglot systems, written in multiple programming languages, and using a plethora of tools and cloud services as infrastructure building blocks, whether data stores, web proxy or other functions. In this dynamic cloud-native realm, open standards and open specifications have become integral drivers of compatibility, collaboration, and convergence – the Three C’s of Open Standards, if you will.
Native Cloud Tools: Understanding Their Benefits for FinOps
Cloud tools are becoming indispensable for modern-day FinOps. They can improve efficiency and agility and deliver better client results. But what native cloud tools are right for you, and how can they benefit FinOps? Let’s find out. When managing financial operations in your organization, using native cloud tools is a must. Let’s take a closer look at some key advantages.
Account Observability
We're thrilled to announce the launch of Rollbar's latest initiative to provide greater transparency and control over your occurrences. Our team has worked hard to address customers' feedback and concerns based on your occurrences and overages. We are excited to introduce a new level of observability to our platform.
The Art of Using Execution tags to Troubleshoot ECS
In the grand tapestry of software engineering, our journey often winds through labyrinthine layers of application logic. Here, bugs play a compelling game of hide-and-seek, and features dance in an unpredictable ballet. During these instances of fervent exploration, we find ourselves longing for a reliable compass—a secret weapon—to help us decipher the riddles that lie ahead. Cue execution tags, our luminous lighthouse cutting through the dense fog of complexity.
Graphite for Node.js Monitoring
In this article, we will look at how to monitor Node.js applications using Graphite and StatsD and plot the visualizations on a Grafana dashboard. Node.js is a popular framework for creating microservices. Its asynchronous nature allows for high scalability and low latency, especially for I/O bound tasks. However, it is important to have a proper monitoring setup for any application which is running in a production environment.
Stackify by Netreo Receives "Best in Show" for Performance Monitoring in the 2023 SD Times 100
Stackify by Netreo received top honors from SD Times for Performance Monitoring in the 2023 SD Times 100. Each year, SD Times editors recognize leaders in the industry across 10 different categories and designate companies with “Best in Show” honors. Retrace APM is a full lifecycle APM solution and the driving force behind the successful placement within the SD Times 100 each of the past 5 years!
It's Official, Scout is SOC 2 Certified
Valued customers, friends, and Scout APM users: Our goal has always been to provide you with the peace of mind of knowing your systems are healthy and serving your customers as expected. While security has always been paramount to us, we’ve recently made it official. We are thrilled to share with you a recent significant achievement for our team and those who trust us with their data. After many months of hard work, we have obtained our SOC 2 certification!
How to Check & Monitor Disk Space Remotely with PowerShell Script
Monitoring disk space is a basic but core component of proactive IT support, critical to reducing ticket volume and maintaining system health and stability. Running low on or running out of disk space can obviously be responsible for a host of issues and user complaints — from application failures to complete system crashes — so creating alerts for when drives fall below a specified threshold is a great way to head those off.
GrafanaCON 2023 Day 2 Recap: A Grafana 10 deep-dive, Grafana Tempo and Mimir updates, home automation, and more
Today marked the second full day of GrafanaCON 2023, and all the excitement from yesterday certainly did not wane. Attendees and speakers alike continued to buzz about the Grafana 10 release — and so much more.
What Is Jitter in Networking: The Network Jitterbug
Release 1.40.0: Dashboard Summary Tiles, Silencing alerts, ML tweaks and more!
Another release of the Netdata Monitoring solution is here!
Exoprise Service Watch Named Leading DEM Solution for Today's Cloud Powered Digital Workplace
Catchpoint Internet Performance Monitoring (IPM) Capabilities for AIOps are now available in the BMC MarketZone program
Monitoring Cisco NX OS metrics with Grafana
In this article, we will explore what Cisco NX OS is and what it is used for. You will find out what metrics are and why it is very important to monitor them. Then, we will look at how to monitor Cisco NX OS metrics with Grafana, a graphical data visualization tool, and how MetricFire can help us with this. In order to learn more about MetricFire, book a demo with our technical specialists or sign up for the MetricFire free trial today.
API Monitoring with Kentik
API monitoring is the process of keeping tabs on the performance of your REST APIs. Learn how Kentik’s API monitoring tools let you identify bottlenecks, spot performance drops, and maintain availability to ensure a quality experience for your end users. Learn more in this API monitoring tutorial.
Don't Let Observability Inflate Your Cloud Costs
We saw a shift this year in how the technology sector honed in on sustainability from a cost perspective. In particular, looking at where they’re spending that revenue in the infrastructure and tooling space. Observability tooling comes under a lot of scrutiny as it’s perceived as a large cost center—and one that could be cut without affecting revenue. After all, if the business hasn’t had a problem in the last few months, we mustn’t need monitoring—right?
Grafana 10 release: New panels, Grafana as code updates, data correlations, and more
We are beyond thrilled to announce the arrival of Grafana 10, which was highlighted during the GrafanaCON 2023 keynote. The latest major release of the popular visualization and monitoring tool, which now has more than 20 million users around the world, is not just about introducing new features. Grafana 10 is also about enabling you to achieve more — more analysis, more collaboration, more insights, more efficiency and, of course, more beautiful dashboards. Grafana: download now!
GrafanaCON 2023: A guide to all the big announcements from Grafana Labs
GrafanaCON 2023 marks a huge milestone: It’s the official release of Grafana 10 and also the kick-off to celebrating a decade of dashboarding with Grafana. The GrafanaCON 2023 opening keynote, delivered by Grafana Labs co-founders Raj Dutt, Torkel Ödegaard, and Anthony Wood, streamed live on June 13 from Stockholm, Sweden, the birthplace of Grafana.
Use CIDR notation queries to filter your network traffic logs
Classless Inter-Domain Routing (CIDR) is the dominant IP addressing scheme in the modern web. By enabling network engineers to create subnets that encapsulate a set range of IP addresses, CIDR facilitates the flexible and efficient allocation of IPs in virtual private clouds (VPCs) and other networks.
8 Tips for Better Logging in Games
Gaming apps are complex systems. They combine multi-function systems, like the game engine, to other resources such as server containers, proxies and CDNs in order to give users a real-time interactive experience. At the same time, managing cross-functional behavior also means that games could generate massive amounts of data, commonly known as logs. You’ll want to turn that data into useful information to help improve game performance.
The First 100 Days With Cribl Stream: Start at the End to Progress Faster
A reference architecture is a lovely document, but they rarely help engineers and architects implement their tools effectively. Most reference architectures offer plenty of suggestions and ideas, but not enough context. We will explore ways to make reference architectures more useful while reducing reliance on the vague and dreaded “It Depends. Cribl has just released its first official reference architecture.
ML Spotlight | Netdata Office Hours | June 7th 2023
Errors Playground: Episode 1 Recap & What's next
The Hidden Danger of Websites Relying on Third Party Software: A Case Study with 5 Key Takeaways
Using third party software on websites comes with risk and reward. eCommerce sites and platforms typically rely on the integration of a significant number of third-party apps and tools to augment functionality and features, from extracting customer data for personalization to enabling live chat to analyzing user experience of changes to a site. While third parties are often invaluable for these kinds of interactive purposes, they can also be the cause of disruptions to user experience.
DIY SD-WAN vs. Managed SD-WAN
Software-Defined Wide Area Network (SD-WAN) is a network architecture that provides organizations with a flexible, secure, and cost-effective way to manage their networks. SD-WAN technology abstracts the underlying network and provides an intelligent layer of abstraction, making it possible to manage network traffic and dynamically control the flow of data. SD-WAN technology is an attractive option for organizations looking to improve the performance and security of their networks.
Kubernetes Architecture Part 3: Data Plane Components
This Kubernetes Architecture series covers the main components used in Kubernetes and provides an introduction to Kubernetes architecture. After reading these blogs, you’ll have a much deeper understanding of the main reasons for choosing Kubernetes as well as the main components that are involved when you start running applications on Kubernetes.
PromQL Cheat Sheet: A Quick Guide to Prometheus Query Language
Prometheus is an open-source monitoring and alerting toolkit that has gained significant popularity in DevOps and systems monitoring. At the core of Prometheus lies PromQL (Prometheus Query Language), a powerful and flexible query language used to extract valuable insights from the collected metrics. In this guide, we will explore the basics of PromQL and provide query examples for an example use case.
Engineers Read Reviews of Their Products Vol. 1
What is TTFB? | Time to first Byte Explained
GrafanaCON 2023 Day 1 Recap: Grafana 10 release, Grafana Loki updates, IoT monitoring, and more
From IoT monitoring to green IT, the first full day of GrafanaCON 2023 covered a lot of ground. It all kicked off with the keynote address, where Torkel Ödegaard, Grafana Labs CGO and co-founder — and the creator of Grafana — officially unveiled our latest major release, Grafana 10, alongside Director of Engineering Mihaela Maior.
High Cardinality in Cloud Native Environments
Everything you want to know about high cardinality in cloud native environments and how to manage it effectively.
What is Grafana Scenes? - with Torkel Ödegaard, creator of Grafana (Grafana Office Hours #02)
How to instrument an uninstrumented block of code with custom instrumentation in APM Insight
We can now notify you through PagerDuty
When we detect a problem with your site, we can notify you via mail, a Slack message, a webhook, or any of our other notifications channels. This is enough for most of our users, but those who work in larger teams often need more flexibility. Today, we are launching our PagerDuty integration. PagerDuty is a cloud-based incident management platform that helps organizations improve operational reliability by providing real-time alerts, on-call scheduling, and incident tracking.
Prometheus vs Thanos
Everything you want to know about Prometheus and Thanos, their differences, and how they can work together.
Introduction to Sysdig Monitor
What is MTTR? Calculation and Reduction Strategies
In the fast-paced world of software development, every minute counts. When disruptions occur, whether there are minor or major system failures, organizations need to bounce back to maintain seamless operations. That's where MTTR (Mean Time to Repair) steps onto the stage as a game-changing metric. Are you ready to unlock the secrets behind reducing downtime, boosting performance, and ensuring software reliability?
Optimize Industrial IoT Data with InfluxDB and AWS
The modern factory’s relationship with data is experiencing a major change. Data now shapes the future rather than only telling the story of the past. The language inside the factory sounds like higher Overall Equipment Effectiveness (OEE) as the result of a shift from preventive to predictive maintenance. It could also look like expanding business goals to a new market based on impactful data-driven decisions. A change in purpose requires an update in technology.
On-call management on the go: Introducing the Grafana OnCall mobile app
We’ve all been there: Sleeping peacefully in bed over the weekend, finally getting rest after a long week at your computer making AI-generated memes writing code. Then at 3 a.m., your phone makes an ungodly sound, and you wake up startled, frazzled, and confused. When you finally type in your passcode to unlock your phone (because facial recognition doesn’t register your bleary-eyed, squinty face), you see an alert, and all dreams of sleep are over.
SD-WAN: Monitoring Blind Spots, and What to Do About Them
The adoption of software-defined wide area network (SD-WAN) technologies continues to pick up pace. By employing SD-WAN technologies, organizations have the potential to realize a range of advantages. Teams can achieve better performance while using lower cost, using commercially-available technologies. For example, teams can use public internet services rather than more expensive private WAN technologies, such as MPLS.
How Honeycomb Monitors Kubernetes
While Kubernetes comes with a number of benefits, it’s yet another piece of infrastructure that needs to be managed. Here, I’ll talk about three interesting ways that Honeycomb uses Honeycomb to get insight into our Kubernetes clusters. It’s worth calling out that we at Honeycomb use Amazon EKS to manage the control plane of our cluster, so this document will focus on monitoring Kubernetes as a consumer of a managed service.
Logic App Best Practices, Tips, and Tricks: #30 How to validate if a JSON structure is an Array or a single object
Enable preconfigured alerts with Recommended Monitors for AWS
When you first onboard to a monitoring and security platform, it can be difficult to know where to start. Which services should you monitor? What thresholds should you set? How often should you alert your team, and where’s the best starting point for investigations?
Enable preconfigured alerts with Recommended Monitors for Azure
As a new Datadog customer, your top priority is figuring out how to maximize the platform’s potential and deliver value to your organization quickly and seamlessly. But with a plethora of options and configurations available at your disposal, it can be overwhelming to determine where to begin. With Datadog, you don’t need to be an expert in observability or monitoring to get up and running efficiently.
Optimize your frontend monitoring strategy with Datadog Synthetic Monitoring and RUM
Testing enables you to proactively identify and resolve issues before they break critical functionality in your application, which is essential to ensuring an optimized user experience (UX). However, if you don’t know how users are actually interacting with your application, key user journeys may go untested. This lack of visibility can lead to a proliferation of unoptimized features in your UI, causing users to drop off before completing important actions.
Sending Logs from Amazon Kinesis Data Firehose to Elastic Observability
Setting Up a Data Loop using Cribl Search and Stream Part 2: Configuring Cribl Search
Simplify your Analytics and Monitoring with User Friendly Tools
Introducing the New Batch Reprocess Tool
At BugSplat, we're constantly searching for ways to help our users save time and energy while fixing crashes. We do this by providing them with more tools to quickly identify the underlying defects that cause problems in their apps. In that vein, we're excited to introduce the Batch Reprocess Tool (view technical doc here), a new feature that allows users to quickly select a set of crashes and have them reprocessed in bulk.
Getting Started with Honeycomb Buildevents and GitHub Actions
Manage your incidents with the new ilert integration
Hello, SREs, DevOps engineers, and developers! We have some news! At Checkly, we understand the importance of proactive monitoring and quick incident resolution in maintaining your apps’ reliability and performance. Have you heard of ilert? ilert is the incident response platform made for DevOps teams. It helps organizations efficiently respond to, communicate and resolve incidents in real-time by offering advanced alerting, on-call management, and status pages.
What's new in Grafana 10? (Grafana Office Hours #01)
Coralogix's Cross-Vendor Compatibility To Keep Your Workflow Smooth
Coralogix supports logs, metrics, traces and security data, but some organizations need a multi-vendor strategy to achieve their observability goals, whether it’s developer adoption, or vendor lock-in is preventing them from migrating all of their data. Coralogix offers a set of features that allow customers to bring all of their data into a single flow—across SaaS and hosted solutions.
Our redesigned status pages can now show uptime history
Next to the many checks we can perform, we can also render beautiful status pages to inform your audience about the health of your service. Today, we've deployed a redesign of these status pages. In this iteration, everything is more polished. We picked a new font and colors and added some icons to make the status page a bit more visually interesting. In addition to the cosmetic upgrade, we also added a significant new feature. We can now display 60 days of uptime history for your sites.
13,000+ GitHub stars, new Trace and Logs Query Builder, Correlated Signals & more - SigNal 25
Shareable URLs in Query Builder
Correlation between logs and traces and vice versa
Demo of Trace Query Builder
Demo for Logs Query Builder
Query Builder for Traces and Logs in Alerts Tab
Ability to clone panels in dashboard
Logit.io Launches Platform Release With Latest OpenSearch Features
Public, Private, and Hybrid Cloud: The Future of the Enterprise
What is public, private, and hybrid cloud? How are they the same? How are they different. Here's everything you need to know.
Streaming Observability with Coralogix
Pipelines Full of Context: A GitLab CI/CD Journey
How to Monitor a Heroku App with Graphite, Grafana and StatsD
This article explores the efficient monitoring of Heroku Apps using MetricFire's HostedGraphite plugin and Grafana dashboards. By combining these tools, developers can gain valuable insights into their app's performance and resource utilization. This guide provides step-by-step instructions on setting up MetricFire, integrating StatsD, and creating comprehensive Grafana dashboards for effective monitoring and debugging.
Downsampling to InfluxDB Cloud Dedicated with Java Flight SQL Client
InfluxDB Cloud Dedicated is a hosted and managed InfluxDB Cloud cluster dedicated to a single tenant. The InfluxDB time series platform is designed to handle high write and query loads so you can use and leverage InfluxDB Cloud Dedicated for your specific time series use case. In this tutorial, we walk through the process of reading data from InfluxDB Cloud Dedicated using the Java Flight SQL client.
IT Teams Flying Blind During Microsoft Outage
On June 5th, Microsoft experienced an outage for many of their Microsoft 365 services including: Outlook on the web, Teams, OneDrive for Business and SharePoint Online due to a service update. When Microsoft service availability goes down the scramble is on for IT teams to quickly pinpoint the issue to mitigate productivity roadblocks for their users and this outage was no different.
Broadcom Recognized as Outperformer in the 2023 GigaOm Radar Report for Cloud Observability
We are excited to share that the AIOps and Observability solution from Broadcom has earned a leader position for platform play and maturity in the GigaOm Radar Report for Cloud Observability, 2023. This report reviewed solutions from 20 vendors on 13 criteria, including across such areas as innovation, understanding of emerging trends, solution capabilities and features, and deployment models.
Embracing the Opportunities of a Network-Connected World
The answer to this question can be very complex, like today's networks. Many enterprise leaders think that this is a subject that should be left to the care of technology geniuses. However, the reality is that this should matter to everyone given the impact the network has on businesses today. The Internet is the new enterprise network. This is due to the fact that user experiences now rely more on ISP and cloud networks than they do on those that reside within the four walls of the data center.
How FireHydrant Implemented Honeycomb to Streamline Their Migration to Kubernetes
Kubernetes is the gold standard for container orchestration at scale. While massive global companies like Google, Spotify, and Pinterest rely on Kubernetes to run their software in production, so do many small but mighty developer teams. (Full disclosure: Honeycomb joined the Kubernetes brigade last year, when we migrated some of our services.)
TT 07 | How OneNeck IT Solutions Transforms Their IT Operations With OpsRamp
RCA Series: What is Root Cause Analysis? (1/4)
Rename Fields in BindPlane OP
What is OpenTelemetry
Learn what is OpenTelemetry: The open-source observability framework for collecting and processing telemetry data from applications and systems.
What's new in Avantra 23.2
It’s my pleasure to announce that the newest version of Avantra, 23.2, is now available for download through our customer hub. In this release we’ve focussed on bringing performance enhancements and usability improvements as well as enhancing our platform extensibility experience and bringing new automation templates to remove some of the mundane tasks that we know SAP operations teams get stuck doing rather than spending time on the more important stuff.
My Perspective on CloudFabrix Collaboration with the Cisco Full-Stack Observability Platform
Benefits of Monitoring for Cloud Security
Popular CSS preprocessors with examples: Sass, Less, Stylus and more
Retain logs longer without breaking the bank: Introducing Grafana Cloud Logs Export
Late last year we announced an early access program for Grafana Cloud Logs Export, a feature that allows users to easily export logs from Grafana Cloud to their own cloud-based object storage for long-term archival purposes. We are pleased to announce that the feature is now in public preview for all Grafana Cloud users, including those on the Free tier!
Grafana Agent v0.34 release: Extended Kubernetes monitoring, support for HashiCorp Vault, and more
Grafana Agent v0.34 is now available! The v0.34 release includes features for remote secrets, better Kubernetes integration, and above all, more community involvement. The Grafana Agent team is also excited to continue driving growth around Grafana Agent Flow, a configuration mode that makes Grafana Agent easier and more powerful to run.
Observability in Nutanix AHV environments and Hyper Converged Infrastructures (HCI)
Today, I’ll cover the benefits of monitoring and observability in Nutanix AHV environments and Hyper Converged Infrastructures (HCI) and how observability can help IT teams run cost-efficient, performant Nutanix deployments. Modern enterprises need infrastructures designed for resilience, cost-effectiveness, and application performance. Organizations are adopting hybrid multi-cloud strategies and looking to simplify and optimize on-premises and data center operations.
May 2023: Monitor Your Domain Expiration Feature
Remember when we promised you some exciting news in the UptimeRobot Discord server blog? The day has finally arrived! We’re happy to introduce our latest feature – domain expiration monitoring! Expired domains can make your website totally inaccessible and cause damage to your brand and business. Fixing expired domains can take days, and at the worst case you could lose the domain name entirely because someone may register it quicker.
Alert Tuning Recommendations: Reinventing Anomaly Alerts with Anodot
In the complex and dynamic realm of data analytics, real-time anomalies serve as insights to issues a business faces. A pervasive and enduring conundrum persists: accurately discerning between anomalies of significant importance and those of lesser consequence. This distinction is a nontrivial task as not all anomalies bear the same weight.
Multi-Cloud Made Simple: Announcing Kentik Observability Enhancements for AWS and Google Cloud
Limited visibility into network performance across multi-clouds frustrates even the best teams. That’s why we’re thrilled to announce enhanced AWS and GCP support for Kentik Cloud, enabling network, cloud, and infrastructure teams to rapidly troubleshoot and understand multi-cloud traffic.
Page Speed Monitoring Will Elevate Your Website's Performance
In the world of constant connectivity and digital realm, velocity is vital. Imagine a user reaching your website only to be met with a stark, blank page. Their anticipation hangs in the balance as they await any sign of engagement. Such an encounter does little to endorse the readiness or accessibility of your business. In today’s hyper-connected world, every single millisecond carries profound significance.
Throw custom exceptions in Logic Apps: Using an API Management (Part V)
What is Apdex Score? Why is it Important?
In today's fast-paced and rapidly-evolving business landscape, it's more important than ever to keep track of how well your software applications are performing. That's where the Apdex score comes in. As a metric for measuring the user experience of an application, the Apdex score provides valuable insights into how your software is performing and how it can be improved.
Best Practices for using Amazon Distro for OpenTelemetry | Last9 Community Talks
Top 10 error monitoring companies in 2023
Delve into the features and benefits of Honeybadger alongside other error monitoring tools, as we compare their strengths and weaknesses. Find the perfect fit for your needs and elevate your error monitoring game.
Multi-Cloud - Rise of Hybrid Networks and the Need to Monitor & Secure Them
This model has benefits, but at the same time, it introduces complexity for the IT teams tasked with monitoring and securing IT systems. Existing network monitoring technologies that system admins use with on-premise infrastructure are typically not expandable to include infrastructure and services running on public cloud platforms. This is a problem as you cannot manage and secure what you cannot see.
Kubernetes Monitoring - Why It Matters
Case Study: Building an Operations Dashboard
Picture a simple E-commerce platform with the following components, each generating logs and metrics. Imagine now the on-call Engineer responsible for this platform, feet up on a Sunday morning watching The Lord of The Rings with a coffee, when suddenly the on-call phone starts to ring! Oh no! It’s a customer phoning, and they report that sometimes, maybe a tenth of the time, the web front end is returning a generic error as they try to complete a workflow.
Breaking down data silos
Cloud Visibility: Kentik Cloud Enhancements for AWS
Cloud Visibility: Announcing Kentik Map for Google Cloud
Receiving MySQL database Alerts
Imagine your popular website or app suddenly slowing down significantly or even stopping altogether. You scramble to find the root cause while losing customers and income every minute. This stressful situation is all too familiar, but you can avoid it. Proactively monitoring MySQL databases can help prevent these issues and keep your performance at its best.
OnlineOrNot updates from May
Webinar Recap: How to Get More Out of Your Log Data
Data explosion is prevalent and impossible to ignore in today’s business landscape, with organizations face a pressing challenge: the ever-increasing volume of log data. As applications, systems, and services generate a torrent of log entries, it becomes crucial to find a way to navigate this sea of information and extract meaningful value from it. How can you turn the overwhelming volume of log data into actionable insights that drive business growth and operational excellence?
Dashboard Fridays: Sample AWS dashboards
Automation in ITOps: An overview
IT networks are the foundation of businesses today. Robust networks enable organizations to conduct seamless business operations and deliver services continuously to customers. To maintain healthy, robust networks, companies depend on ITOps. ITOps refers to the provisioning, monitoring, and management of IT networks to ensure maximum uptime and a better end-user experience.
The 29 best DevOps tools for 2023 and beyond
The integration of Development and Operations is a powerful innovation in how we build software. If you're new to DevOps practices, or looking to improve your current processes, it can be tough to know which tool is best for your team. We've put together this list to help you make an informed decision on which tools should be part of your stack. Read on to discover the 29 best DevOps tools, from automated build tools to application performance monitoring platforms.
API update: User invitations
Easily monitor Docker Desktop containers with Grafana Cloud
18 million — that’s the number of developers around the world who use Docker, the popular tool for containerization. Docker Desktop, a software application for Mac, Windows, and Linux, is one of the most widely used tools within the Docker ecosystem, especially among developers who want to build, test, and deploy applications in containers on their local machines.
Continuous profiling now in public preview in Grafana Cloud
When we announced that Pyroscope was joining Grafana Labs back in March, we expressed our excitement that uniting the Pyroscope and Phlare open source projects and teams would accelerate our plan to add continuous profiling to Grafana Cloud. Just two and a half months later, that day has come! We are proud to announce that Grafana Cloud Profiles is now available in public preview for all Grafana Cloud users, both paid and free.
IPL: How to use ipl-validator
In my last blogpost I explained how our ipl-html lib works and how to use it. With the help of ipl-html it is possible to add forms. Usually we want to validate the data of the form before submitting it and display messages if the validation fails. For this purpose, we have introduced the ipl-validator. The ipl-validator includes many useful validators, and today I want to explain how you can easily use them.
Install Graphite: Common Issues
Graphite is a very popular enterprise monitoring tool. This article will address the common issues that occur while setting up a Graphite instance, and how they can be avoided. We will assume readers have already become acquainted with Graphite, but if you’re interested to learn about the basics of Graphite, check out our articles on the Architecture and Concepts of Graphite and the Installation and Setup before reading this article.
Open Source Monitoring vs Proprietary Software
It’s easy to get pulled into paying more and more at a major monitoring company, despite not getting the functionality that you’re looking for. Leaving your monitoring provider can be difficult because it means replacing expensive software or hardware, re-educating your team, and transferring huge amounts of data to a new system - data that may or may not be well suited to the new system. Despite these issues, there are many reasons that motivate users to move to open source.
Tracealyzer 4.8 Is Out
Tracealyzer version 4.8 has just been released, with major optimizations and improvements for Zephyr RTOS, and support for 64-bit target processors (FreeRTOS, Zephyr and SafeRTOS only). In addition, the ESP32 support is upgraded to use the latest TraceRecorder library, supporting all recent versions of ESP-IDF up to v5.2 dev. Snapshot tracing is now primarily supported by the implementation for streaming mode, using the RingBuffer stream port.
Shrink your IT budgets, not your observability needs
Are you getting value for every dollar spent on IT monitoring tools? Amidst the prevailing global economic turbulence, budgets are shrinking, and every dollar spent counts. However, Gartner forecasts a 5.1% growth in worldwide IT spending for 2023. Enterprises implement digital technologies to cope with layoffs and keep their systems up. The million-dollar question is: Is the monitoring output worth the cost of the monitoring solution?
Simplifying Everyday Network Management: How AI is Changing the Game
Artificial Intelligence (AI) is the current buzz word in IT with AI promoted as the magic ingredient for improving business performance across a wide range of areas. But how, specifically, does AI enhance Network Management? The idea that computers can manage themselves is nothing new.
How can companies improve their employees' digital experience?
Watch the live Q&A with Mark Towler, Director of Product Marketing, or read the video transcript below.
The Rhythm (Of Your Data Center) Is Gonna Get You
Every data center has a rhythm. When you think about a single application—SAP, for example—it has certain “beats.” First thing Monday morning, you see a steady and fast cadence, while over the weekend, it slows to a light tap. And there may be seasonality that rises to a crescendo.
Error Resolution Unveiled
In today's fast-paced tech environment, swiftly and efficiently resolving software errors is essential to maintain the seamless operation of your application. A prominent problem for engineering leaders is they often need help tracking and effectively understanding their error resolution performance over time. With a comprehensive, real-time visualization of this data, making informed decisions, setting performance benchmarks, and optimizing resources become easier.
Querying InfluxDB Cloud with the Go Flight SQL Client
InfluxDB Cloud 3.0 is a versatile time series database built on top of the Apache ecosystem. You can query InfluxDB Cloud with the Apache Arrow Flight SQL interface, which provides SQL support for working with time series data. In this tutorial, we will walk through the process of querying InfluxDB Cloud with Flight SQL, using Go. The Go Flight SQL Client is part of Apache Arrow Flight, a framework for building high-performance data services.
Collecting Kubernetes Data Using OpenTelemetry
Running a Kubernetes cluster isn’t easy. With all the benefits come complexities and unknowns. In order to truly understand your Kubernetes cluster and all the resources running inside, you need access to the treasure trove of telemetry that Kubernetes provides. With the right tools, you can get access to all the events, logs, and metrics of all the nodes, pods, containers, etc. running in your cluster. So which tool should you choose?
What are Spans in Distributed Tracing?
In modern software development, distributed systems have become increasingly common. As systems grow more complex and distributed, it can be challenging to understand how requests or messages move through the system and where bottlenecks may occur. This is where distributed tracing comes in. Distributed tracing is a technique that allows developers and operators to monitor and understand the behavior of complex systems.
Understand your Kubernetes and ECS spend with Datadog Cloud Cost Management
Rising container usage has fueled a growing reliance on container orchestration systems such as Kubernetes, EKS, and ECS. As organizations increasingly opt to run these systems in the cloud, their cloud spend tends not only to grow but also to become more opaque due to the dynamic complexity of these environments. Typically, various services, teams, and products share cluster resources, and as nodes are added and removed, those resources continuously shift.
React quickly to cost overruns with Cost Monitors for Datadog Cloud Cost Management
The dynamic nature of cloud costs can make it difficult to fully understand your cloud spend and embrace cost ownership at all levels of your organization. To establish cost governance, FinOps teams need a complete view of cloud costs, including allocation by team, service, and product. And DevOps teams need to detect, investigate, and quickly mitigate unexpected costs to minimize overruns, even as they continue to build features and operate their services.
INTEGRATE 2023 - Day 3 Recap
Group Metrics Like a Pro with Netdata!
Errors Playground Live streaming Announcement
Connecting Multiple Vendors with Custom Actions in Coralogix
How to Manage High Cardinality Metrics in Prometheus
A comprehensive guide on understanding high cardinality Prometheus metrics, proven ways to find high cardinality metrics and manage them.
Discover Pandora FMS best features 2022-2023 (Part I)
Client Library Support for InfluxDB 3.0
Page Speed Check
Check out our 14-day free trial, no credit card required: https://uptime.com/accounts/register
#monitoring, #saas, #downtime, #uptime, #nomore404, #outage, #enterprisesbusiness
Microsoft Outlook on the web Outage, June 6th, MO572252
Yesterday’s Microsoft 365 Suite-wide outages, led to continual faults for Outlook on the web on Tuesday, June 6th. When the outages pile up, it becomes difficult to tell when one starts and the other ends. The latest: Can’t access Outlook on the web and other Microsoft services and features The prior day incidents began with EX571516: Some users are unable to access Outlook on the web, and may experience issues with other Exchange Online services.
Cron Monitoring Now Supports Sentry SDKs, Multi-Environments, Timezones and More
Last year we introduced Sentry Cron Monitoring (beta) to help developers get code-level context and performance trends for their scheduled jobs. While Crons remains in beta, we’ve heard your feedback over the past few months and want to share some big improvements we’ve shipped. In this post, we’ll cover how we’ve simplified the setup process by integrating Crons into our SDKs and automating monitor setup for select frameworks.
Setting Up a Data Loop using Cribl Search and Stream Part 1: Setting up the Data Lake Destination
Setting Up a Data Loop using Cribl Search and Stream Part 2: Configuring Cribl Search
Setting Up a Data Loop using Cribl Search and Stream Part 3: Send Data from Cribl Search to Stream
Setting Up a Data Loop using Cribl Search and Stream Part 4: Putting it All Together
The SNMP Monitoring Ultimate Guide: Components, Versions & Best Tools To Use Today
INTEGRATE 2023 - Day 2 Recap
What is Shadow IT and How Does SaaS Monitoring Help?
How to Secure Your CI/CD Pipeline: Best Tips and Practices
CI/CD pipelines have become a cornerstone of agile development, streamlining the software development life cycle. They allow for frequent code integration, fast testing and deployment. Having these processes automated help development teams reduce manual errors, ensure faster time-to-market, and deliver enhancements to end-users. However, they also pose risks that could compromise stability of their development ecosystem.
A Brief History of the Internet's Biggest BGP Incidents
Stretching back to the AS7007 leak of 1997, this comprehensive blog post covers the most notable and significant BGP incidents in the history of the internet, from traffic-disrupting BGP leaks to crypto-stealing BGP hijacks.
Apply real-time updates to Datadog components with Remote Configuration
Datadog provides you with a comprehensive and highly customizable platform for monitoring the performance and security of your applications. Through Datadog components deployed in your environment—including the Agent, tracing libraries, and Observability Pipelines workers—you can easily configure monitoring across your hosts and services, regardless of the particular technology you’re using.
Unlocking end-to-end observability: Cisco's game-changing solution
Integrating network intelligence and application observability, our latest Customer Digital Experience Monitoring enhancement enables end-to-end visibility and eliminates silos.
Kubernetes Architecture Part 2: Control Plane Components
This Kubernetes Architecture series covers the main components used in Kubernetes and provides an introduction to Kubernetes architecture. After reading these blogs, you’ll have a much deeper understanding of the main reasons for choosing Kubernetes as well as the main components that are involved when you start running applications on Kubernetes. This blog series covers the following topics.
Tire Profiles thanks Site24x7 for its incredible support in monitoring its hybrid cloud deployments
Why You Should Care About Microsoft Teams Monitoring
With the rapid growth of hybrid work, the need for collaboration tools that centralize audio, video, chat and documents have never been more critical. Most departments in your organization use Microsoft Teams to conduct business; VIPs conducting executive meetings in your Teams Meeting Rooms, Sales organizing calls and meetings with their prospects, Customer support teams contacting your customers and scheduling potential meetings to help them, and R&D organizing their meetings.
unlock the power of data correlation for comprehensive system performance insights 5 youtube video 1
Sematext Update Review Episode 2 | New Product Features
Ship with confidence - monitoring as code explained in three minutes.
How to Test Network Performance: Tips, Tricks & Techniques
Security insights for Cloud Native Application Observability
Coming soon – new cloud native and data security capabilities to keep business-critical applications protected with the power of Cisco Security integrations.
Prometheus Operator Guide
What is Prometheus Operator, how it can be used to deploy Prometheus Stack in Kubernetes environment.
Microsoft 365 Outage on June 5th, EX571516, MO571683
On Monday morning, June 5th there was a wide scale outage for Microsoft 365. Interestingly, for this one, they first reported it with a barrage of duplicate health status emails (why, we have no idea) but the issue was much more widespread than that – it was affecting most Microsoft Office 365 services: The first incident was Incident EX571516: Some users are unable to access Outlook on the web, and may experience issues with other Exchange Online services.
3 themes from Sapphire 2023
SAPPHIRE 2023 marked another significant milestone, leaving a lasting impression in the books. Returning to the Orlando Convention Center, the event had that ‘SAP energy’ we’re used to as thousands of like minded individuals congregated to exchange experiences, delve into SAP's upcoming plans, and foster valuable connections. Going beyond the walls of the convention center, SAPPHIRE extended its reach into the surrounding areas of Orlando.
Sapphire 2023 - the key 3 imperatives for business leaders
With the 34°C / 104°F heat and a far cry from the 18°C / 64°F I returned home to, it was time to reflect on SAP Sapphire Orlando 2023, the trade show that was the first, in my opinion, post pandemic Sapphire since 2019. Over 13 thousand business leaders, partners and SAP staff descended on the Orange County Convention center in Orlando, Florida to discuss and debate all things SAP. So what were the key takeaways from my side?
Complete Guide to tracing Kafka clients with OpenTelemetry in Go
Redis Monitoring | 101 Guide to Redis Metrics Monitoring
Automate end-to-end processes and quickly respond to events with Datadog Workflow Automation
Developer, SRE, IT, and security teams often perform complex and error-prone processes in response to disruptions and changes in their systems. Relying on these processes requires a significant amount of time switching between tools to gather the relevant context needed for remediation, domain expertise, and the manual execution of tasks for incident management—which can significantly prolong disruptions and downtime.
Software Maintenance Best Practices for 2023
Businesses rely on software solutions increasingly in our modern age, and it’s constantly evolving. Compared to some of the software being used in the early 2000s, we’ve seen large changes, resulting in more complex frameworks, which come with their own unique changes. As software and systems become more complex, so increases the probability of errors occurring and the level of jeopardy those errors might present.
Observability: Working with Metrics, Logs and Traces
The concept of observability centers around collecting data from all parts of the system to provide a unified view of the software at large. Fault tolerance, no single point of failure and redundancy are prominent design principles in modern software systems. But that doesn’t mean errors, degradation, bugs or even the occasional catastrophe don’t happen.
Customer-Centric Observability: Experiences, Not Just Metrics
Martin and Jess recently conversed with Todd Gardner of RequestMetrics as part of the O11ycast podcast. We don’t normally write blogs based on these conversations, but there were impactful comments in that episode that bear repeating. You can listen to the full conversation if you wish. Let’s get into it!
Office 365 Monitoring: The Challenges, and What to Do About Them
Office 365 is used by more than one million companies around the world. Business employees count on these apps constantly to do their jobs, whether they’re writing documents, updating spreadsheets, building slides, or checking email. While cloud-based apps like Office 365 offer undeniable advantages for enterprises and business users, they also create tough challenges for IT operations and network operations (NetOps) teams.
6 Key Factors to Consider When Choosing a Website Platform
Choosing the right website platform is an important decision for anyone looking to establish a solid online presence. In fact, choosing the wrong website platform has exposed brands to issues like security breaches, poor mobile responsiveness, and terrible load speeds. To buttress the last point, Google research showed that 32% of users would leave your website if it experiences poor load speed. In other words, they want a good user experience.
What is NetFlow Analyzer?
INTEGRATE 2023 - Day 1 Recap
Monitoring AWS End User Computing (EUC) Technologies with eG Enterprise
We are delighted to share that eG Innovations has become one of a very small number of partners to have achieved AWS’s “Digital Workplace Competency” award following a lengthy and rigorous technical audit process. This designation differentiates eG Innovations from other AWS EUC monitoring vendors as having a solution that meets AWS’s own standards for enterprise software.
Introducing powerful APIs and webhooks for Grafana Incident
Grafana Incident, Grafana’s powerful incident response tool, comes with a range of integrations out of the box, including Zoom and Google Meet spaces, GitHub and JIRA issues, and even a Google Doc template for post-incident review documents. However, every team has unique needs and workflows, and you may need to integrate with other systems not currently on our roadmap or even use your own in-house tools.
Coralogix Deep Dive - Metrics in Coralogix
Step Functions in the Real World
Top 11 MYSQL monitoring tools in 2023 [open-source included]
Our broken links check has been improved
One of our unique monitoring features is that we crawl your entire site to discover links that might be broken. When we discover a broken link, we'll send you a notification and display every broken link in our Broken Links Report. We've made a nice quality-of-life improvement to that Broken Links Report. In addition to displaying the broken link URL and the page on which that broken link was found, we now also display the link text of that broken link.
Prometheus and Grafana
What is Prometheus and Grafana, What is Prometheus and Grafana used for, What is difference between Prometheus and Grafana.
Cloud Provider Uptime Monitoring: May 2023 Insights
Explore our insightful May 2023 report on the uptime of top cloud providers. We've carefully assessed the health of these leading services by monitoring outages and issues throughout the month. Using data from their official status pages, we've normalized the information to create a clear and concise overview of their reliability. Find out how your favorite cloud provider stacks up in this essential report.
5 Tips to Improve Employee Digital Experiences
Companies' reliance on technology grows daily. However, with Information Technology (IT), infrastructure complexities on the rise, overall system performance fluctuates. Any network, app, or service delay hinders individual and corporate performance. Identifying the source of these digital pain points resembles searching for a needle in a haystack. What follows are a handful of tips, so you sift through the hay faster, reduce outages, and improve employee digital experiences.
Leveraging SCOM-AI GPT for Enhanced Citrix Monitoring at SCOMathon 2023
As a proud sponsor of SCOMathon 2023, GripMatix had the opportunity to showcase the application of SCOM-AI GPT, which integrates your SCOM alerts with ChatGPT, with our existing SCOM Management Packs for monitoring Citrix. The session titled 'Going Beyond Citrix Director with MetrixInsight, SCOM, and SCOM-AI GPT' demonstrated the potential of these combined technologies in enhancing Citrix monitoring beyond the capabilities of Citrix Director.
Streamline your CI testing with Datadog Intelligent Test Runner
Modern continuous integration (CI) practices enable development teams to quickly and efficiently build and deploy application code to a shared codebase. However, deploying new code is typically accompanied by tests, and as the codebase expands, this results in a proportionately larger test suite.
Intro to InfluxDB 3.0
Ask Me Anything: WhatsUp Gold Performance Monitors Webinar
A Step-by-Step Guide to Standardizing Telemetry with the BindPlane Observability Pipeline
Track changes to Datadog dashboards and notebooks with version history
Datadog dashboards and notebooks can be powerful tools for troubleshooting, enabling you to analyze telemetry from across your stack with visualizations customized by service owners, data analysts, and engineers. Many organizations also rely on dashboards and notebooks for key business processes, such as generating reports, creating postmortems, and managing SLOs. This makes it important to keep track of any unintended changes that may result from others accessing your content.
Head in the Clouds (ft. Jo Peterson): Experts Dish on Cloud Strategy
Rollouts in BindPlane OP
Vue.JS Live 2023 Workshop: Maximize App Performance by Optimizing Web Fonts by Lazar Nichols
16 Best Network Testing Tools for Optimal Performance
What is CLS and what causes it? | Snack of the Week
Unraveling the Log Data Explosion: New Market Research Shows Trends and Challenges
Log data is the most fundamental information unit in our XOps world. It provides a record of every important event. Modern log analysis tools help centralize these logs across all our systems. Log analytics helps engineers understand system behavior, enabling them to search for and pinpoint problems. These tools offer dashboarding capabilities and high-level metrics for system health. Additionally, they can alert us when problems arise.
Citrix VAD and ADC Monitoring on Microsoft SCOM
Mastering AWS Fargate pricing and optimization with CloudSpend: A comprehensive guide
AWS Fargate is a powerful tool for running containerized workloads on AWS. It’s a serverless compute engine that allows you to run containers and focus on developing and deploying your applications while AWS controls the cloud infrastructure. This can make a real difference for an organization, saving both time and resources that would otherwise go towards managing servers. This guide will discuss AWS Fargate pricing and provide tips for cost optimization.
Cool Things You Can Do with Metrics on AWS
Public cloud environments are heavily instrumented and can give you metrics on practically any level of the infrastructure. AWS is no exception. Metrics are not only useful for monitoring and troubleshooting issues in a cloud environment - they can also be tied directly to automated actions. So you can leverage them to remediate issues instantly, as they happen.
The OSI Model in 7 Layers: How It's Used Today
What Are Management Information Bases (MIBs)?
You have probably seen (or even been to) your company's data center. If not, chances are you have looked at photos of one from a major company like Facebook or Google. Why bring this up? Because when some folks think about the word 'database,' images of rows upon rows of servers holding data come to mind. Others think of the cloud, with zettabytes of data stored in rows, columns and tables.
What Are SDN and NFV, and Are They Related?
SDN and NFV are acronyms you hear frequently in discussions of modern networking. In fact, they appear so commonly that they can be easy to confuse or conflate with one another. But that would be a mistake. SDN and NFV are related terms, but they are also distinct. You can use SDN without using NFV, and the benefits of NFV are not the same as the benefits of SDN in general. Keep reading for a breakdown of what SDN and NFV have to do with each other, and what to use when.
May 2023 Product Launch Recap
On May 31st, Catchpoint hosted a webinar to launch our Perigrine and Eagle releases, packed with new product features and enhancements that make our Internet Performance Monitoring (IPM) Platform even more powerful.
4 Reasons You Should Monitor for BSOD (Blue Screen of Death)
As N-able Head Nerds we are continually looking for ways our partners can better support their end-users. So it’s hugely beneficial for us to visit with our partners when we can to see all the different approaches they take in supporting their customers. On a recent trip to South Africa, Marc-Andre Tanguay visited First Technology KZN in Durban. Whilst there the team showed Marc-Andre the custom BSOD monitor they had built to detect if a machine had suffered the dreaded Blue Screen of Death.
Web performance testing: Compare Grafana k6 browser vs. Google Lighthouse
The Grafana k6 browser module simulates how users interact with a browser page and collects web performance metrics about the interaction. Since launching the module in 2021, we’re frequently asked how it compares to Google Lighthouse as a tool to measure web page performance. This blog post compares k6 browser and Google Lighthouse from various perspectives, including: Note: k6 browser is a part of Grafana k6 OSS.
Performance Ratings and Experience Scores for Meaningful Alerting and Rapid Observability
Administrators and IT management are increasingly leveraging simple quantifiable KPI indicators such as “Performance Ratings” to gain rapid overviews and track key outcomes. Modern IT architectures are designed and built to scale and be resilient. Systems are now usually built to handle failover and auto-scale up and down to handle varying demand and workloads with very different properties and needs.
When Reliability Goes Wrong in Cloud Networks
Cloud network reliability has become a catch-all for four related concerns: availability, resiliency, durability, and security. In this post, we’ll discuss why NetOps plays an integral role in delivering on the promise of reliability.
A Guide on Log File Parsing Tools
While log parsing isn’t very sexy and never gets much credit, it is fundamental to productive and centralized log analysis. Log parsing extracts information in your logs and organizes them into fields. Without well-structured fields in your logs, searching and visualizing your log data is near impossible.
How to install online satellite server
Nexthink Powers Employee Engagement with Exciting New Features
We are thrilled to share the latest updates and enhancements to Employee Engagement! At Nexthink, we continue to invest, innovate, and lead the way in facilitating two-way communication between IT and employees, powering self-help and direct communication for any of IT’s pressing needs. In this blog post, we’ll dive into five exciting new features and improvements that foster better communication, drive effective campaigns and engagement, and enhance employee satisfaction overall.
What Is a Telemetry Pipeline?
In a simple deployment, an application will emit spans, metrics, and logs which will be sent to api.honeycomb.io and show up in charts. This works for small projects and organizations that do not control outbound access from their servers. If your organization has more components, network rules, or requires tail-based sampling, you’ll need to create a telemetry pipeline.
Round-the-clock help with ManageEngine's Site24x7
Correlating Analytics Data with Logging
May Product Update
The month of May has just ended and pretty much everybody agrees that 2023 is absolutely flying by. Here at Sentry, we’re looking to match the speed of 2023 with our own velocity of new product releases. Here they are in a nutshell.
Network Performance Testing: The Path to Peak Performance
Founder & Friends: Server-side monitoring with Dr Panos Patros
Achieve operational resilience with a flexible data store
Are you prepared for the unexpected? In today's rapidly evolving world, operational resilience has never been more critical for businesses to survive and thrive. Resiliency is the ability of a system to maintain its operations under adverse conditions, including system failures, unexpected surges in user demand, or even security breaches. The heart of many applications, particularly in this era of data-driven decision-making, is the data store or database.


