

|
By Percepio
Guest blog by Florent Goutailler, Associate Professor, Télécom Saint-Etienne, France Teaching real-time embedded systems has always involved a fundamental challenge: the most critical behaviors – task scheduling, timing, and concurrency – are largely invisible at runtime. When students begin working with a real-time operating system such as FreeRTOS, they are introduced to concepts like scheduling, task prioritization, semaphores, and inter-task communication.

|
By Percepio
Percepio TraceExporter for VS Code makes it easy to export Percepio TraceRecorder snapshots during your debug session and open them directly in Percepio Tracealyzer. This is applicable for embedded systems based on Zephyr, FreeRTOS, SafeRTOS, Cesium, ThreadX or PX5, or using TraceRecorder’s “Bare Metal” option. The extension is currently provided in a Beta version as a downloadable.vsix file.

|
By Percepio
We are delighted to release Percepio Tracealyzer version 4.11. The main news are: Users with an active subscription may download the new version from the update page. New users may sign up for free evaluation here.

|
By Percepio
Think of Percepio Detect as a security camera for your firmware—always monitoring, but only storing data when something unusual happens, such as crashes or performance anomalies. By providing rich debugging information when needed while keeping the overall data volume to a minimum, Detect enables continuous observability over unlimited time, even on resource-constrained devices such as 32-bit microcontrollers.

|
By Percepio
Debugging embedded software has never been easy, but today’s systems are more complex and interconnected than ever. Real-time operating systems (RTOS) and continuous integration pipelines can make development faster—but certain classes of bugs are hard to reproduce and diagnose. These elusive issues often appear only under rare conditions, such as timing-sensitive race conditions or field-only failures. This is where Continuous Observability, powered by Percepio Detect, changes the game.
|
By Percepio
Using IAR Embedded Workbench for Arm with an IAR I-jet probe? Did you know this provides an excellent data channel for Tracealyzer trace streaming? We have just updated Percepio Application Note PA-023 with a simpler setup for trace streaming over ITM/SWO, enabled by improvements in IAR’s ITM logging support. This makes it easier than ever to combine IAR’s powerful debugging with Tracealyzer’s RTOS-level insight. Read the updated guide here.

|
By Johan Kraft (PhD)
Ask any embedded developer about their worst debugging experience, and chances are you’ll hear stories of unreproducible bugs, late-night watchdog resets, or CI test failures with no trace. Traditional tools often leave us blind at the exact moment we need insight.

|
By Percepio
We’re happy to announce that our Trace Export Plugin for MPLAB X IDE has been updated to version 2.3.1 and now supports the latest versions of Microchip’s IDE, including MPLAB X v6.20 and v6.25. This plugin enables saving trace files from Percepio’s TraceRecorder library via the MPLAB X IDE debugger, making it easy to open the trace in Percepio Tracealyzer and related tools.

|
By Percepio
When using Percepio TraceRecorder, kernel objects like queues, semaphores and mutexes are named using their address by default. This can be a bit hard to follow for complex traces. However, it is quite easy to set more descriptive custom names for your RTOS kernel objects. This by calling the “SetName” functions (or macros) found in the TraceRecorder API, for example: The first argument is the pointer to the object (i.e. the object address).

|
By Percepio
About 15 years ago, I worked at a company building network security appliances (with ARM-based network processors) and was responsible for the development of custom Linux firmware. The product launch was successful; we shipped and managed a large fleet of devices in the field. After a few firmware releases, we received alerts from the device management system telling us that there were intermittent problems. Remoted into the appliances but could not reproduce the error.
|
By Percepio
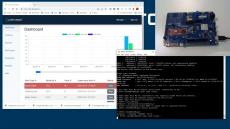
With Percepio DevAlert, IoT device developers gets instant feedback and deep diagnostics on software anomalies in deployed device fleets, e.g., on random faults or suspicious behavior.

|
By Percepio
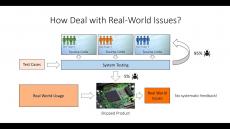
What if IoT device developers could be notified about real-world issues in IoT devices automatically and get detailed diagnostics on the very first occurrence? This is provided by Percepio DevAlert, a novel cloud service that gives real-world feedback about issues in the device software, that allows for rapid continuous improvement and for embracing DevOps in IoT device development. Learn from real-world usage and make a great product that beats the competition.
|
By Percepio
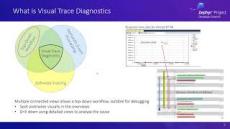
Tracealyzer is the premier solution for visual trace diagnostics, giving embedded software developers amazing insight into the runtime world. This allows for easier debugging of system-level issues, and for improving the software design and performance. Ensure your code is reliable, efficient and responsive. If not, learn why.

|
By Percepio
A rehearsal recording by Johan Kraft for his talk at the Zephyr Developer Summit 2021.

|
By Percepio
A short demonstration of Percepio Tracealyzer by Dr. Johan Kraft. Tracealyzer is the premier solution for visual trace diagnostics, giving embedded software developers amazing insight into their runtime systems. This allows for easier debugging of system-level issues, finding software design flaws and for measuring software timing and resource usage. Ensure your code is reliable, efficient and responsive. If not, learn why.

|
By Percepio
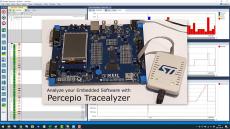
Using an STM32 development board and an STLINK-V3 debug probe, Percepio founder Johan Kraft demonstrates Visual Trace Diagnostics with Percepio Tracealyzer, and IoT Device Monitoring with Percepio DevAlert. #STM32
|
By Percepio
People often have problems with IoT devices due to software issues, and the developers are largely unaware. What if IoT device developers could be notified about real-world issues in IoT devices automatically and get detailed diagnostics on the very first occurrence? This is provided by Percepio DevAlert, a novel cloud service that gives real-world feedback about issues in the device software, that allows for rapid continuous improvement and for embracing DevOps in IoT device development. Learn from real-world usage and make a great product that beats the competition.

- April 2026 (1)
- February 2026 (1)
- December 2025 (1)
- November 2025 (1)
- September 2025 (1)
- August 2025 (1)
- July 2025 (2)
- June 2025 (2)
- May 2025 (1)
- April 2025 (1)
- March 2025 (1)
- November 2024 (2)
- October 2024 (2)
- July 2024 (1)
- June 2024 (1)
- May 2024 (3)
- March 2024 (1)
- January 2024 (2)
- December 2023 (2)
- November 2023 (3)
- October 2023 (1)
- September 2023 (3)
- June 2023 (1)
- May 2023 (1)
- March 2023 (1)
- October 2022 (1)
- August 2022 (1)
- June 2022 (2)
- March 2022 (3)
- February 2022 (2)
- January 2022 (1)
- December 2021 (1)
- November 2021 (1)
- August 2021 (1)
- July 2021 (2)
- June 2021 (1)
- February 2021 (1)
- November 2020 (1)
- October 2020 (2)
- September 2020 (1)
- August 2020 (1)
- June 2020 (3)
- March 2020 (1)
Percepio designs tools that help embedded software developers improve software quality, product performance, development productivity and time-to-market. Tracealyzer is our visual trace diagnostics tool and DevAlert is for deployed IoT device monitoring.
Our Products:
- Percepio Tracealyzer® is the premier solution for visual trace diagnostics, giving embedded software developers amazing insight into the runtime world. This allows for easier debugging of system-level issues, and for improving the software design and performance. Ensure your code is reliable, efficient and responsive. If not, learn why.
- Percepio DevAlert® is a cloud-connected monitoring framework for OEMs developing RTOS device software, providing instant insight on bugs and anomalies. Get a diagnostic feedback loop from remote devices to developer and support teams, with visual trace diagnostics that can reduce debugging time by 80% or more. Enable 100x faster reaction time on anomalies in the field and deploy updates rapidly to safeguard customer deployments at scale.
Percepio tools give an unprecedented level of insight into the run-time world of embedded software.