Operations | Monitoring | ITSM | DevOps | Cloud

Filebeat filestream configs that pass test config but still fail

A Filebeat config can print Config OK and still exit on start, ship your multiline settings as event data, or send a whole log file to your stack twice. We found most of these while testing the Filebeat configs on our integration pages, then rebuilt each mistake, plus the migration traps around them, on Filebeat 8.19.23 and 9.5.5 to see exactly what happens.
AI-assisted log investigation on Logit.io today: Hosted OpenSearch MCP and onboarding AI prompts

On 8 October 2026 Elastic announced the private preview of Elastic nightshift AI SRE, an AI agent built into Elastic Observability that detects and investigates issues and shows its reasoning. It is a sign of where observability tooling is heading: more of the first hour of an incident handled by an assistant that reads your telemetry. Short answer: Logit.io does not offer an autonomous AI SRE agent.

Reading your ingestion history: hourly log counts, the partial hour and 7-day trends

The ingestion card on your Logit.io dashboard has a 24h / 7d toggle for Logs and Metrics, hourly log counts built from counter increases and a dotted line for the hour that is still filling in. Those three changes decide whether a dip on the chart is a real problem or just the clock.

FortiGate, PAN-OS and Zscaler dashboards: get firewall logs into the fields they read

FortiGate, PAN-OS and Zscaler now each have a six-dashboard pack in the Dashboard Library, live on every Logs stack. If your firewall logs already arrive as parsed module fields, the Library pre-selects the matching pack. If they don't, it won't, even when the firewall has been sending syslog for years. This post is about that gap: which parsed fields each pack reads, the Filebeat module settings that produce them, and the API checks that tell you whether the dashboards will fill before you install them.

Dashboard Library: why some dashboards arrive ticked and others don't

Open the Dashboard Library on a Logs stack that already receives Nginx logs and a few cards come up ticked with a green Data detected badge. Others in the same pack sit there unticked. That isn't random. Before it shows you anything, the Library checks what your stack actually holds and pre-selects only the dashboards it expects to fill.

First CloudWatch Logs on Logit.io

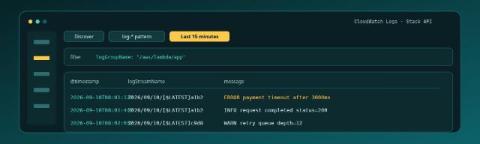
CloudWatch already holds the lines from your Lambda, ECS task, or unified agent. The first useful win on Logit.io is not a migration spreadsheet. It is one Log Group, the documented Lambda shipper posting to this stack's API, and rows in OpenSearch Dashboards Discover that show logGroupName, logStreamName, and message. If you are still proving that a Logs stack can accept anything at all, start with First Logs on Logit.io; this post assumes CloudWatch is the source and the Stack API is the pipe. Contents.

EU data residency for Hosted OpenSearch on Logit.io

EU buyers asking for Hosted OpenSearch with data residency usually mean something precise: indexes and cluster storage should land in a European data centre that lines up with GDPR expectations and the geography named in the DPA — not a US default that security later has to unwind. On Logit.io that choice is an account-level data storage region, not a free toggle on every stack. Get the first stack right and every later OpenSearch or log stack in that account follows.

UK data residency for Hosted OpenSearch on Logit.io

Procurement teams asking for UK-hosted OpenSearch usually mean something concrete: indexes and cluster storage should land in a UK data centre, not wherever a vendor’s default region happens to be. On Logit.io that choice is an account-level data storage region, not a free toggle on every stack. Get the first stack right and every later OpenSearch or log stack in that account follows. Get it wrong after go-live and you are looking at a second account, not a silent migrate button.

From sign-up to first searchable log: the new Logs onboarding

Getting a Logs stack ready means finding your own log in search, not just starting a shipper. Here is the route from sign-up to that first searchable event, with a Filebeat example, checks for common problems and clear labels for dashboard improvements that are rolling out. Contents.

Send .NET Serilog logs to Hosted OpenTelemetry alongside Logstash

Keep your existing Serilog-to-Logstash pipeline while adding an OpenTelemetry copy of the same.NET logs. This tested walkthrough covers OTLP over HTTPS, Basic authentication, service naming and graceful flushing, then shows how to compare both copies in OpenSearch Dashboards and correlate logs with traces before cutting over. Contents Start Free Trial Unlock complete visibility with hosted ELK, Grafana, and Prometheus-backed Observability Start Free Trial.