Squared Up

Maidenhead, UK
2011
Mar 15, 2023   |  By Squared Up
In software observability, we often talk about three signal types - metrics, logs, and distributed traces. More recently I've been hearing about profiles as another signal type. In this article I will explain the different observability signals and when to use them in a clear and concise way.
Feb 27, 2023   |  By Squared Up
Automatic instrumentation is great, but to get the most out of your monitoring you often need to instrument your code. In this article I am going to explain how to instrument a Node.js express app with custom metrics using the Prometheus prom-client package. Although this article specifically addresses Node.js and express, my hope is that the general concepts are applicable to other languages too.
Jan 25, 2023   |  By Squared Up
Observability has become a bit of a buzzword in the industry for the last few years. Exactly what "observability" means depends on who you ask, but most people would agree its about both: There's plenty of content out there telling you how to implement observability, or what good looks like. But what about bad observability? What are some anti-patterns to watch out for?
Jan 10, 2023   |  By Squared Up
A new year has started and I've been pondering my hopes and dreams for the year to come. In the world of SRE, observability is the most prominent pillar of my work. So, I decided to drill into the topic of observability and what I'd like to see happen in the industry in 2023. Rather than focusing on any tool, technology, or methodology, I'lll be exploring concepts that can be broadly applied in any organization.
Jan 6, 2023   |  By Squared Up
We are thrilled to kick start 2023 with an exciting announcement: Slight Reliability is now a part of SquaredUp! Keep reading to learn how this partnership began, in an exclusive interview snippet with our CEO Richard Benwell and Slight Reliability host Stephen Townshend.
Dec 20, 2022   |  By Squared Up
In November/December 2022 I attended AWS re:Invent in Las Vegas. It was certainly an experience for this small town kid from New Zealand, and one that I took a lot away from. While I was at the conference, I took the time to walk around and take notes. In this article I will share the trends that I observed which I think will have an impact on SRE work in 2023 and beyond, including: ...and others.
Dec 19, 2022   |  By Squared Up
Repetitive tasks can be time consuming. In an ideal world, automation would remove all of the grunt work when it comes to solving business problems, freeing us up to execute on more strategic decisions. Luckily, Jira has the capabilities to take a load of tasks off your hands – including tracking your issues, posts, features, and more. This blog will walk you through the options available and offer top tips on how to set this up.
Dec 6, 2022   |  By Squared Up
As you may have heard, Microsoft has just released the highly anticipated SCOM Managed Instance (SCOM MI) – cloud-hosted SCOM. In conjunction with this, we have launched a plugin for SquaredUp that lets you connect straight into SCOM MI and pull all the monitoring data you need!
Nov 30, 2022   |  By Squared Up
You’re part of a data-driven engineering team. You have a rich, complex, and dynamic set of tools but you’re struggling to discover and share insights from all that data. So, you're looking for a platform that will help unify it all. Naturally, you want to compare Grafana vs. Power BI - the big names. Plus, there's a new player on the block - SquaredUp.
Oct 5, 2022   |  By Squared Up
Today we're announcing the launch of SquaredUp Cloud – a new kind of business intelligence (BI) tool – designed to help product, engineering, and IT teams easily discover and share insights from their data. Read on to find out more, or sign up for our webinar.
Feb 10, 2023   |  By Squared Up
Introducing SCOM Dashboard Server v5.8! Watch the webinar to see some of the most exciting updates, including: New Slack tile visualisation Major improvements to the Monitor tile Conditional colors on bar graph, sparklines and line graphs EAM-X plugin improvements And much more!
Feb 7, 2023   |  By Squared Up
A brief introduction to the challenge of observability data being spread across the organisation, and how SquaredUp's data mesh approach can help to leverage your existing tools to deliver consolidated insight.
Feb 6, 2023   |  By Squared Up
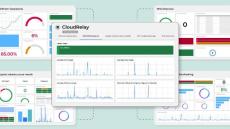
These Jira dashboards give a clear overview of your Jira instance and provide more details on the key items over which the engineering team needs oversight, like build status, critical bugs, and costs. Creating Jira dashboards in SquaredUp means Engineering Management doesn’t have the additional work of collating all the detailed Jira data to make sense of it from a high level. It also enables Release Teams to more easily consume data surfaced from all the engineering teams, while still being able to drill into the details of each dashboard as needed.
Jan 16, 2023   |  By Squared Up
Engineers need to understand the status of microservices run on EKS, like health status of clusters and nodes, to avoid issues impacting business critical microservices. Plus, you need to be able to keep an eye on EKS resources, including whether the Kubernetes cluster has auto-scaled (where enabled). Usually, to view these metrics, it requires looking at each EKS cluster and node group individually in the AWS Console, or via another complex third-party dashboarding tool. The data is siloed and difficult to consolidate.
Jan 13, 2023   |  By Squared Up
These Azure dashboards built in SquaredUp show some of the capabilities of SquaredUp’s Azure plugin. SquaredUp lets you easily create dashboards for your Azure resources, scoping a new tile with just a few clicks. The Azure plugin provides the ability to show metrics, alerts, and cost, as well leverage KQL queries against Application AppInsights and Log Analytics workspaces - all from one plugin. When scoping a tile, you can also choose whether to group, aggregate, sort or filter the data.
Jan 13, 2023   |  By Squared Up
Engineers need to understand the status of microservices run on EKS, like health status of clusters and nodes, to avoid issues impacting business critical microservices. Plus, you need to be able to keep an eye on EKS resources, including whether the Kubernetes cluster has auto-scaled (where enabled). Usually, to view these metrics, it requires looking at each EKS cluster and node group individually in the AWS Console, or via another complex third-party dashboarding tool. The data is siloed and difficult to consolidate.
Dec 22, 2022   |  By Squared Up
This SquaredUp dashboard shows key metrics from any GKE (Google Kubernetes Engine) clusters and node groups, including utilization of resources and health status. Tune in to learn how it was made, the challenges it solves, and our top tips for building it yourself.
Dec 22, 2022   |  By Squared Up
This SquaredUp Grafana dashboard surfaces status information from Grafana, giving you a big picture overview across teams and apps – all while allowing you to utilize your existing dashboards and alert rules. Tune in to learn how it was made, the challenges it solves, and our top tips for building it yourself.
Dec 22, 2022   |  By Squared Up
This Google Compute Engine dashboard shows key metrics about any GCE instances, managed instance groups, and related resources such as GCE disks. These metrics include utilization of resources and health status. Tune in to learn how it was made, the challenges it solves, and our top tips for building it yourself.
Dec 22, 2022   |  By Squared Up
This SquaredUp dashboard uses the Azure plugin to surface key performance metrics from Application Insights. Common user experience metrics are all provided out of the box, and we can query, summarize, and analyse the raw logs and traces. Tune in to learn how it was made, the challenges it solves, and our top tips for building it yourself.
May 20, 2020   |  By Squared Up
As IT admins and application owners tear their hair out over another costly outage that has the boss breathing down their necks, a familiar cry rings out throughout the enterprise IT organisation; "monitoring sucks!!". But why does monitoring suck and what can you do about it?
Jan 27, 2019   |  By Squared Up
Everything you need as you set off on your path to glory.

Founded in 2011 with the vision of using data visualization to solve the challenge of Enterprise IT complexity, Squared Up is used by the world's leading enterprises to deliver application-centric monitoring, reduce downtime and improve service delivery. From super-fast dashboards to automatic application mapping, Squared Up transforms Microsoft System Center Operations Manager (SCOM) into a complete Enterprise Application Monitoring experience.

At its core, Squared Up delivers a fully modernized SCOM user experience, but you'll also discover how you can use SCOM to deliver a complete Enterprise Application Monitoring solution, and even use our integrations to provide a single pane of glass across your entire IT infrastructure.

Enterprise IT complexity meets modern data visualization:

  • Total SCOM dashboards: Squared Up is a complete HTML5 user experience for SCOM, with industry-leading dashboard capabilities - from Visio integration to performance graphing - and comprehensive, dynamic drilldowns generated by our unique Total Dashboard Architecture.
  • Enterprise Application Monitoring: By using data visualization to better understand the data you already have, we leverage your existing investments in SCOM to deliver a complete Enterprise Application Monitoring solution.
  • One view for hybrid cloud monitoring: Squared Up creates an independent presentation layer that aggregates your existing data in SCOM with data from other tools such as Azure Log Analytics. As you start to adopt new platforms your users don't need to learn any new tools, they just get the data they need when they need, all in a single pane of glass.

Transforming IT operations for enterprises worldwide.