Operations | Monitoring | ITSM | DevOps | Cloud

Tracing

The latest News and Information on Distributed Tracing and related technologies.

OpenTelemetry Visualization Setup: A Developer's Guide

If you've ever tried to set up OpenTelemetry visualization, you know it can be a bit overwhelming. But don't worry—in this guide, we'll break it all down step by step. Whether you're just getting started or looking to fine-tune your existing setup, this walkthrough will help you get the most out of your telemetry data.

Integrating OpenTelemetry with Grafana for Better Observability

Modern application observability is essential for ensuring system performance, diagnosing issues, and optimizing user experiences. OpenTelemetry (Otel) and Grafana serve as two key components in achieving end-to-end visibility. While OpenTelemetry focuses on instrumenting applications to collect telemetry data, Grafana specializes in visualizing this data, making it actionable and insightful.

OpenTelemetry UI: The Ultimate Guide for Developers

If you’ve ever struggled with understanding distributed traces, managing metrics, or debugging complex applications, OpenTelemetry is your best friend. But what about the OpenTelemetry UI? How do you visualize and interact with all that telemetry data? In this guide, we’ll explore the best ways to use OpenTelemetry’s UI options, from setting up a proper observability stack to choosing the right front-end visualization tools.

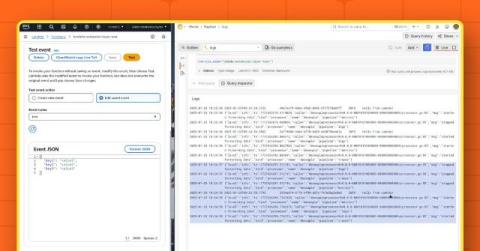
How to observe AWS Lambda functions using the OpenTelemetry Collector and Grafana Cloud

Getting telemetry data out of modern applications is very straightforward—or at least it should be. You set up a collector that either receives data from your application or asks it to provide an up-to-date state of various counters. This happens every minute or so, and if it’s a second late or early, no one really bats an eye. But what if the application isn’t around for long? What if every second waiting for the data to be collected is billed?

A Quick Guide for OpenTelemetry Python Instrumentation

OpenTelemetry is an open-source tool that helps you keep an eye on your application’s performance. Whether you’re building microservices, using serverless setups, or working with a traditional monolithic app, it’s crucial to monitor and trace your app’s behavior for debugging and optimization. OpenTelemetry's Python instrumentation is an excellent way to track traces, metrics, and logs across your entire app.

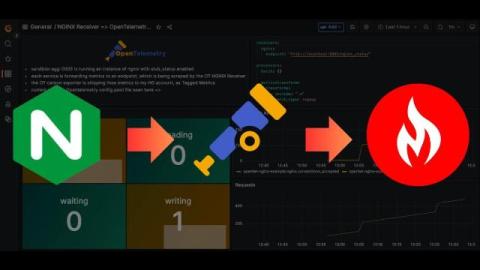
Easiest Way to Monitor NGINX Performance with OpenTelemetry

If you're looking for a straightforward way to collect NGINX metrics via OpenTelemetry and send them to your Graphite-based monitoring setup, this article is for you! With minimal configuration you’ll be collecting key metrics from your NGINX connections within minutes. In this article, we'll explain how to install the OpenTelemetry Collector, and easily configure it to receive and export NGINX metrics to a Hosted Carbon endpoint.

Discovering the Magic Behind OpenTelemetry Instrumentation - Jose Gomez-Selles | Fosdem 2025

Instrumentation is the secret ingredient that brings observability to life, revealing the intricate workings of applications in ways logs and metrics alone can’t match. In this talk, we’ll dive deep into the magic of OpenTelemetry instrumentation, exploring how to uncover hidden insights within your applications and services.