|
By Chris Cooney
There are several big barriers to an effective tracing strategy. Modern applications require complex code instrumentation, and legacy applications might not be so easy to alter, and that’s assuming every engineering team can be engaged to make the necessary changes. eBPF & OpenTelemetry flip this entire problem on its head, and Coralogix is one of the first major observability platforms to leverage this exciting functionality, to provide an unobtrusive, low risk overview of your system.
|
By Emma Lampert
Imagine you’re a product manager at a B2B SaaS company. Monday morning, a frustrated client floods your inbox—their workflows were disrupted by a slowdown you could’ve caught sooner with better user insights. Now, imagine running an e-commerce store on Cyber Monday. Traffic surges, but abandoned carts spike. Your RUM dashboard reveals slow mobile checkouts. A quick fix saves thousands in sales.
Imagine being the new developer in a bustling tech company. Everyone is rushing to meet deadlines, and no one has time to explain the tangled web of services, databases, and messaging systems that make up the organization’s architecture. You search high and low for documentation, but the few diagrams you find are outdated or incomplete. Feeling lost? This is where metrics can come to the rescue.
|
By Kushal Babu
As the holiday season comes to an end and we step into 2025 with renewed energy and excitement, Coralogix kicks off the year with a remarkable gift of achievements! In the G2 Winter 2025 Reports, we are thrilled to announce that we’ve been recognized with a phenomenal 126 badges across multiple categories and market segments. This remarkable feat is a testament to the trust and love of our customers and the dedication of our team.
So, there I was, a newbie to.NET 9.0, Blazor, and Coralogix, standing on the precipice of observability in a world of production bugs and development mysteries. As an Agile enthusiast, I’m well versed in all things “observability” and how it’s a game-changer for root cause analysis, especially in today’s rapid, iterative development cycles. Observability is like getting X-ray vision into your application to understand what’s truly happening based on system outputs.
|
By Emma Lampert
As we gear up for AWS re:Invent this December, we’re excited to share some of the latest innovations that make our platform stand out. Coralogix continues to evolve with powerful new capabilities designed to simplify observability, improve performance monitoring, and deliver actionable insights across your systems. From advanced visualization tools to AI-powered troubleshooting, these updates reflect our commitment to empowering teams with smarter, faster ways to solve complex challenges.
|
By Chris Cooney
When discussing what makes a product different, what makes it unique, we are led down the path of feature comparison. It is a natural thing to break down a product into its component parts to ease the process of weighing and measuring each layer. Does the authentication layer support SAML? Can platform components be defined in code? Beneath each of these features, however, is a foundational strata. A golden thread that enables and constrains each and every piece.
|
By Andre Scott
As the official implementation date approaches for the Digital Operational Resilience Act (DORA) – financial institutions and their information and communication technology (ICT) service providers, across the European Union are gearing up for a significant shift in their operational landscape.
When we talk about Real User Monitoring (RUM), it’s easy to get wrapped up in metrics—the hard numbers that tell us about our users’ experiences. But RUM is more than just data; it’s the foundation for improving performance, an essential key to user experience. The big question is: how do you accurately measure that experience across different kinds of applications?
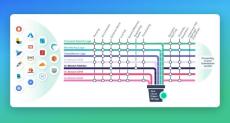
In a world where microservices rule and distributed architectures are the norm, understanding how a single request flows through your system can be an overwhelming challenge. But don’t worry—there’s light at the end of the tunnel! And not just one light, but four.
|
By Coralogix
We had a blast at AWS re:Invent 2024 and our team was invigorated by the incredible response and feedback we received from the thousands of participants who visited our booth. It was clear that a recurring theme among companies is the need for an observability solution that not only scales affordably with increasing data volumes but is also at the forefront of innovation. Coralogix stands out as the ideal match for these requirements.
|
By Coralogix
Coralogix supports multi-tenancy, allowing multiple teams to be connected under a single organization. Some companies prefer separate teams to isolate data based on the environment it originates from like: Dev, QA, or Production. While others prefer to isolate the data based on organizational units like: Infrastructure, Security, and Application. Coralogix allows you to associate multiple teams with an Organization.
|
By Coralogix
Coralogix TCO Optimizer allows you to assign different logging pipelines for each application and subsystem pair and log severity. In this way, it allows you to define the data pipeline for your logs based on the importance of that data to your business.
|
By Coralogix
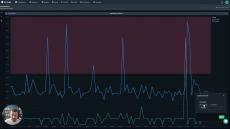
Let's explore the rich and powerful world of Custom Dashboards in Coralogix, with explanations of every widget, powerful functionality, flexible variables and much more. This video will leave no stone unturned!
|
By Coralogix
Explore the Archive Query mode in Coralogix Custom Dashboards, to visualize data that has long since left your archive, without paying for enormous indexing costs. Hold the data in your cloud account, and query, transform and enhance, with a single button press.
|
By Coralogix
Defining Alerts and Metrics in Coralogix is the easiest thing in the world. In this video, we'll explore three different alerts and metrics that can be generated, without writing a line of code.
|
By Coralogix
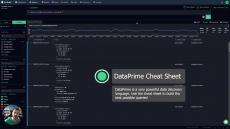
DataPrime is much more than a simply querying language. It's a data discovery language, allowing for powerful aggregations and insight generation, right in the Coralogix UI.
|
By Coralogix
The Coralogix Remote Archive solution is incredibly powerful, but there are techniques to maximise the value you get out of the Coralogix platform.
|
By Coralogix
In this video, we'll explore the functionality and best practices with Coralogix Remote Query for Logs. Coralogix supports direct, unindexed queries to the archive for both logs and traces, and stores data in cloud object storage directly in the customers cloud account, making for rock bottom retention costs, blazing fast performance and outstanding scalability.
|
By Coralogix
There are numerous types of logs in AWS, and the more applications and services you run in AWS, the more complex your logging needs are bound to be. Learn how to manage AWS log data that originates from various sources across every layer of the application stack, is varied in format, frequency, and importance.
- February 2025 (2)
- January 2025 (3)
- December 2024 (1)
- November 2024 (4)
- October 2024 (1)
- September 2024 (5)
- August 2024 (4)
- July 2024 (2)
- June 2024 (4)
- May 2024 (3)
- April 2024 (2)
- March 2024 (4)
- February 2024 (2)
- January 2024 (7)
- December 2023 (5)
- November 2023 (2)
- October 2023 (2)
- September 2023 (9)
- August 2023 (14)
- July 2023 (6)
- June 2023 (9)
- May 2023 (12)
- April 2023 (7)
- March 2023 (10)
- February 2023 (7)
- January 2023 (4)
- December 2022 (4)
- November 2022 (6)
- October 2022 (14)
- September 2022 (6)
- August 2022 (7)
- July 2022 (9)
- June 2022 (10)
- May 2022 (7)
- April 2022 (9)
- March 2022 (11)
- February 2022 (10)
- January 2022 (7)
- December 2021 (9)
- November 2021 (8)
- October 2021 (7)
- September 2021 (7)
- August 2021 (8)
- July 2021 (5)
- June 2021 (6)
- May 2021 (8)
- April 2021 (8)
- March 2021 (15)
- February 2021 (10)
- January 2021 (15)
- December 2020 (16)
- November 2020 (10)
- October 2020 (21)
- September 2020 (14)
- August 2020 (15)
- July 2020 (9)
- June 2020 (11)
- May 2020 (10)
- April 2020 (13)
- March 2020 (8)
- February 2020 (2)
- January 2020 (3)
- December 2019 (1)
- September 2019 (2)
- August 2019 (1)
- June 2019 (2)
- April 2019 (1)
- March 2019 (1)
- January 2019 (1)
- December 2018 (1)
- October 2018 (2)
- August 2018 (1)
- July 2018 (3)
- June 2018 (1)
- May 2018 (1)
- April 2018 (1)
- November 2017 (1)
- September 2017 (1)
Coralogix helps software companies avoid getting lost in their log data by automatically figuring out their production problems:
- Know when your flows break: Coralogix maps your software flows, automatically detects production problems and delivers pinpoint insights.
- Make your Big Data small: Coralogix’s Loggregation automatically clusters your log data back into its original patterns so you can view hours of data in seconds.
- All your information at a glance: Use Coralogix or our hosted Kibana to query your data, view your live log stream, and define your dashboard widgets for maximum control over your data.
Our machine learning powered platform turns your cluttered log data into a meaningful set of templates and flows. View patterns and trends, and gain valuable insights to stay one step ahead at all times!


