|
By Pablo Fernandez
Observability in software is often framed as a choice between self-hosted and SaaS: manage it yourself, or pay a vendor to handle your data. Both self-hosted and SaaS approaches have their merits, but assuming you must choose one exclusively over the other leads to poor trade-offs: either overcommitting to an all-in-one SaaS despite spiraling costs, or fully self-hosting when it’s unnecessary.
|
By Diana Todea
KubeCon + CloudNativeCon Europe in Amsterdam brought together about 13,500 attendees this year, the largest turnout yet. The size of the event showed just how much the cloud-native space has grown, and how central observability, platform engineering, and cost control have become. For VictoriaMetrics, this year’s event was a mix of talks, booth conversations, and a lot of direct feedback from users.
|
By Fred Navruzov
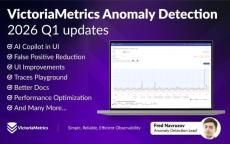
Following our 2025 updates, here we recap how VictoriaMetrics Anomaly Detection evolved in Q1 2026. Stay tuned for upcoming content on anomaly detection.
|
By Jose Gomez-Selles
Q1 2026 has been one of our most eventful quarters yet for VictoriaMetrics Cloud. We shipped something we have been building towards for a long time, crossed a few infrastructure milestones, and started clearing the path for what is coming next to the most performant observability stack.
|
By Zhu Jiekun
Last month, the VictoriaMetrics team gave a talk on retroactive sampling at KubeCon Europe 2026. By writing this blog post, as a transcript of the session, we want to explain how retroactive sampling reduces outbound traffic, CPU, and memory usage in the data collection pipeline significantly compared to tail sampling in OpenTelemetry.
|
By Pablo Fernandez
Welcome to the March release roundup of VictoriaMetrics Stack, covering key enhancements in VictoriaMetrics and VictoriaLogs. These updates deliver improved UI scalability, enhanced authentication flexibility, improved query performance, and logging tools that streamline observability workflows in production environments. This roundup covers releases for.
|
By Pablo Fernandez
Writing code is moving from the good old IDE into the realm of autonomous AI agents. One example of this is OpenAI, which has been developing internally with 0 lines of manually written code. You can read about their workflow in their engineering blog: Harness engineering: leveraging Codex in an agent-first world. For me, the main takeaway of OpenAI’s article is how AI has rewritten the constraints equation.
|
By Vadim Alekseev
At VictoriaMetrics, we built vlagent as a high-performance log collector for VictoriaLogs. To validate its performance and correctness under a real production-like load, we developed a benchmark suite and ran it against 8 popular log collectors. This post covers the methodology, throughput results, resource usage, and delivery correctness. Collectors under the test: We’ve made all benchmark configurations and source code public, so you can reproduce and verify the results independently.
|
By Pablo Fernandez
This month, we’re thrilled to see OpenAI using the VictoriaMetrics Stack internally — including VictoriaMetrics, VictoriaLogs, and VictoriaTraces — in their Harness engineering experiment, as shown in their architecture diagram. It’s a great way of combining observability and AI agents.
|
By Diana Todea
Last week, members of the VictoriaMetrics team, including myself, spoke at three very different but equally important community events: FOSDEM in Brussels, Cloud Native Days France in Paris, and CfgMgmtCamp in Ghent. Each event drew a different crowd with its own expectations, making them a good way to see where open source observability stands today and how VictoriaMetrics is adapting to real-world needs. The talks we gave were snapshots of the problems we are actively working on.
|
By VictoriaMetrics
VictoriaMetrics continues to enhance usability and developer experience with new built-in capabilities. A lightweight UI now provides clear client setup instructions, simplifying onboarding, while an integrated inspector offers powerful debugging tools directly within the platform. Default tenant configuration further streamlines initial setup, reducing friction for new deployments. In addition, the MCP Server is now included by default in VictoriaMetrics Cloud deployments, eliminating the need for manual installation and making advanced monitoring workflows more accessible out of the box.
|
By VictoriaMetrics
Our agenda: Warm up VictoriaMetrics roadmap updates Anomaly Detection Updates VictoriaMetrics Cloud Updates VictoriaLogs roadmap Update Community News AMA session.
|
By VictoriaMetrics
In this episode of Telemetry Talks, we explore OpenTelemetry observability signals—metrics, logs, and traces, and how VictoriaMetrics handles each of them with high performance, cost efficiency, and seamless integration. We briefly explain what each signal is, discuss common misconceptions, and share guidance on which signal to start with if you're new to observability. Together with our guests, both engineers at VictoriaMetrics, we walk through integrating VictoriaMetrics with the OpenTelemetry demo, showcase Grafana dashboards, and check the playgrounds for all three signals to see them in action.
|
By VictoriaMetrics
DevRel often means juggling goals that feel completely opposite: building trust while driving adoption, serving developers while supporting business growth. In this short, we explore why these “contradictions” are actually the secret to great Developer Relations.
|
By VictoriaMetrics
In this DevEx Talks episode, Adriana Villela and Cortney Nickerson explore what truly matters in open source through the lens of women in Developer Relations and Community roles. From diverse career paths to navigating DevRel as women in tech, they share honest reflections on impact, feedback, and long-term motivation in cloud native ecosystems.
|
By VictoriaMetrics
Telemetry Talks – Episode is here! In this episode, Diana and Jose introduce VictoriaMetrics Cloud, covering what it is, the problems it solves, and its pricing model, including how overages are handled. If you’re building or operating cloud-native systems and want a clearer, real-world understanding of OpenTelemetry and managed observability, this episode is for you. Resources for Further Learning.
|
By VictoriaMetrics
Resources for Further Learning.
|
By VictoriaMetrics
The final piece of the PaaS puzzle is observability. Once the platform is built, the challenge shifts to managing the volume of data generated by distributed services. In our first Tech Talk of 2026, Mathias and Marc discuss the technical path from platform deployment to standardized observability. We focus on the practical implementation of OpenTelemetry (OTel) and why choosing a high-performance backend is critical to avoiding the "Observability Tax.".
|
By VictoriaMetrics
In the first episode of Telemetry Talks, Diana talks with Jose, VictoriaMetrics Cloud Lead, about the practical origins of observability and how OpenTelemetry is shaping modern monitoring. They cover why observability became critical as systems moved from monoliths to microservices, how OpenTelemetry unifies traces, metrics, and logs while avoiding vendor lock-in, and how it integrates natively with VictoriaMetrics.
|
By VictoriaMetrics
Join Marc Sherwood and Jose Gomez-Selles as they unveil the significant updates to VictoriaMetrics Cloud from Q3 2025 and share a glimpse into the exciting roadmap for what's coming next! This session is packed with new features designed to make your monitoring experience more robust, user-friendly, and cost-effective. In this video, you'll discover: Expansion to Asia! VictoriaMetrics Cloud now has a brand new region on AWS ap-southeast-1 (Singapore) in Asia Pacific, bringing lower latency and regional data sovereignty closer to your teams and deployments.
- April 2026 (9)
- March 2026 (5)
- February 2026 (5)
- January 2026 (6)
- December 2025 (8)
- November 2025 (4)
- October 2025 (8)
- September 2025 (6)
- August 2025 (7)
- July 2025 (1)
- June 2025 (8)
- May 2025 (4)
- April 2025 (4)
- March 2025 (4)
- February 2025 (8)
- January 2025 (3)
- December 2024 (3)
- November 2024 (3)
- October 2024 (3)
- September 2024 (2)
- August 2024 (5)
- July 2024 (2)
- June 2024 (4)
- May 2024 (2)
- April 2024 (1)
- March 2024 (2)
- February 2024 (1)
- December 2023 (3)
- November 2023 (5)
- October 2023 (5)
- September 2023 (1)
- August 2023 (1)
- July 2023 (1)
- June 2023 (2)
- May 2023 (2)
- April 2023 (2)
- March 2023 (2)
- February 2023 (1)
- January 2023 (5)
- December 2022 (1)
- October 2022 (3)
- September 2022 (2)
- August 2022 (1)
- May 2022 (2)
- April 2022 (2)
- March 2022 (1)
- February 2022 (1)
- January 2022 (4)
- September 2021 (1)
- June 2021 (1)
- March 2021 (1)
- August 2020 (2)
- June 2019 (1)
VictoriaMetrics is a fast, cost-effective and scalable open source monitoring solution and time series database typically used for processing high volumes of data and for long term data storage. Discover our state-of-the-art, open source monitoring and observability solutions that deliver incredible performance, ease of use, scalability and (cost-)efficiency.
Our Products:
- VictoriaMetrics is a fast and scalable open source time series database and monitoring solution that lets users build a monitoring platform without scalability issues and minimal operational burden.
- VictoriaMetrics Enterprise is the fastest open-source monitoring solution and time series database supercharged with custom features, expert architectural guidance and priority support.
- Monitoring of Monitoring: For the most well-tuned system, let our MoM service do the monitoring of your monitoring and detect, mitigate and prevent potential issues before they become major problems.
- Managed VictoriaMetrics is an easy-to-configure-and-run solution that removes the extra complexity and maintenance burden typically associated with open source time series database and monitoring solutions.
We Make Monitoring Simple & Reliable For Everyone.


