|
By Shyam Sreevalsan
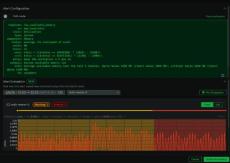
Netdata ships with hundreds of stock alerts. They cover a wide range of infrastructure conditions and they’re designed with sensible defaults. But “sensible defaults” and “correct for your environment” are not the same thing. A CPU threshold that’s perfectly reasonable for a build server might generate constant noise on a machine running batch jobs.
|
By Shyam Sreevalsan
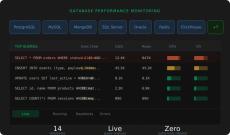
Netdata has always collected database metrics: connections, throughput, replication lag, buffer cache hit ratios, and so on. These tell you that something is wrong, but they don’t tell you why. When your PostgreSQL response time spikes, the metric alone doesn’t tell you which query is responsible. For that, you’ve traditionally needed to SSH into the box, connect to the database, and run diagnostic queries manually. Or set up a separate database monitoring tool entirely.
|
By Shyam Sreevalsan
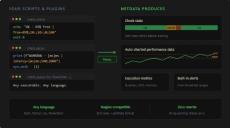
A lot of teams have a collection of Nagios plugins and custom monitoring scripts that have been running reliably for years. Some are standard community plugins for checking disk health or SSL certificate expiry. Others are homegrown Bash or Python scripts that check something very specific to the business: whether an API endpoint returns the right payload, whether a batch job completed on time, whether a queue depth is within bounds.
|
By Netdata Team
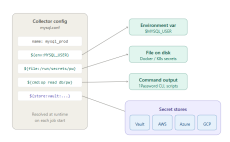
If you’re running Netdata collectors that connect to databases, APIs, or other authenticated services, there’s a good chance you have passwords sitting in plain-text configuration files right now. It works, but it’s the kind of thing that makes security teams nervous and makes credential rotation painful. Every password change means editing config files and restarting collectors.
|
By Shyam Sreevalsan
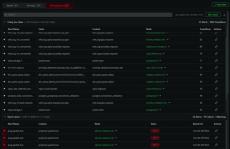
Alert fatigue usually isn’t caused by one thing. It’s the accumulation of thresholds that are slightly too sensitive, alerts that fire during known maintenance windows, and historical patterns that nobody has the tools to review easily. Fixing it requires better visibility into how alerts actually behave over time, and a way to test changes before they hit production. We’ve shipped three improvements to alerting in Netdata that address different parts of this problem.
|
By Netdata Team
One of the most common requests we’ve gotten since launching custom dashboards is deceptively simple: “How do I put this on a TV?” Teams want their dashboards on wall-mounted screens in NOCs, war rooms, and open office spaces. The dashboard is already built. The data is already there. They just need a way to display it on a screen that nobody is logged into, without exposing the full Netdata Cloud interface. TV mode does exactly this.
|
By Shyam Sreevalsan
Custom dashboards in Netdata have always let you pull charts together on-the-fly into a single view. That’s useful, but it’s also limited. In practice, when you’re running an incident or reviewing a service, you don’t just want charts. You want to see the output of top alongside your CPU metrics. You want slow query logs next to your database latency charts.
|
By Netdata Team
If you’ve ever opened the alerts tab during a busy period, you know the problem. There are alerts you’ve already looked at, alerts someone on your team is handling, and alerts that fired on a known issue that’s being worked on. They all sit together in the same list alongside the new ones you haven’t seen yet.
|
By Shyam Sreevalsan
Charts in Netdata have always been interactive. You can zoom, pan, select time ranges, and see per-second granularity across thousands of metrics. But when you spotted something interesting, the next steps usually meant leaving the chart: opening another tab to check a related metric, navigating to the correlation tool, or pulling up a different time range for comparison. The investigation workflow lived outside the chart, even though the chart was where the investigation started.
|
By Shyam Sreevalsan
Netdata AI can already troubleshoot your alerts and generate Insights reports. What it couldn’t do, until now, was have a back-and-forth conversation. You could get a one-shot analysis, but you couldn’t ask follow-up questions, pull in additional context, or go from a quick question to a full investigation without starting over. We’ve added a conversational layer to Netdata AI.
|
By Netdata
What’s New in Netdata v2.10 In this release, Netdata brings powerful new capabilities to help you monitor, troubleshoot, and understand your infrastructure faster without complexity. In this video, we walk through the key updates: Secrets Management – Securely manage sensitive configuration data Nagios Plugins Collector – Extend monitoring using existing Nagios plugins Azure Monitor – Bring Azure metrics into Netdata for unified visibility.
|
By Netdata
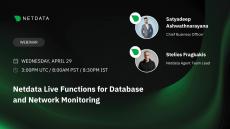
See how Netdata's new Live Functions let you analyze slow queries, detect deadlocks, and monitor SNMP network interfaces directly from the Netdata dashboard, with a live demo.
|
By Netdata
Netdata has shipped MCP servers on every Agent since v2.6.0. Now we're taking the next step: a cloud-hosted MCP endpoint that gives AI agents and assistants infrastructure-wide visibility through a single connection.
|
By Netdata
What’s New in Netdata v2.9 In this video, we walk through the biggest updates in Netdata v2.9, including: Top Tab Database Functions to analyze slow queries and performance bottlenecks without logging into your database SNMP Network Interfaces Function for real-time visibility into network interfaces Microsoft SQL Server Collector with richer MSSQL metrics OpenTelemetry Logs Ingestion to correlate logs and metrics in one place.
|
By Netdata
Network device monitoring is often a mess of polling, graphs, and alerts that don't lead to answers. In this webinar, we'll show how to monitor routers, switches, and firewalls in a way that quickly surfaces what matters: interface health, errors, drops, saturation, latency signals, and performance regressions—without drowning in noise. You'll learn how Netdata turns raw SNMP metrics into high-signal insights using automated anomaly detection and AI-assisted troubleshooting, so your team can move from 'something is wrong' to 'here's the root cause' faster.
|
By Netdata
Avoid the most expensive hour of incident response. Learn how Netdata AI uses hybrid AIOps to detect, reason, and summarize incidents.
|
By Netdata
In just a few minutes, this walkthrough will show you how to unlock the full power of Netdata during your trial period. From real-time metrics to AI-powered insights, learn how to get immediate value without any guesswork. Whether you're running a Homelab or managing production systems at scale, this video will help you hit the ground running and make every minute of your trial count. Let’s turn your trial into insight, clarity, and control.
|
By Netdata
Netdata 2.6.0 is here and it’s our most intelligent release yet! This version brings AI-powered monitoring, easier network visibility, and smoother enterprise integrations, all designed to help you troubleshoot faster and scale smarter. What's New: Netdata Referral Program Every referred user will get a 10% discount when they subscribe to Netdata Business or Homelab - and you will receive 10% of their subscription value (up to a max of 1000$ per space). You can refer an unlimited number of users, so there's no real limit to how much you can earn with the referral program.
|
By Netdata
New to Netdata? Start here. In this quick and practical guide, we’ll help you get set up and confident with Netdata in just a few minutes. You’ll learn how to: Access your Netdata Space Connect your nodes—servers, VMs, containers, network devices, and more Organize your infrastructure with Spaces and Rooms Collaborate with your team in real time Explore alerting and integrations Customize notifications so you’re only alerted when it truly matters.
|
By Netdata
Subscribe to the channel → / @netdata Now in research preview: Netdata Insights The problem: Incident? You're jumping between dashboards, piecing together timelines. Reporting? You're copy-pasting charts and correlating trends by hand. The data’s there, but turning it into a narrative doesn’t scale. The solution: Netdata Insights. Synthesizes high-fidelity telemetry using the latest LLMs into AI-powered reports with natural-language explanations, visuals, and clear recommendations.
- April 2026 (13)
- March 2026 (1)
- February 2026 (2)
- January 2026 (1)
- December 2025 (3)
- November 2025 (1)
- October 2025 (2)
- September 2025 (2)
- August 2025 (2)
- July 2025 (5)
- June 2025 (2)
- May 2025 (2)
- April 2025 (1)
- March 2025 (5)
- February 2025 (1)
- January 2025 (2)
- December 2024 (6)
- November 2024 (6)
- October 2024 (2)
- August 2024 (1)
- June 2024 (5)
- May 2024 (3)
- April 2024 (4)
- March 2024 (6)
- February 2024 (3)
- January 2024 (3)
- December 2023 (4)
- November 2023 (7)
- October 2023 (9)
- September 2023 (6)
- August 2023 (3)
- July 2023 (8)
- June 2023 (7)
- May 2023 (20)
- April 2023 (3)
- March 2023 (6)
- February 2023 (6)
- January 2023 (5)
- December 2022 (8)
- November 2022 (12)
- October 2022 (19)
- September 2022 (7)
- August 2022 (1)
- July 2022 (1)
- June 2022 (7)
- May 2022 (9)
- April 2022 (7)
- March 2022 (4)
- February 2022 (2)
- December 2021 (7)
- November 2021 (1)
- October 2021 (7)
- September 2021 (2)
- August 2021 (1)
- June 2021 (1)
- May 2021 (2)
- April 2021 (1)
- March 2021 (2)
- February 2021 (2)
- January 2021 (3)
- December 2020 (5)
- November 2020 (5)
- October 2020 (5)
- September 2020 (7)
- August 2020 (3)
- July 2020 (5)
- June 2020 (2)
- April 2020 (2)
- March 2020 (3)
- February 2020 (3)
- January 2020 (1)
- December 2019 (1)
- November 2019 (2)
- October 2019 (1)
- September 2019 (1)
- August 2019 (1)
- July 2019 (2)
netdata is a system for distributed real-time performance and health monitoring. It provides unparalleled insights, in real-time, of everything happening on the system it runs (including applications such as web and database servers), using modern interactive web dashboards.
netdata is fast and efficient, designed to permanently run on all systems (physical & virtual servers, containers, IoT devices), without disrupting their core function.


