Operations | Monitoring | ITSM | DevOps | Cloud

Lumigo

Leveraging AI for Predictive Analytics in Observability

Predictive analytics has become a key goal in observability. If teams can foresee potential system failures, performance bottlenecks, or resource constraints before they happen, they can act preemptively to mitigate issues. AI holds the promise of making this possible. In this post, we explore how AI can push observability toward predictive analytics, the industry’s current hurdles, and practical use cases for leveraging AI today.

Shaping the Next Generation of AI-Powered Observability

Observability is crucial for maintaining complex systems’ health and performance. In its traditional form, observability involves monitoring key metrics, logging events, and tracing requests to ensure that applications and infrastructure run smoothly. The emergence of Artificial Intelligence (AI) promises to revolutionize the way organizations approach observability.

The Importance of Securing Data in Traces

Trace spans are captured in the runtime after decrypting the request. This means that any sensitive data is available in plain text. This is also the case for logging; however, logging requires an explicit log statement to be coded by the engineer. Additionally, engineers can add arbitrary information to trace spans, which could expose sensitive information. Collecting sensitive information in trace spans or logging events could expose an organization to a number of risks.

Lumigo Introduces AI to Simplify Observability Workflows

Lumigo is expanding its troubleshooting and observability platform with cutting-edge AI-powered tooling, now available in beta, which will provide developers and DevOps teams with the fastest and most cost-efficient way to debug and observe complex microservices. AI is quickly reshaping the technology landscape. However, observability tools have been slow to find ways to leverage AI in a fashion that provides tangible value.

Announcing Lumigo's New Multiple Dashboards Functionality

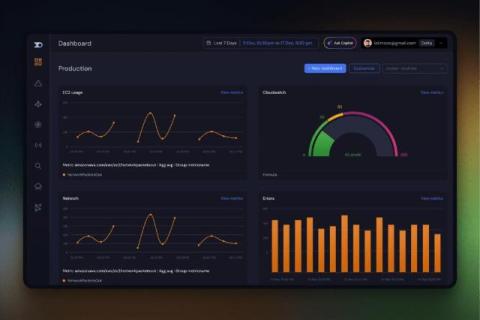
In today’s complex cloud-native environments, observability is key to maintaining performance, reliability, and scalability. However, different teams often need to focus on different aspects of the system. Developers might be more interested in error rates and response times, while operations teams must monitor system health and resource utilization. Lumigo now supports multiple dashboards, so you can provide each team with the information they need precisely how they need it.

Improving Developer Efficiency

Developers are expensive to hire, and it takes time to get new hires up to speed. Getting the most out of developers and retaining them should be a priority for any organization. Fortunately, developers like creating new stuff, and organizations want new functionality. Therefore, if there was a way of minimizing the time spent fixing bugs, the new feature backlog would be reduced, and happy developers would stay around.

OpenTelemetry Is The Strategic Choice

OpenTelemetry (OTel) should be at the heart of your observability strategy. There is no longer a need to pay for the collection of telemetry data; instead, use the unified OTel standard for all your telemetry data. Once you have the data in a standard form, you can choose where to process it, either on your own servers or via one of many SaaS providers.