Operations | Monitoring | ITSM | DevOps | Cloud

Lightrun

Mastering Live Debugging Techniques: A Must-Have Guide for Developers

Software debugging has undergone many transcendental shifts. These shifts are as fascinating as the transition from the biological origins of the term ‘debugging’ to its computer science incarnation. The moth that caused the first computer bug has led to a metamorphosis of the debugging scope to cover a much broader role in software development over the years. Live debugging is the latest manifestation of this evolution.

The 7 Most Common Python Debugging Challenges and How to Handle Them

According to PYPL (PopularitY of Programming Language), Python has been the most popular programming language worldwide from 2018 to the present. Remarkably, Python’s popularity has grown by 2.5% over the last five years. In contrast, Java, the previously most popular language, has seen a 4.8% decrease in its popularity. While Java is typically faster than Python, Python is easier to read with its simpler syntax.

Advancing Observability Maturity: Core Benefits

One of the major trends in software development in the last decade has been “shifting left” responsibilities that have traditionally been under operation’s domain to earlier in the software development life cycle (SDLC). It first came in the form of DevOps where a lot of the software engineering best practices were introduced to the deploy, operate, monitor phases. Such examples include continuous integration and continuous deployment (CI/CD) and Infrastructure as Code (IaC).

Lightrun LogOptimizer Gets A Developer Productivity and Logging Cost Reduction Boost

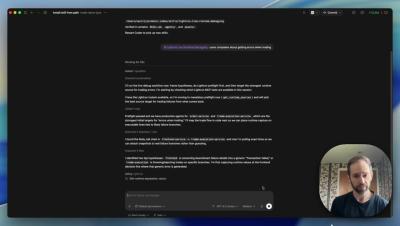
Lightrun’s LogOptimizer stands as a groundbreaking automated solution for log optimization and cost reduction in logging. An integral part of the Lightrun IDE plugins, this tool empowers developers to swiftly scan their source code—be it a single file or entire projects—to identify and replace log lines with Lightrun’s dynamic logs, all within seconds.

Troubleshooting K8S EKS with Lightrun Developer Observability Platform

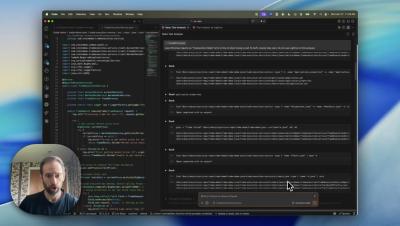
In this demo video we show how developers can shift left observability and debug in runtime an EKS cluster from their IDE. The demo shows how developers can debug a remote Java application that is deployed on 3 different EKS pods (Dev, Staging, Production) directly from their IntelliJ IDE in runtime and add logs and snapshots.

Live Debugging for Critical Systems

Live debugging refers to debugging software while running in production without causing any downtime. It has gained popularity in modern software development practices, which drives many critical systems across businesses and industries. In the context of always-on, cloud-native applications, unearthing severe bugs and fixing them in real time is only possible through live debugging. Therefore, live debugging becomes an integral part of any developer’s skill set.

Why Real-Time Debugging Becomes Essential in Platform Engineering

Platform engineering has been one of the hottest keywords in the software community in recent years. As a natural extension of DevOps and the shift-left mentality it fosters, platform engineering is a subfield within software engineering that focuses on building and maintaining tools, workflows, and frameworks that allow developers to build and test their applications efficiently.