

|
By James Michaelis
High tech companies that use their own solutions project confidence to their customers that solutions truly work. Many teams across Stackify use Retrace internally, and my time in customer support gave me great insights into how our customers relied on Retrace to ensure applications consistently delivered a great user experience.

|
By James Michaelis
Since joining Stackify in 2014 during the early stages of the startup company, I have had the privilege of working in various roles along the way. I began in customer support, moved to the QA team, and am now the product manager for Stackify Retrace.

|
By Stackify Team
PowerShell is a command-line-based shell and scripting language that automates tasks on the Windows OS. PowerShell lets you automate any task normally done on Windows, like installing programs or updating software, allowing you to complete those tasks faster and on a larger scale. You can even extend its powers with Azure PowerShell to control Azure’s robust functionality, allowing you to use cmdlets to provision VMs, create cloud services, and carry out a number of other complex processes.

|
By mwatson
How is DevOps going within your organization? If you need help measuring its success, we have prepared a list of key DevOps metrics such as MTTR MTBF, MTTA, and MTTF to track. These metrics can help you understand how your team is doing over time.

|
By James Michaelis
In an agile DevOps environment, developers move quickly and often, making small changes in ongoing sprints. Once applications go live, operations teams (and often times, developers themselves) take over performance management and issue resolution, while updates and improvements continue. Developers and DevOps teams need a continuous flow of information on how each iteration works, fails, or worse – introduces new problems.

|
By jmichaelis
Every organization relies on mission-critical applications and services that ultimately generate revenue, so the user experience has never been more important. Companies trust their developer and operations (DevOps) teams to ensure important applications run smoothly. DevOps teams, in turn, trust application performance optimization tools to quickly identify and resolve issues or avoid them altogether in the first place.

|
By Stackify Team
For distributed systems and microservices, message brokers play a very important role. Message brokers keep data flowing smoothly between different parts of our applications. Two names that often come up in discussions about message brokers are RabbitMQ and Kafka. But what exactly are they, and how do they differ?

|
By Stackify Team
A 502 Bad Gateway error implies that the server (Nginx) can’t properly communicate with the upstream web application server. A sign of more severe problems, such as server overload, improper configuration, or network failure, a 502 Bad Gateway error can cause service interruption, which can translate to revenue loss. Fortunately, you can easily resolve the error in Nginx once you identify the causes.

|
By Stackify Team
Bash, or the Bourne Again SHell, is a command-line interpreter popular in Unix-like operating systems. The default shell for most Linux distributions and older macOS versions, Bash is a preferred tool by many developers and system administrators. A versatile tool for interacting with UNIX-based systems, Bash terminal commands handles a wide range of tasks, including: Bash is the most widely used command-line interface (CLI).

|
By Stackify Team
Redis is an in-memory data store used primarily as a quick-response database or an application cache. As an open-source NoSQL database, Redis handles data operations in microseconds, making it perfect for applications that need real-time processing. Fast, flexible, and easy to use, Redis has become a key player in modern application design.. Developers love Redis for its scalability and because it delivers application performance much faster than traditional databases, thanks to its in-memory operations.


|
By Stackify
Stackify’s commitment to serving a broad array of industries is evident from its varied customer portfolio. From BigBank and Big Pharma to Logistics Supplier and Retail Bank, the Self-Hosted Retrace has proven adaptable and essential across different sectors. This versatility not only demonstrates the solution's robustness but also its capacity to meet your industry-specific demands, affirming Stackify's role as a critical tool in the optimization of IT infrastructures globally.

|
By Stackify
This presentation outlines the various options for installing the Retrace Agent, with a focus on the manual installation process.
|
By Stackify
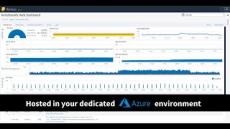
Our customers can now get a self hosted Retrace, where their own data will never leave the Azure cloud environment. Stackify by Netreo will deploy and manage the Retrace platform that includes infrastructure components and software. Customer will get the access to the Retrace within their corporate domain, rather than public internet.

|
By Stackify
We are excited to inform you that Open Telemetry is now available for you with the introduction of “Netreo OTel Appliance”. With the OTel Appliance, cloud-native services like AWS Lambda, AWS ECS, AWS EKS, Azure Functions, Azure App Services, Azure Container Instances, and Azure Kubernetes Services can be monitored and you see application traces and logs in Retrace UI (s1.stackify.com). The applications hosted in the cloud Serverless and containers can be monitored without running the Retrace agent within the instance itself.

|
By Stackify
Retrace Customers can now email their dashboards to anyone in the organisation or outside. The dashboard snapshot, together with a high quality PDF is sent as an email with very simple steps.

|
By Stackify
In the keynote recorded during our recent user group session NUGGETS 2023, Sanjeev Mittal, GM of Retrace talks about how organizations are rapidly moving their infrastructure to the cloud and how their costs and complexity are increasing. Our customers are looking for Observability solutions that give them control of data and costs.


|
By Stackify
What are profilers? Which is the best? Download our free guide and get all the answers around using a .NET profiler.
|
By Stackify
The right APM tool will monitor your applications proactively and reactively so you can sleep better at night.
|
By Stackify
Code level performance metrics, Azure monitoring, structured logging and more. Download our free guide and get all the answers around .NET monitoring.
|
By Stackify
Understand the implications for security, code visibility, team culture, and more. Download our free guide and get all the answers around DevOps.
|
By Stackify
Methods for optimizing web apps in Azure, logging, deploying to IIS, and more. Download our free guide and get all the answers around .NET Core.
|
By Stackify
Logging is a crucial part of any application for both debugging and audit purposes. Read about best practices and find how-to guides in our ebook.
- March 2025 (3)
- January 2025 (1)
- November 2024 (1)
- October 2024 (6)
- September 2024 (5)
- August 2024 (2)
- July 2024 (2)
- June 2024 (1)
- May 2024 (1)
- April 2024 (1)
- March 2024 (3)
- February 2024 (2)
- January 2024 (3)
- December 2023 (1)
- November 2023 (10)
- October 2023 (1)
- September 2023 (9)
- August 2023 (3)
- July 2023 (5)
- June 2023 (3)
- May 2023 (3)
- April 2023 (11)
- March 2023 (1)
- February 2023 (3)
- January 2023 (1)
- December 2022 (1)
- November 2022 (1)
- October 2022 (1)
- September 2022 (2)
- August 2022 (1)
- July 2022 (3)
- June 2022 (3)
- May 2022 (1)
- March 2022 (5)
- February 2022 (1)
- January 2022 (2)
- December 2021 (2)
- November 2021 (4)
- October 2021 (1)
- September 2021 (2)
- August 2021 (3)
- July 2021 (7)
- June 2021 (2)
- May 2021 (5)
- April 2021 (7)
- March 2021 (8)
- February 2021 (6)
- January 2021 (8)
- December 2020 (5)
- November 2020 (8)
- October 2020 (10)
- September 2020 (6)
- August 2020 (3)
- July 2020 (3)
- June 2020 (3)
- May 2020 (2)
- April 2020 (7)
- March 2020 (10)
- February 2020 (8)
- January 2020 (9)
- December 2019 (9)
- November 2019 (4)
- October 2019 (9)
- September 2019 (5)
- August 2019 (6)
- July 2019 (10)
- June 2019 (12)
- May 2019 (10)
- April 2019 (13)
- March 2019 (6)
- February 2019 (8)
- January 2019 (6)
- December 2018 (4)
- November 2018 (7)
- October 2018 (8)
- September 2018 (3)
- August 2018 (4)
- July 2018 (3)
- June 2018 (3)
- May 2018 (7)
- April 2018 (6)
- March 2018 (4)
- February 2018 (5)
- January 2018 (4)
- November 2017 (1)
- May 2017 (1)
- January 2017 (2)
- November 2016 (2)
- September 2016 (1)
Stackify helps developers manage and troubleshoot application problems with integrated monitoring, metrics, errors & logs.
Stackify offers the only developers-friendly cloud based solution that fully integrates application performance management (APM) with error tracking and log management in one platform. Stackify allows software developers, operations and support managers to easily monitor, detect and resolve application issues, before they affect the business to ensure a better end user experience, higher satisfaction and lower churn.
We provide an affordable APM solution designed for developers:
- Improve your code: Quickly identify ways to improve performance and fix hidden exceptions.
- Get more visibility: Retrace gives developers all the application insights they need in one place.
- Improve deployments: Track when deployments occur and if your team is shipping higher quality code.
Diagnose, Improve and Accelerate Performance. Stackify gives developers the confidence they need to deploy early and often.