|
By Lightrun Team
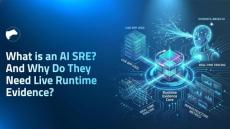
Modern site reliability engineering challenges stem from the difficult requirement of confirming why complex systems fail in ways staging cannot replicate. While observability tools signal failures, and AI SREs reason over data, they leave observability gaps regarding the actual state of running code. By utilizing runtime context, teams capture live execution data to accelerate production debugging, resolving incidents in minutes without requiring manual redeploy cycles.
|
By Lightrun Team
AI SREs are autonomous systems that handle incident triage, root cause analysis, and remediation by correlating logs, metrics, traces, and code signals. However, as they rely on pre-configured telemetry, the critical execution details of a specific failure, such as variable state and code paths, can often be missed. As a result, they either force users into manual redeploy loops or make inferences from partial data, diagnosing issues using probability rather than proof.
|
By Lightrun Team
AI SRE tools accelerate incident detection, root cause analysis, and remediation across distributed production systems. They ingest telemetry signals, including logs, metrics, traces, alerts, and deployment history, to correlate anomalies, narrow fault domains, and reduce manual triage. This guide breaks down the top AI SRE tools in 2026 and helps you choose the right one based on your team’s biggest bottleneck, whether that is faster triage, deeper root cause analysis, or runtime-level validation.
|
By Lightrun Team
Continuous monitoring tools track system health, performance, and behavior in real time across production environments. For a deeper understanding of how this fits into modern DevOps practices, see this guide on continuous monitoring and its impact on DevOps. They collect logs, metrics, and distributed traces across the infrastructure and application layers, giving engineering teams visibility into how their systems are running, where anomalies occur, and when something needs immediate attention.
|
By Lightrun Team
A runtime aware AI SRE extends existing AI SRE approaches by moving beyond telemetry correlation into runtime-validated reliability. While the majority of AI SRE tools accelerate incident triage using logs, metrics, and traces, they cannot confirm execution behavior if critical runtime signals were never captured. By generating on-demand evidence inside running services, AI SRES can eliminate slow redeploy cycles, ensuring your distributed systems remain resilient under real-world traffic conditions.
|
By Lightrun Team
Root cause analysis tools are designed to help engineering teams understand why failures happen in production and other remote environments. As modern systems become more distributed and input-dependent, many incidents cannot be reproduced outside live environments. The stakes are significant: high-impact IT outages cost organizations a median of $2 million per hour, with annual downtime costs reaching $76 million per organization.
|
By Lightrun Team
Claude Code, Anthropic’s coding agent, now integrates with Lightrun through MCP. AI code assistants have been flying blind. Google Dora’ 2025 report found it is causing, an almost 10% increase in code instability. Even with up to 1M tokens of context available in Claude, this powerful agenti cannot see how the code it writes actually behaves inside a live system under real traffic, real dependencies, and under a load of 10,000 requests per second.
|
By Maor Yaffe
Support teams frequently face vague customer reports and incomplete data but need to offer fast resolutions autonomously without escalating to developers. In this article, learn how to equip support engineers with tools to diagnose root causes in minutes, increasing self-sufficient issue resolution. We explore eliminating the ‘Reproduction Tax’ for ‘cannot reproduce’ bugs using runtime context to achieve technical certainty at scale.
|
By Lightrun Team
Reducing Mean Time to Resolution (MTTR) in production systems requires understanding failure behavior in real time. While AI code agents significantly accelerated software development and deployment, incident resolution has remained constrained by incomplete pre-captured telemetry. AI SRE tools improve signal correlation, but MTTR reduction requires runtime-verified diagnosis that confirms execution behavior directly in production systems.
|
By Lightrun
Autonomously Remediates Software Issues, Generates Missing Runtime Evidence on Demand, and Validates Hypotheses Against Live Execution from Code to Production.
|
By Lightrun
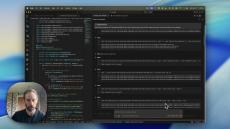
In this video, Lightrun’s Dan Putman demonstrates what happens when Lightrun MCP is integrated within Claude Code. See how, once activated, Claude can ask specific questions about what services it can see and instrument in order to perform a deep investigation in production to get to a validated root cause analysis without the friction of redeploying or switching contexts.
|
By Lightrun
Lightrun’s Dan Putman demonstrates the power of the latest Lightrun MCP skill. Watch how your AI code agent can now debug live applications directly in production. By connecting OpenAI's Codex to real-time runtime data via the Lightrun MCP, engineers can now generate and validate hypotheses using live telemetry and snapshots, without breaking flow. Ready to bring runtime context to your AI agents?
|
By Lightrun
In this video, Dan Putman, Solution Architect at Lightrun, walks you through the power of Lightrun AI SRE. He shows how it transforms automated incident response and platform reliability by correlating signals from Monitoring tools and Incident management systems with live runtime code execution to identify and verify root causes in real time.
|
By Lightrun
In this video, Lightrun's Moshe Sambol walks you through the power of Lightrun MCP and Runtime Context. A game-changer for AI-assisted development. This integration lets developers debug live issues, inspect real-world variables, and verify fixes across environments, all without leaving the IDE. With Lightrun MCP, you can: Capture live transaction state directly from Staging and Production. Identify root causes using real runtime values, not just static code. Verify fixes instantly without redeploying or context switching.
|
By Lightrun
Lightrun R&D Team Lead Or Galon and Engineer Roy Chen demo how you the new Lightrun MCP allows AI coding assistants to access Runtime Context, and validate how software will behave in production.
|
By Lightrun
Intermittent production bugs are hard to debug and rarely reproduce locally. Teams fall into a loop of adding logs, and every rollback slows them down. In this demo, R&D team leads Maor Yaffe and Or Golan show how an AI assistant can verify production issues using real runtime data, without redeploying. By connecting Cursor to Lightrun MCP, the agent inspects live production behavior, collects real variable values, and confirms the root cause with evidence instead of assumptions.
|
By Lightrun
We’re entering a new era of AI-accelerated software development. Teams that successfully integrate AI coding assistants into their daily workflows are already seeing significant productivity gains, while those that don’t risk falling behind.
|
By Lightrun
Introducing Runtime Context for AI agents The next evolution in autonomous software development. The Lightrun MCP connects IDEs and AI assistants to real runtime data, giving agents and developers the context they need to write, validate, and debug code with confidence. With Runtime Context, AI agents can: Reliable, AI-accelerated engineering starts here.
|
By Lightrun
This video showcases how with Lightrun developer observability platform, developers can leverage the AI debugger within the platform plugin to swiftly identify critical code level issues through automated hypothesis and insertion of debugging actions at runtime (Lightrun dynamic logs, virtual breakpoints (Snapshots) and more. That helps reduce MTTR to mere minutes.
|
By Lightrun
This datasheet details various specifications and requirements for installing and running Lightrun in production.
|
By Lightrun
As experienced cybersecurity engineers with strong cloud and SaaS backgrounds, the Lightrun team fully recognizes the importance of embedding security as part of the product design and delivery. This document provides a high-level overview of Lightrun's security model, architecture and primary controls. While there are no 100% bulletproof solutions, the Lightrun platform is designed with a significant investment in security from the ground up, as outlined in this document.
- April 2026 (6)
- March 2026 (6)
- February 2026 (4)
- January 2026 (5)
- December 2025 (3)
- November 2025 (1)
- October 2025 (1)
- March 2025 (3)
- February 2025 (1)
- January 2025 (3)
- December 2024 (2)
- November 2024 (3)
- October 2024 (1)
- August 2024 (1)
- July 2024 (3)
- June 2024 (1)
- May 2024 (3)
- April 2024 (1)
- March 2024 (1)
- February 2024 (2)
- January 2024 (3)
- December 2023 (1)
- October 2023 (7)
- September 2023 (2)
- August 2023 (2)
- July 2023 (4)
- June 2023 (4)
- May 2023 (8)
- April 2023 (5)
- March 2023 (3)
- February 2023 (3)
- January 2023 (2)
- December 2022 (11)
- November 2022 (1)
- October 2022 (1)
- September 2022 (3)
- August 2022 (3)
- July 2022 (5)
- June 2022 (9)
- May 2022 (6)
- April 2022 (5)
- March 2022 (7)
- February 2022 (4)
- January 2022 (1)
- December 2021 (1)
- November 2021 (2)
- October 2021 (2)
- September 2021 (3)
- August 2021 (6)
- July 2021 (5)
- June 2021 (4)
- May 2021 (3)
- April 2021 (6)
- March 2021 (2)
- February 2021 (1)
- January 2021 (3)
- December 2020 (2)
- June 2020 (2)
Lightrun is a Developer Native Observability Platform, enabling developers to securely add logs, performance metrics and traces to production and staging in real time, on demand.
Insert logs and metrics in real time even while the service is running. Debug monolith microservices, Kubernetes, Docker Swarm, ECS, Big Data workers, serverless, and more.
Developer-Native Observability Platform:
- Increase developer productivity: Spend less time debugging and more time coding. No more restarting, redeploying and reproducing when debugging.
- Enhance site reliability: Reduce MTTR and increase customer satisfaction. Identify and resolve bugs faster with less downtime.
- Resolve bugs faster: Add logs, snapshots, and metrics dynamically to your live app. Skip the traditional CI/CD pipelines.
- Debug in production, staging, anywhere: Lightrun does not interrupt running apps. Debug in any environment: production, staging, testing, dev, etc.
Save your valuable debugging time and keep your service reliable.


