Operations | Monitoring | ITSM | DevOps | Cloud
k8s-monitoring-helm Chart Office Hours (April 2026)
In the April edition of the Kubernetes Monitoring Helm chart office hours, we discuss updates to the version 4.0 release, the upcoming 4.1 feature release, and we discuss the upcoming deprecation of the 1.x and 2.0 versions.
Secure performance testing at scale: Introducing secrets management for Grafana Cloud k6
To simulate real user behavior, performance tests often rely on API keys, tokens, or credentials to interact with real systems. But as your testing suite grows, this sensitive data can start to sprawl across scripts, configs, and environments, increasing the risk of exposure and making tests harder to manage and maintain. To address this challenge, we’re rolling out secrets management for Grafana Cloud k6, the fully managed performance testing platform powered by k6 OSS.
Get observability in the terminal, for you and your agents, with the gcx CLI tool
The way you write code is changing, which means the way you observe your systems and respond to issues needs to change, too. Engineers today spend much of their day working via command line, as agentic tools like Cursor and Claude Code have become highly effective at handling many day-to-day engineering tasks. This greatly accelerates code generation, but it doesn't solve for the context switching that comes when you have to jump into another tool that's not part of this new, faster workflow.
Customize preconfigured views for AWS, Azure, and Google Cloud with Cloud Provider Observability in Grafana Cloud
Part of what makes Cloud Provider Observability in Grafana Cloud really useful is that it gives you prebuilt dashboards and drill-downs for AWS, Azure, and Google Cloud. Out of the box you get service overviews, instance-level views, and quick links to explore your data. However, you might already have dashboards you trust, want a view tailored to your team’s workflow, or need to change which panels show up when you drill into a single instance.
Grafana Assistant: Now Available in Self-Managed Environments
You can now access Grafana Assistant in self-managed environments! See why the feedback has been so strong.
k6 Script Authoring mode for Grafana Assistant
Here's Senior Software Engineer Vicente Ortega showcasing something he's built: the new k6 Script Authoring mode for Grafana Assistant.
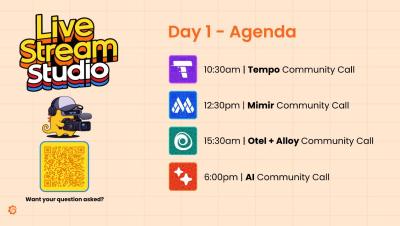
Alloy, OpenTelemetry & Instrumentation Community Call LIVE from GrafanaCON 2026
Join us live from GrafanaCON 2026 for the Alloy, OpenTelemetry & Instrumentation Community Call! We’re kicking things off with a look at everything happening across Alloy and the OpenTelemetry ecosystem, alongside special guests Ted Young, Mischa Thompson, and Liudmila Molkova. In this session: We take a look back at Alloy’s rapid growth and adoption Explore the introduction of the new OpenTelemetry Engine Dive into fleet management, instrumentation, and onboarding at scale.
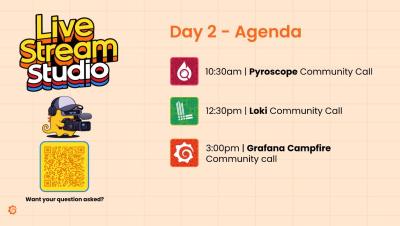
Loki Community Call LIVE from GrafanaCON 2026
Join us live from GrafanaCON 2026 for the Loki Community Call! We’re kicking things off with a look at everything happening in the Loki ecosystem, alongside special guests Poyzan Taneli, Ben Clive, and Trevor Whitney. In this session: We take a look back over the last year in Loki Explore the brand new “Thor” architecture Dive into what’s coming next for logging at scale From a completely new columnar storage format and Kafka-based ingestion, to a redesigned query engine and improved support for high-cardinality data—Loki is evolving to meet the demands of modern logging.
Pyroscope Community Call LIVE from GrafanaCON 2026
Join us live from GrafanaCON 2026 for the Pyroscope Community Call! We’re kicking things off with a look at everything happening in the Pyroscope ecosystem, alongside special guest Alberto Soto. In this session: We take a look back over the last year in Pyroscope What’s new in continuous profiling What’s coming next From multi-language source code integration and symbolization improvements to OpenTelemetry profiles and performance gains, Pyroscope has evolved rapidly over the past year.


