Operations | Monitoring | ITSM | DevOps | Cloud

Dashboards

Perses - A new language for dashboards?

One of the most interesting stories in the dashboarding space over the past year or so has been the emergence of the Perses project. This is an open source project which not only provides a platform for dashboard creation, but also sets itself the very ambitious target of defining a common standard for dashboards as code. As a SquaredUp user, you may be wondering why we might want to talk about a potentially competing technology. Well, obviously, being SquaredUp, dashboards are in our DNA.

The Importance of Reporting & Dashboards in Asset Management

In the evolving and changing business landscape that demands the management of assets, availing them in support to operational success is associated with immense basic asset management need. It is no longer around tracking and maintaining assets but is about providing organizations within actionable insights useful to optimize usage, reduce costs, and thus improve decision-making.

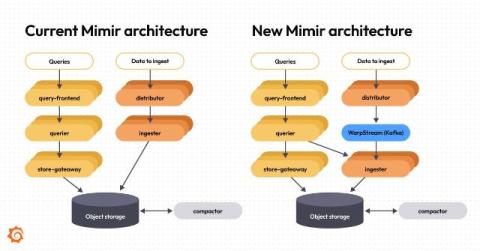
The next generation of Grafana Mimir: Inside Mimir's redesigned architecture for increased reliability

This year Grafana Mimir — the open source, horizontally scalable, multi-tenant time series database (TSDB) — will celebrate its third anniversary. Over the years, Mimir has become the go-to, Prometheus-compatible metrics backend within the open source community, with 29 maintainers and more than 4.6k GitHub stars. Since introducing Mimir, we’ve worked hard to deliver on our promise of making it the most scalable and performant open source TSDB in the world.

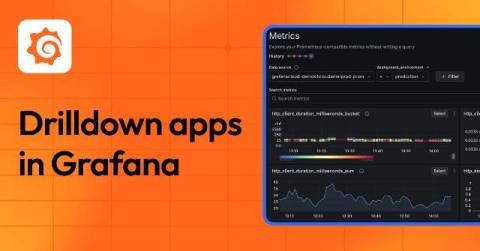
Grafana Drilldown apps: the improved queryless experience formerly known as the Explore apps

When we introduced the Explore apps suite for metrics, logs, traces, and profiles last year at ObservabilityCON 2024, our goal was simple: offer a queryless, point-and-click experience so you can quickly find insights in your observability data—no queries or complicated syntax required. Our commitment to that goal remains unchanged, but we’re excited to announce that the Explore apps have a new name: Grafana Drilldown.

Drilldown apps: An improved queryless experience for faster insights into your observability data

See how we're improving the apps to help you quickly get insights into your logs, metrics, traces, and profiles, and find out why we changed the name from Explore apps to Drilldown. Grafana Cloud is the easiest way to get started with Grafana dashboards, metrics, logs, and traces. Our forever-free tier includes access to 10k metrics, 50GB logs, 50GB traces and more. We also have plans for every use case.

Getting started with Postgres dashboards

In the last few years, Postgres has experienced a meteoric rise in popularity. A relational database that not long ago was relatively unknown outside of academic circles has now eclipsed MySql as the most popular database for developers in the most recent StackOverflow user survey. Why has it achieved such impressive popularity with developers?

Getting started with Snyk dashboards

If you are involved in software development you will probably be aware of the ever-growing menace of supply chain attacks. These are attempts by attackers to insert malicious code into code libraries which might be downloaded or referenced by developers. Many modern frameworks can install hundreds or even thousands of dependencies, so the potential attack surface can be huge. As well as code libraries, attackers can also attempt to conceal malware in sources such as Docker images or CDNs.

Grafana Cloud updates: Exemptions in Adaptive Logs, GPU monitoring in AI Observability, and more

We consistently roll out helpful updates and fun features in Grafana Cloud, our fully managed observability platform powered by the open source Grafana LGTM Stack (Loki for logs, Grafana for visualization, Tempo for traces, and Mimir for metrics). In case you missed them, here’s our monthly round-up (the first of 2025!) of the latest and greatest Grafana Cloud updates. You can also read about all the features we add to Grafana Cloud in our What’s New in Grafana Cloud documentation.

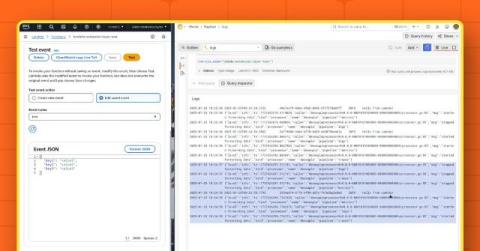
How to observe AWS Lambda functions using the OpenTelemetry Collector and Grafana Cloud

Getting telemetry data out of modern applications is very straightforward—or at least it should be. You set up a collector that either receives data from your application or asks it to provide an up-to-date state of various counters. This happens every minute or so, and if it’s a second late or early, no one really bats an eye. But what if the application isn’t around for long? What if every second waiting for the data to be collected is billed?

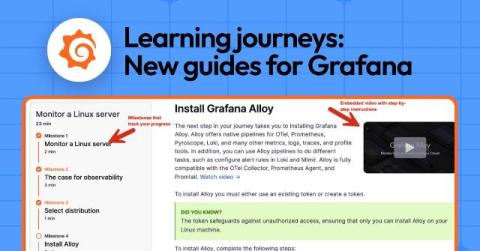
Introducing Learning journeys: New step-by-step guides to get started with Grafana

Our Big Tent philosophy provides the foundation for our broad, modular, and flexible observability platform. With Grafana’s powerful ability to integrate with a wide range of data sources, tools, and plugins, you can create customized solutions tailored to your unique needs.