Operations | Monitoring | ITSM | DevOps | Cloud

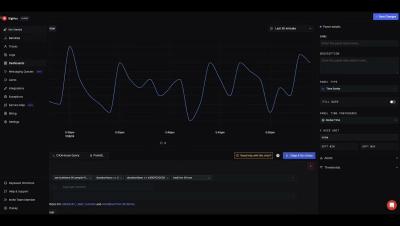
Grafana dashboards are now powered by Scenes: big changes, same UI

Though you might not immediately notice it the next time you log in, Grafana’s frontend has undergone a major upgrade. We recently migrated our dashboard architecture to utilize the Grafana Scenes library, enabling the creation of more stable, dynamic, and flexible Scenes-powered dashboards. Yes, the UI is pretty much the same, but under the hood, the engine responsible for visualizing the dashboards used by millions of people around the world has largely been rewritten.

Fixing Long Animation Frames (LoAF)

You’ve found some Long Animation Frames (LoAFs) impacting your site, now you need to fix them! LoAFs can make animations feel sluggish, delay user interactions, and generally reduce your site’s responsiveness, all of which contribute to a frustrating experience for users. Fortunately, by analyzing LoAF data and addressing common performance bottlenecks, you can dramatically improve how smoothly your site runs.

How to Balance Load in Kafka for Improved Performance

Keeping a Kafka cluster optimized can feel like a balancing act. Every piece—brokers, partitions, producers, and consumers—has to work in harmony, or you’ll start running into bottlenecks. To get Kafka to run smoothly and handle growing traffic loads, balancing load across the system is key. Let’s go over practical load-balancing techniques that can improve Kafka performance, keep everything running efficiently, and prevent data slowdowns from building up.

Streamline internal communication with status pages

Outages are unexpected events that can suddenly stop an organization's operations. Whether it's a network issue, a key application going down, or a system crash, these problems can cause confusion and disrupt work. Teams scramble to identify the problem, while employees are left in the dark, uncertain about the impact or duration of the issue. A lack of real-time communication can lead to frustrated employees, delayed responses, and prolonged recovery times.

Boost Operational Consistency with DX NetOps

For today’s network operations teams, change is a constant. Applications, app delivery chains, software-defined and physical infrastructures, cloud services, and more are in continuous flux. Further, as organizations continue to pursue ever more strategic digital transformation efforts, the pace of this change only accelerates. These days, about the only constant is the demand being placed on network operations teams.

Progress WhatsUp Gold 360 - Internet Connection Monitoring for Each of Your Remote Sites

It’s a story many network administrators dread: leaving the office on a Friday afternoon with everything running smoothly, only to return Monday morning to a nightmare of system-wide failure. If you’re a network administrator, you know the quiet comfort in logging off on Friday, satisfied that all servers are operational, backups are complete and the network is running efficiently. It’s the moment when you finally let out a sigh of relief, looking forward to a stress-free weekend.

Best practices for monitoring cloud costs with Datadog Scorecards

To ensure that your organization’s cloud spend is efficient, you need detailed and granular visibility to understand what comprises your costs, what causes them to change, and how the cloud services and resources you use are enabling your business goals. Extending your visibility and more closely monitoring your cloud costs can position you to successfully adopt FinOps, which provides a framework that can help you maximize the value you get from your cloud spend.

Detect issues, manage incidents, and streamline workflows with Datadog's Microsoft Teams integration

Microsoft Teams is deeply embedded in many organizations’ workflows, acting as a hub to both communicate and collect information about issues and ongoing projects. However, as with most communication platforms, it can be challenging to context-switch between conversations, tickets, and monitoring data when troubleshooting collaboratively.

The Difference Between SLA, SLO, and SLI Service Quality Metrics

SLA vs SLO vs SLI, what’s the difference anyway? Workplace success relies on clear expectations to help leaders and employees thrive together. As such, the partnership between customer and provider requires the same clarity to maintain service satisfaction. This is why Service Level Agreements (SLAs), Service Level Objectives (SLOs), and Service Level Indicators (SLIs) exist in the first place.

Tracealyzer Tips and Tricks

There have been significant improvements in Tracealyzer over the last years. If you haven’t tried it in a while—or if you’re just getting started—here are some tips and tricks that can be handy when analyzing your FreeRTOS applications. As you may know, the TraceRecorder library automatically records task scheduling and FreeRTOS API calls using the standard trace hooks in the FreeRTOS kernel.

Unveiling the Hidden Costs of Failed Network Monitoring

We increasingly depend on ethernets, servers, wireless routers, and other network infrastructures. People are attached at the hip to glowing, rectangular screens in their pockets. We use these devices for entertainment, shopping, directions, communication, and getting the new. More importantly, for businesses, we log online to get work done.

Teams Phone Trouble? Who You Gonna Call?

In most organizations when there’s an issue with Microsoft Teams Phone, “who you gonna call” is corporate IT. But Teams Phone brings unique challenges to troubleshooting and managing the user experience that IT isn’t necessarily equipped to face. A few key tools and capabilities can make all the difference.

Web Performance Experts Look into the Future of Web Performance

Last month, web performance experts from leading brands joined an exclusive session with the Catchpoint product team to explore new features and future enhancements in WebPageTest and Catchpoint Internet Performance Monitoring (IPM). This post shares highlights from that session.

Beginners guide - Visualizing Canvas in Grafana | Grafana Labs

In this video, Grafana Developer Advocate Leandro Melendez describes how Canvas panels combine the power of Grafana with the flexibility of custom elements. They are extensible visualizations that allow you to add and arrange elements wherever you want within unstructured static and dynamic layouts. This lets you design custom visualizations and overlay data in ways that aren’t possible with standard Grafana visualizations, all within the Grafana UI.

Differentiating Sumo Logic Mo Copilot using Amazon Bedrock

Sumo Logic Mo Copilot is a natural language assistant that helps first responders derive insights from logs and resolve issues faster using contextual suggestions and plain English queries. It has been in preview since May 2024 with dozens of customers. Choosing a foundation model was a critical step in its development. Let’s explore our high-level requirements for Copilot, the role of foundation models and the rationale for standardizing on Amazon Bedrock.

SquaredUp Live 2024: A round-up of our virtual customer workshop

Last week, we were very excited to host our second virtual customer workshop! We’d received so much positive feedback on last year’s debut that we knew we had to do it again. Using the digital conferencing app Gather Town, we were pleased to welcome 89 attendees from 13 different countries to our virtual “SquaredUp Town”.

Implementing Clean Architecture in Next.js

In this workshop you’ll get a deep dive into Clean Architecture and answer the questions: What is Clean Architecture? What problems does it solve? How to implement Clean Architecture in Next.js? You will also learn how to use Sentry to instrument your backend and see how you can use the Trace View to identify performance issues in your application.

Organizing your devices is a no-brainer with OpManager's smart grouping

An organized inventory for monitoring using ManageEngine OpManager is essential for resolving network issues and optimizing performance. Configuring and updating monitoring settings is easier and more efficient when devices and interfaces are organized into subgroups and supergroups. For instance, say you’re monitoring 500 or more devices.

Application Performance Issues - Causes & Solutions | Sentry

Application performance is critical for a seamless user experience, but all too often, developers find themselves struggling to pinpoint slowdowns. Understanding the root cause is the first step to diagnosing and solving performance issues. In this article, we’ll explore six common root causes of application performance slowdowns and share actionable advice on how to fix them. We will also show how platforms like Sentry can help uncover, trace, and debug these issues faster.

What is OCI monitoring and why is it essential?

Oracle Cloud Infrastructure (OCI) is a powerful, comprehensive cloud platform that supports a wide range of enterprise workloads. Whether you're running complex databases, applications, or large-scale analytics, OCI offers the infrastructure to handle it all. But as with any robust cloud environment, effective monitoring is crucial to ensure performance, security, and cost-efficiency.

Leveraging monitoring to build scalable data pipeline with Amazon Kinesis

In today's data-driven world, businesses need to collect, process, and analyze large volumes of data in real-time to make informed decisions. Amazon Kinesis, a powerful streaming platform, helps companies build scalable and resilient data pipelines. However, ensuring that the pipeline functions efficiently requires robust monitoring practices.

Relational Fields: Query Even More Relationships in Your Traces

Earlier this year, we introduced relational fields. Relational fields enable you to query spans based on their relationship to one other within a trace, rather than only in isolation. We’ve now expanded this feature and introduced four new prefixes: child., none., any2., and any3.. Previously, you could use root., parent., and any. to query on the root span of your target span’s trace, the parent span of your target span, and any other span in the same trace as your target span.

Code Reviews - How do they work?

We at Icinga / NETWAYS (yes, that’s the order) held an internal event recently. It’s name was Knowledge Days and I got to to talk about how I review code. Now, I will share my knowledge with you! Though, this is specifically how I personally perform reviews. This is by no means the definitive way of doing it! Find your own, I can only share my experience. So without further ado…

Why You Need a Multi-Region Deployment Strategy for Availability

Availability and reliability are crucial for modern software applications and digital services. Meeting service requirements and avoiding downtimes promote customer satisfaction, trust, and credibility. A multi-region deployment strategy can help. Systems that are not reliable or available when needed can cause lost revenue and business, unplanned maintenance, and decreased productivity. Companies can lose up to $9,000 per minute during service downtime.

What is network bandwidth?

Network bandwidth is the maximum rate at which data can be transmitted over a network connection in a given time. Essentially, it’s the highway for your data. Bandwidth is often measured in bits per second (bps), but in larger systems, you’ll see measurements like megabits per second (Mbps) or gigabits per second (Gbps). Bandwidth plays a critical role in IT infrastructure because it determines how quickly data can move.

Big Data, Zero Hassle: Cribl Edge for Centralized Agent Management

Today’s IT and security environments have gone from “big” to “massive” in just a decade or two—endpoints have practically exploded (think hundreds of thousands of servers, not just a hundred). Add in a dizzying array of data types and vendors, and what do you get? A whole lot of chaos. So why, oh why, does agent management still feel like it’s stuck in the early 2000s?

The Top 3 Surprising Results from Our State of the MSP Market Survey

OpsRamp, a Hewlett Packard Enterprise company, updated its state of the MSP market survey for the first time in two years with some surprising results. The survey was the largest of its kind with more than 600 participants across three geographic regions and 24 countries.

10 Best Zabbix Alternatives for Infrastructure Monitoring in 2024

Infrastructure monitoring has evolved into a critical component of modern distributed systems, driving organizations to explore robust Zabbix alternatives. While Zabbix has served as a cornerstone of traditional monitoring, today's microservices and cloud-native architectures demand different approaches. The landscape of Zabbix alternatives has matured considerably, offering specialized solutions for various monitoring scenarios.

Grafana variables: what they are and how they create dynamic dashboards

A common pattern when building Grafana dashboards is to represent data for many items at once, such as simultaneously monitoring hundreds of servers. But what if there’s a problem with one of those servers? You’d want the ability to quickly identify that single server, and drill into the details without noise from all the other systems. In Grafana, dashboard variables are a great way to filter data and focus on the information that’s most important to you.

Fine-Tuning Kafka Producers and Consumers for Maximum Efficiency

Keeping Kafka running at peak efficiency takes more than just a smooth setup. Fine-tuning Kafka producers and consumers is key to making sure every message is processed quickly and accurately. A little tweaking here and there can help you avoid bottlenecks, increase throughput, and keep your whole data pipeline running smoothly. In this guide, we’ll dive into practical tips for configuring producers and consumers for maximum efficiency.

Anodot recognized as a Visionary in the 2024 Gartner Magic Quadrant for Cloud Financial Management Tools Report

The cloud financial landscape is expanding with more vendors for companies to choose from to maintain healthy cloud costs. As the market grows, it’s important to partner with a third-party cloud financial management tool built on FinOps innovation and consistently adapt to meet future customer needs. A credible source recommending the right cloud cost tool can help you make an informed choice that positively impacts your cloud cost optimization.

DORA Metrics in perspective

A friend of mine once had an annual appraisal where his manager blithely declared to him that his target for the next year was "to exceed his targets". Rather than spend the next year screaming silently whilst trapped inside an MC Esher-esque cycle of infinite recursion, my friend politely demurred and requested a more achievable goal, such as building a time machine out of jellybeans.

Advanced Open edX Monitoring with AppSignal for Python

In the first part of this series, we explored how AppSignal can significantly enhance the robustness of Open edX platforms. We saw the challenges that Open edX faces as it scales and how AppSignal's features — including real-time performance monitoring and automated error tracking — provide essential tools for DevOps teams. Our walkthrough covered the initial setup and integration of AppSignal with Open edX, highlighting the immediate benefits of this powerful observability framework.

Optimize Database Performance in Ruby on Rails and ActiveRecord

In Rails, we're more likely to use SQL databases than other frameworks. Unlike NoSQL databases, which can be scaled horizontally with relative ease, SQL databases like PostgreSQL or MySQL are much less amenable to easy scaling. As a result, our database usually becomes the primary bottleneck as our business grows. Although SQL databases are very efficient, as our growing customer base puts an increasing load on our servers, we begin scaling our instance counts, workers, etc.

Digital Workspace Sustainability: Tracking Carbon and Energy Consumption for IT Sustainability Goals

As the world moves towards sustainability, IT operations and digital workspaces are becoming critical in achieving corporate sustainability goals. The digital transformation of businesses—especially in light of hybrid and remote working models—has increased the demand for IT infrastructure, which in turn raises concerns about energy consumption, carbon emissions, and environmental impact.

Reduce alert noise and resolve incidents faster with ignio Event and Incident Management

Eliminate noise, gain actionable insights, and remediate issues before they impact your business Are you struggling with huge volumes of events and alert noise in your IT Operations? Most enterprises today face challenges in maintaining operational IT resilience and ensuring continuous service availability due to the sheer volume of IT events coming for different monitoring and observability tools.

Catchpoint Network Monitoring

Discover how Internet Performance Monitoring (IPM) is essential for staying ahead in today’s fast-evolving digital landscape. Traditional tools like SNMP, telemetry, and Netflow are no longer enough—your business needs visibility across networks, applications, and user experiences. This video breaks down the challenges IT teams face and explains how IPM empowers you to monitor critical connections from every user’s location—whether it's internal employees, customers, APIs, or IoT devices.

Complement Your Monitoring: Making Logs Readable for Humans & Machines

‍ While Scout provides powerful monitoring tools (try it now!) mastering logging is an awesome complement to these skills. In this post, we’ll see how to create readable, actionable logs for both humans and machines. You’ll improve your logging strategy, drastically reduce troubleshooting time, and put yourself in the best possible position for maximum observability. As a starting example, let’s take this error log.

Run tests & fix bugs with the Sentry for GitHub Copilot Extension

TL;DR: The Sentry extension for GitHub Copilot now goes beyond chat to help you generate tests, surface issues, and suggests fixes all within your regular PR workflow. Did you forget to write unit tests? Automatically generate them and merge them to your feature branch within GitHub. Have you already merged a PR? Catch new issues, get solutions to those bugs, and deploy those fixes quickly. Add the Sentry extension from the GitHub Marketplace to get started. Continue reading for more details and demos.

Introducing the Logz.io AI Agent, Accelerating the Future of Observability

Logz.io introduces its AI Agent in Beta, using GenAI to revolutionize observability. The AI Agent simplifies monitoring with automated data analysis and root cause detection, accelerating issue resolution by 3-5x for beta users—marking a critical step toward fully autonomous observability.

Observability vs. monitoring vs. telemetry: Uncovering the secrets to proactive IT management

In the world of modern IT operations, keeping your systems running smoothly requires measures beyond just basic monitoring. As infrastructures become more complex and dynamic, understanding how telemetry, monitoring, and observability work together is essential. These three concepts may seem similar, but each plays a distinct role in maintaining system health and performance.

System Tables Part 1: Introduction and Best Practices

As an InfluxDB Cloud Dedicated or Clustered user, you may want to inspect your cluster to gain a better understanding of the size of your databases, tables, partitions, and compaction status. InfluxDB stores this essential metadata in system tables (described in Section 1), which help inform decisions about cluster performance and maintenance.

Driving Multi-Region Observability Excellence at Lansweeper

Since its inception in 2004, Lansweeper has been at the forefront of helping businesses understand, manage, and protect their IT devices and networks through a powerful IT asset management platform. As the platform grew from an on-premises solution to a cloud-based SaaS offering, Lansweeper expanded its reach to a global, multi-region customer base.

What's new in .NET 9: Two new LINQ methods

.NET 9 is releasing in mid-November 2024. Like every.NET version, this introduces several important features and enhancements aligning developers with an ever-changing development ecosystem. In this blog series, I will explore critical updates in different areas of.NET. In this post, I'll look at two new LINQ methods: CountBy and AggregateBy.

From stateful to stateless: Sumo Logic's transition from Lucene to Parquet-based architecture

Ensuring scalability, performance, and cost-effectiveness is a constant challenge for cloud-native log management and observability. At Sumo Logic, we faced this challenge head-on by transitioning from a stateful, Lucene-based architecture to a completely stateless, Parquet-based architecture. This transformation lets us improve data storage efficiency, streamline operational complexity, and meet the demands of an ever-increasing data scale.

Consolidation and Modernization in Enterprise Observability

Organizations are seeing measurable benefits from investing in observability, including faster issue resolution, cost reduction, and improved business outcomes. However, challenges still remain, including rising costs, tool fragmentation, and the need for more comprehensive monitoring of internet dependencies and user experience. Let’s explore these challenges and the best practices organizations are adopting to address them.

Edit your Git-based Grafana dashboards locally

Grafana has grown to become one of the most prominent dashboarding tools available, with an extensive set of features that support organizations of all sizes. There can come a time, however, when you have too many dashboards. As a software engineer, you might think, “Why can’t I do with dashboards what I do with my code?” That is, you know how to keep your code in version control (e.g., Git). You know how to share and review your code with colleagues (e.g., pull requests).

Optimizing Application Performance with Contextualized Metric, Log & Trace Data

Every organization relies on mission-critical applications and services that ultimately generate revenue, so the user experience has never been more important. Companies trust their developer and operations (DevOps) teams to ensure important applications run smoothly. DevOps teams, in turn, trust application performance optimization tools to quickly identify and resolve issues or avoid them altogether in the first place.

WordPress vs. WP Engine: Protect Your Sites

Recently, a public dispute erupted between WordPress and WP Engine, one of the most popular managed WordPress hosting platforms. The disagreement centers around WP Engine’s use of the WordPress brand, licensing concerns, and differing views on managing the open-source platform. This fallout could impact WP Engine customers especially those who rely heavily on WordPress for their sites.

This Month in Datadog: Google Gemini integration, Unified Error Tracking, and more

Datadog is constantly elevating the approach to cloud monitoring and security. This Month in Datadog updates you on our newest product features, announcements, resources, and events. To learn more about Datadog and start a free 14-day trial, visit Cloud Monitoring as a Service | Datadog. This month, we put the Spotlight on Datadog LLM Observability’s native integration with Google Gemini.

How Appfolio uses Datadog LLM Observability to deliver exceptional GenAI experiences

Learn how Appfolio is delivering positive customer experiences in real estate with generative AI — supported and safeguarded by Datadog’s LLM Observability. See how you can use Datadog LLM Observability to monitor, troubleshoot, improve, and secure your LLM applications.

ScienceLogic Wins TrustRadius's 2025 Buyer's Choice Award

At ScienceLogic, we’re dedicated to leveraging innovation to enhance customer satisfaction. Our mission is to transform the complexity of IT operations into a streamlined and straightforward workflow, empowering our customers to focus on what matters most. We’re thrilled to see this commitment recognized with the 2025 TrustRadius “Buyer’s Choice” Award (formerly the “Best of” Awards), a distinction we previously received in 2022 and 2023.

How OpUtils helps enhance network security and connectivity in the BFSI sector

The BFSI sector’s rapid digital transformation has revolutionized customer experiences, allowing for convenient and efficient transactions. However, this increased reliance on technology has also made these institutions prime targets for cybercriminals. The threat of cyberattacks on financial infrastructures is evident without the need for graphs or complex statistics to illustrate it; the growing frequency and sophistication of these attacks speak for themselves.
Sponsored Post

The silent engine: Driving SAP excellence with precision and insight

SAP is often seen as the sleek, powerful race car, capturing attention and driving business forward. But just as in motorsports, success isn't solely about the car on the track. It's about the sophisticated technology and dedicated teams working behind the scenes to ensure peak performance, reliability and efficiency.

Visualize GitHub repos, projects, and more: get started with the GitHub data source for Grafana

In 2020, we introduced the GitHub data source plugin for Grafana, helping organizations visualize and gain deeper insights into their use of the popular version control and collaboration platform. Since then, thousands of users have installed the data source, and we’ve been working hard to extend its capabilities and make it even easier to use.

How OnlineOrNot more than halved its AWS bill

Chances are, you've heard one of the main promises of serverless compute: "you only pay for what you use". While convenient when starting a new project, once you start to get continuous usage on that compute, you start to realize you're paying a hefty premium for that convenience. If you're using AWS Lambda like I am, chances are that "for what you use" part isn't completely true either.

Transform and enrich your logs at query time with Calculated Fields

As the number of distinct sources generating logs across systems and applications grows, teams face the challenge of normalizing log data at scale. This challenge can manifest when you’re simply looking to leverage logs “off-the-shelf” for investigations, dashboards, or reports–especially when you don’t control the content and structure of certain logs (like those collected from third-party applications and platforms).

Tame Your Telemetry: Introducing the Honeycomb Telemetry Pipeline

Observability means you know what’s happening in your software systems, because they tell you. They tell you with telemetry: data emitted just for the people developing and operating the software. You already have telemetry–every log is a data point about something that happened. Structured logs or trace spans are even better, containing many pieces of data correlated in the same record. But you want to start from what you have, then improve it as you improve the software.

Supercharge Your Incident Response With The New Rootly and IsDown Integration

Dealing with disruptions from third-party providers can really disrupt your business operations. As our IT infrastructures become more complex, managing these outages can be quite a headache. If you're a site reliability engineer (SRE) looking for a smoother way to handle these incidents, you'll want to check out the new Rootly and IsDown integration. Rootly is an incident management system that seriously speeds up business response times.

The Benefits and Challenges of Using AI for Competitive Intelligence Monitoring

In today’s fast-paced and competitive markets, staying ahead isn’t just a luxury—it’s a necessity. However, keeping tabs on every move your competitors make can be overwhelming. This is where competitive intelligence (CI) plays a crucial role. CI involves tracking your competitors’ strategies, pricing models, and trends to gain insights that allow you to make informed business decisions.

Azure Function and APIM: The Ultimate Tool for Business Data Tracking

The Business Activity Monitoring (BAM) module is designed to shift support “left,” meaning it empowers support operators to identify and address issues earlier in the process by providing them with a business-friendly view of the underlying complex infrastructure. This makes it easier for operators to understand and manage critical processes without needing to have expert skills in the technical complexities of Azure.

Threat Hunting with Cribl Search

Imagine you’re the protector of a castle. Your walls are tall, the gates are strong, and the guards are well-trained. But what if an intruder was still able to slip past your defenses? Even with the best security tools, not every threat will be caught. Threat hunting is the proactive approach to finding attackers that might have bypassed your defenses.

Best Practices for Tuning MQ Systems in Mainframe Environments

In mainframe environments, where workloads are high and demands on reliability are even higher, tuning MQ systems isn’t just beneficial—it’s essential. When MQ systems are optimized, your organization can maintain faster, more reliable message processing, handle greater transaction volumes, and ultimately keep up with today’s demands. But how do you go about tuning MQ for optimal performance? Let’s break down some best practices that will make a real difference.

Learn the Anatomy of a Grafana Plugin | Grafana Plugin Development

Learn about the anatomy of a Grafana plugin in this video where we'll dive deep into the various frontend and backend components involved when creating your own plugin. We'll look at the individual components for each plugin type, as well as explain how the plugin project files are organised, so that you're fully equipped to make your own awesome plugins.

Debugging a Django Application

Debugging Django applications can be challenging, but it’s key to keeping your app running smoothly in production. From unexpected bugs to performance slowdowns, finding and fixing issues efficiently keeps users happy and reduces downtime. For example, when an error occurs on a critical page, like a checkout page, identifying the issue quickly is crucial to avoid disrupting user transactions.

The Path to Autonomous Observability

Autonomous observability for system monitoring and management aims to use GenAI and machine learning to automatically detect, diagnose and resolve issues. In conversations about cloud observability today, discussions often shift from “what’s possible” to “what’s practical.” Too often, these conversations highlight the shortcomings of current observability processes, tools and financial models.

Enhancing Log Analysis with Machine Learning (ML)

Log Analysis has been a beneficial practice for organizations for numerous years, and over these years it has continuously evolved. This has been in part driven by the increasing volume of logs that companies are required to monitor. Now, log analysis is shifting again, incorporating machine learning (ML) and artificial intelligence (AI) to assist data analysts in identifying system log patterns and anomalies.

The Complete Guide to Log Parsing

One of the most important steps in log management is parsing of the log files, which turns unstructured data into understandable information. Logs are broken down by pre-established parsing rules, making monitoring and operating system performance easier and facilitating real-time problem-solving of the event logs. A Data Breach Investigations Report emphasizes the critical role of human error in cybersecurity, noting that it is a factor in 74% of all breaches.

MaaS: How to Store and Analyze Real-Time Stock Trading Data Using Next.js and InfluxDB

Next.js is one of the most popular open source web frameworks for hosting web applications; however, performance monitoring of such applications, until now, has been a mystery. Whether you’re hosting Next.js apps yourself or via third party services like Vercel, it’s always helpful to know how the application is performing to make it more efficient and deliver a pleasant user experience.

The Importance of Monitoring for Gaming Companies

For gaming companies, creating a positive user experience is paramount. Gamers expect seamless gameplay, fast response times, and 24/7 availability. Maintaining top-notch performance is crucial when managing massive multiplayer online games, mobile games, or e-sports platforms. This blog will explain how gaming companies rely on monitoring and explore many widespread monitoring use cases for gaming companies.

Introducing dashboard folders

One of the most common challenges our users face is navigating a growing number of dashboards as their SquaredUp usage increases. That's where dashboard folders come in! We’ve designed dashboard folders to help our users stay organized, even in large and complex environments. Here are some ways we think dashboard folders can improve your dashboard organization and navigation.

Unveiling Innovation - Digitate's Flamingo Release

Join Rahul Kelkar, Chief Product Officer, and Avi Bhagtani, Chief Marketing Officer of Digitate, as they unveil Digitate’s latest ignio Flamingo release. This significant advancement underscores our commitment to empowering autonomous enterprises through enhanced capabilities, closed-loop automation, and AI-driven solutions. In this video, discover how our cutting-edge generative AI features address real IT challenges by enabling proactive problem-solving, automating responses to recurring issues, and generating intelligent insights for informed decision-making.

October '24 BindPlane Update

I'm covering our powerful new feature: the coalesce processor in BindPlane! I’ll walk you through how to use it to simplify your telemetry data by merging mismatched field names—like user and username—into one unified field (usr). We’ll configure a BindPlane Gateway, capture telemetry from various sources, and route it all to Honeycomb and S3. With the coalesce processor, field names get standardized quickly, making your dashboards and alerts far more intuitive.

Progress WhatsUp Gold Emerges as a Leader in the IT Infrastructure Monitoring Sector in the SPARK Matrix Report

Progress WhatsUp Gold has consistently proven to be an innovative solution in the IT infrastructure monitoring sector. Recently, it emerged as an infrastructure monitoring leader in the prestigious Quadrant Knowledge Solutions’ SPARK Matrix. The SPARX Matrix recognizes products demonstrating exceptional performance, innovation and customer satisfaction through specified criteria.

How to scale observability for AWS hybrid and multi-cloud environments

Managing observability across hybrid and multi-cloud environments is like flying a fleet of planes, each with different routes, altitudes, and destinations. You’re not just piloting a single aircraft; you’re coordinating across multiple clouds, on-premises systems, and services while ensuring performance, availability, and cost-efficiency. AWS customers, in particular, face challenges with workloads spanning multiple regions, data centers, and cloud providers.

Catchpoint named a leader in the 2024 Gartner Magic Quadrant for Digital Experience Monitoring

We're honored to announce that Catchpoint has been named a Leader in Gartner's first-ever Magic Quadrant for Digital Experience Monitoring (DEM). We believe this recognition reflects the rapid pace of innovation of our Internet Performance Monitoring (IPM) platform.

Browser testing in Grafana Cloud k6: how to optimize frontend web performance

Modern websites typically have a backend API and a frontend user interface. Testing both is essential to deliver a reliable user experience and optimize engagement. Historically, Grafana Cloud k6 has helped you check one of these boxes, allowing you to test your website’s backend APIs with protocol tests. Now, we are excited to share that you can also validate your website’s frontend performance with the new browser testing feature in Grafana Cloud k6.

Debugging Kubernetes pod pending failures

Every pod has its purpose. During an application deployment, all the workloads in the cluster work cohesively and ensure that the deployment launches—without any hiccups. When a pod is created, it starts its lifetime in a Pending state. A pod is in the Pending state when it is still in the process of being scheduled for deployment. When it is scheduled for deployment and the containers have started, it converts to the Running phase. It only takes a few seconds for the phase transition.

Scaling Culture on Purpose: How Cribl is Building for the Future After Our Series E

Cribl’s recent $319M Series E round marks a significant milestone in our journey to becoming a generational company. While this growth opens the door to new opportunities for our company, it also presents a challenge: how do we ensure our amazing culture scales alongside the business? At Cribl, we believe in Culture on Purpose—an intentional, values-led approach to evolving our culture as we grow.

Optimizing Kubernetes workloads with AI-powered monitoring

Kubernetes has drastically simplified application deployment. However, managing workloads in Kubernetes is a challenge because of their innate complexity and dynamism. Frequent bottlenecks and unpredictable application behavior can make managing Kubernetes workloads much harder. This has become simpler and lighter after the expansion of AI, which provides a more intelligent approach to managing and optimizing Kubernetes environments.

"Check Now" for instant status updates

We’ve just rolled out a new Check Now feature for Website and Ping monitors! This lets you manually check the current status of your monitor instantly, right from the admin board. Whether you’re monitoring a Website or using a Ping monitor, this option provides the most up-to-date status when you need it. To access the Check Now feature, simply go to your Monitors page, find the Website or Ping monitor you’d like to check, and click the three dots icon next to it.

Understanding Jaeger - From Basics to Advanced Distributed Tracing

Jaeger has emerged as a crucial tool in the modern distributed systems landscape, offering powerful tracing capabilities that help organizations understand and optimize their microservices architectures. This comprehensive guide explores everything from basic concepts to advanced implementations, providing you with the knowledge needed to effectively implement and utilize Jaeger in your environment.

Datadog named a Leader in first ever 2024 Gartner Magic Quadrant for Digital Experience Monitoring

We are thrilled to announce that Datadog has been named a Leader in the first ever 2024 Gartner Magic Quadrant for Digital Experience Monitoring. Datadog was positioned the highest in its Ability to Execute. We believe this placement reflects our commitment to being an end-to-end observability platform that brings together all signals from across your tech stack into a unified ecosystem.

Trace your applications end to end with Datadog and OpenTelemetry

As teams adopt OpenTelemetry (OTel) to instrument their systems in a vendor-neutral way, they often face a challenge in effectively tracing activity throughout their entire stack, from frontend user interactions to backend services and databases. While OTel enables basic tracing, teams still need a way to access advanced capabilities like continuous profiling to adequately optimize performance and troubleshoot issues in their applications.

Kafka Security Auditing: Tools and Techniques

Let’s face it—when it comes to security in Kafka, you can’t afford to mess around. With more and more sensitive data streaming through Kafka environments, it’s no surprise that Kafka security auditing has become a crucial part of ensuring both compliance and overall security. But if you’re new to this or feel like your current process needs a tune-up, don’t worry—we’ve got your back.

Comprehensive Observability: Key User Experience Metrics to Monitor in Cloud Environments

As we conclude our three-part series on key observability metrics ScienceLogic monitors, this blog focuses on the analysis and impact of user experience (UX) metrics to shed light on their business impact. Whether it’s an internal business application or a customer-facing platform, a seamless and efficient user experience can significantly impact satisfaction, productivity, and loyalty.

How observability, AI and automation is leading the workload management evolution

Workload management is ubiquitous when it comes to automating critical business processes. With time, workload management as a technology is going through a gradual evolution, from ‘just automation’ to an orchestrator of intelligent automation. This necessitates a layer of observability and intelligence to facilitate the move from workload automation to workload management.

Why you need Apica for Intelligent Data Management

In today’s complex and dynamic digital landscape, observability has become a cornerstone for organizations seeking to understand, manage, and optimize their applications and infrastructure. As the volume and complexity of data continue to grow, customers are demanding observability platforms that can deliver comprehensive insights, scalability, and cost-effectiveness.

How VirtualMetric significantly reduces SIEM ingest costs

Ever wondered how you can massively reduce SIEM data ingestion costs? In this video, Yusuf walks you through how VirtualMetric makes it happen. We’ve found a way to reduce SIEM ingestion costs by up to 90% using smart data pipelines, real-time data processing, and 99% compression rate for long term storage. If you’re dealing with large amounts of log data and looking for a way to save on costs while improving your cybersecurity operations, this might be what you need!

Grouping in OpManager is simpler and smarter now!

With the new smart grouping feature, OpManager can automatically detect and group devices with matching custom fields. Post discovery, OpManager detects devices with identical custom fields and prompts you whether they should be added as groups, when you enable this, these devices are automatically upgraded as groups. Furthermore, you can now specify custom fields and group names while importing devices from CSV files, this reduces the time required to discover, classify, and organize large networks.

Grafana 11.3 release: Scenes-powered dashboards, visualization and panel updates, and more

Roll out the red carpet! Grafana 11.3 is here and marks the general availability of Scenes-powered dashboards, which set the foundation for what we envision the future of Grafana dashboards will be. But the current state of Grafana dashboards looks pretty awesome as well. The dashboard experience has improved, including the ability to trigger API calls from any canvas element with the new Actions option across many visualizations.

RabbitMQ vs Kafka: Which Is Right for You?

For distributed systems and microservices, message brokers play a very important role. Message brokers keep data flowing smoothly between different parts of our applications. Two names that often come up in discussions about message brokers are RabbitMQ and Kafka. But what exactly are they, and how do they differ?

The Ultimate List of Incident Management Tools in 2024

Incident management tools are important for organizations to effectively handle service outages. With so many incident management tools around with different feature sets, it's often difficult to find the one that is right for your needs. In this article, we attempt to make a list of incident management software available in 2024 with their features to help you arrive at the right one.

12 Benefits You Get by Scaling with Netdata

80% of decision-makers globally acknowledge that digital infrastructure is essential for reaching business goals. However, IT infrastructure is becoming increasingly distributed and complex. Organizations are managing hundreds—even thousands—of nodes across cloud, on-premise, and edge environments. This predicament makes effective monitoring across all systems more essential than ever.

Determining a CoPE's Efficacy-and Everything After

As discussed in the first article in this series, a Center of Production Excellence (CoPE) is a more or less formal, provisional subsystem within an organization. Its purpose is to act from within to change that organization so that it’s more capable of achieving production excellence. The series has, to date, focused mainly on how best to construct such a subsystem and what activities it should pursue.

Infrastructure Monitoring Checklist: What you should monitor

You want to monitor your infrastructure? Monitoring is essential to ensure system stability, security and optimal performance. Without proper monitoring, small issues can quickly escalate into major problems and affect productivity and service availability. While there is no fixed checklist for infrastructure monitoring and it depends on your setup, there are some key areas that are worth considering when building your own monitoring strategy that fits the needs of your own environment.

AWS X-Ray vs Jaeger - Choosing the Right Distributed Tracing Tool

Distributed tracing has become an essential part of any application's performance monitoring strategy. As businesses adopt distributed architectures, choosing the right tracing tool is crucial for efficient troubleshooting and performance monitoring. The two most prominent choices are AWS X-Ray and Jaeger, each offering unique features and advantages. AWS X-Ray, a managed service by Amazon, simplifies tracing for applications running on AWS.

Key Metrics to Monitor for a Healthy Kafka Cluster

Maintaining a healthy Kafka cluster is critical to ensuring your real-time data pipelines run smoothly. However, keeping your Kafka environment in tip-top shape isn’t just about setting it up and letting it run. Regular monitoring of key metrics is essential to catch issues before they escalate, optimize performance, and keep everything humming along smoothly. So, what should we be looking at when it comes to Kafka metrics? Let’s break down the most important ones and how to interpret them.

Beyond Their Intended Scope: Uzing into Russia

The first installment of our new blog series, Beyond Their Intended Scope, covers BGP mishaps that may have escaped the community’s attention but are worthy of analysis. In this post, we review a recent BGP leak that redirected internet traffic through Russia and Central Asia as a result of a path error leak by Uztelecom, the incumbent service provider of Uzbekistan.

Flaky tests: their hidden costs and how to address flaky behavior

Flaky tests are bad—this is a fact implicitly understood by developers, platform and DevOps engineers, and SREs alike. When tests flake (i.e., generate conflicting results across test runs, without any changes to the code or test), they can arbitrarily fail builds, requiring developers to re-run the test or the full pipeline. This process can take hours—especially for large or monolithic repositories—and slow down the software delivery cycle.

Why Quality Matters: A Conversation with NDepend

In this episode of Founder & Friends, John-Daniel Trask, co-founder and CEO of Raygun, sits down with Patrick Smacchia, Founder and CEO of NDepend, to share their stories and strategies for building excellent software. They discuss the intricacies of the.NET ecosystem, strategies for sustaining high-quality software, and the evolution of development tools. Gain insights into NDepend's methods for managing dependencies, refining code, and optimizing performance. This episode is essential for developers aspiring to advance their technical abilities and produce superior software.

Set Up Links Between Data Sources With the New Correlations Feature | Demo | Grafana 11.3

Correlations is a feature that allows Grafana users to set up links between their data sources. Previously, the link generated would only be from one query to another—meaning results from a query could only generate links to open a second Explore pane with other query results. With this feature, users can now link to third party web-based software based on their search results. The format follows the standard Grafana format for using variables. This is generally available in all editions of Grafana.

Query Language Not Required! Explore Apps Suite Demo (Logs, Metrics, Traces, Profiles) | Grafana

This talk dives into making observability more accessible with Grafana’s Explore apps suite. This new experience, which includes eliminates the need to write queries as you visualize and explore your data. Explore Metrics and Explore Logs (both GA), simplify navigating Prometheus and Loki data with an intuitive UI, eliminating the need to write queries in PromQL or LogQL. They come with improvements like better related metrics recommendations, OpenTelemetry logging support, and enhanced pattern detection.

Website content checks are now multi-region!

We’ve made an upgrade to the “Check for Content” feature in our website monitors! Previously, users could select just one location at a time from US West, US East, EU West, and AU East via radio buttons. Now you can monitor your content from multiple locations instead of just one. By choosing multiple regions you can ensure that transient network issues don’t cause your monitor to go down unexpectedly.

What IS CIDR? Everything You Need to Know About This IP Addressing Method

Managing IP addresses is essential in the operation and security of modern computer networks. However, the original IP addressing system based on address classes A, B, and C was extremely inefficient in allocating addresses. Many addresses were wasted, rapidly depleting the available IPv4 space. To address this pressing issue, Classless Inter-Domain Routing (CIDR) was introduced in 1993. So, if you’re wondering what is CIDR, read on to learn everything you need to know.

Azure VM Recommendations: A Comprehensive Guide

Microsoft Azure offers a wide range of Virtual Machines (VMs) to suit various use cases, making it a flexible platform for organizations of all sizes. However, choosing the right VM for your workload can be challenging, especially with Azure’s continuously expanding portfolio. This blog aims to provide detailed Azure VM recommendations to help optimize your cost, performance, and operational efficiency.

Top 3 DNS Monitoring Tools for Reliable Uptime and Performance

DNS or the Domain Name System is critical for the function of online services like websites, and SaaS applications. The importance of DNS is highlighted by its functions. It allows computers on the Internet to find resources in a secure manner. It achieves this by using text files known as DNS records. Whenever someone hosts a website on a domain, they need to create and publish the DNS records of that domain.

Ensuring Performance and Resilience for Critical Applications Becomes Much Easier with AppAssure from Catchpoint

AppAssure offers IT teams a simple, rapid and affordable solution that monitors the entire internet stack, enhancing uptime and user experience with a complete view of everything that impacts an application.
Sponsored Post

Innovative Approaches to Ransomware Protection with NetApp Monitoring

Analysis of innovative approaches to ransomware protection using NetApp monitoring tools, with a focus on how these tools enhance data security, ensure system integrity, and provide real-time threat detection and response. This includes examining the integration of advanced security features within NetApp's monitoring framework, leveraging AI-driven analytics to identify and mitigate ransomware threats, and exploring the role of automated responses in safeguarding critical data assets.

CloudFabrix Unveils Cutting-Edge Innovations at GenAI Summit 2024

At the GenAI Summit in San Francisco, from May 28th to 31st, CloudFabrix proudly showcased the latest advancements of its Macaw GenAI Assistant and its Robotic Data Automation Fabric (RDAF) platform. These technologies are not only reshaping the future of IT operations and observability but also setting the stage for the company’s next chapter as a member of the NVIDIA Inception Program.

Maximizing cloud efficiency with CloudSpend's Resource Inventory report

CloudSpend Resource Inventory As organizations increasingly rely on the cloud to support business operations, cloud cost management of resources becomes vital for cost control, resource optimization, and effective governance. A clear view of your entire cloud infrastructure is essential to avoid unnecessary spending and improve operational efficiency. CloudSpend’s Resource Inventory report provides a detailed analysis of all the cloud resources within any business. Let us dive into this below.

Reduce Observability Costs with OpenTelemetry Setup

Maintaining and visualizing telemetry data efficiently is super important for DevOps and SecOps teams. OpenTelemetry, a fantastic open-source observability framework, can really help with this without being too costly. Picture having a simple process that improves your data and helps your team make smart decisions without spending too much money. Let's chat about some budget-friendly ways to set up OpenTelemetry agents.

Exploring C# 11 Features: What's New and How to Use It

C# has been a popular programming language for many years now. It continuously evolves to include new features and adopt recent trends. Its flexibility makes it a language ideal for many different domains and platforms like desktop applications, enterprise systems, web development, games, cross-platform, and native mobile applications. Back when Microsoft launched.NET 7, this also included a new version of C# with version number 11.

Monitoring Azure AKS & Azure Linux with VictoriaMetrics

Azure linux is a Linux distribution built for Microsoft’s cloud infrastructure. It can be used as a base OS when creating node pools in Azure Kubernetes Service (AKS) clusters. Using Azure linux as a base OS for AKS node pools has several benefits, such as lower resources footprint, faster boot times, and better security.

Request Metrics and Perforator - Combining RUM and Load Testing

Your website’s performance can make or break your business. Slow load times, crashes under pressure, and a poor user experience can cost you customers, reduce your search engine rankings, and hurt your bottom line. That’s why monitoring and testing your site’s performance is critical—but not all performance monitoring is the same. At Request Metrics, we focus on Real User Monitoring (RUM), which shows you how real users are experiencing your website in real-time.

Monitor your Azure OpenAI applications with Datadog LLM Observability

Azure OpenAI Service is Microsoft’s fully managed platform for deploying generative AI services powered by OpenAI. Azure OpenAI Service provides access to models including GPT-4o, GPT-4o mini, GPT-4 Turbo with Vision, DALLE-3, and the Embeddings model series, alongside the enterprise security, governance, and infrastructure capabilities of Azure.

Grafana 11.3 Now GA! Here's the TL;DR | Grafana

Welcome to Grafana 11.3! Scenes-powered dashboards are now generally available and the Explore Logs plugin is now installed by default. The dashboard experience has also improved in other ways including the ability to trigger API calls from any canvas element with the new Actions option and an update to transformations so you can apply calculations to dynamic fields. We’ve also simplified the alert setup experience, added customizable announcement banners that admins can send to all users, and improved some default permissions.

How to Identify & Troubleshoot ISP Internet Issues | Obkio NPM Use Cases Series

In this video, we’ll be showing you how to use Obkio to troubleshoot an Internet issue on the Internet Service Provider’s end. With Obkio, monitoring and troubleshooting Internet performance is incredibly simple. You can get started in just 10 minutes using our intuitive onboarding wizard, which guides you through a quick setup.

Crawl, Walk, Run: Implementing AI and Generative AI on Your Journey to Autonomic IT

As IT environments continue to expand in scope and complexity, understanding their impact on organizations is more important than ever. That’s why ScienceLogic commissioned research specialist Vanson Bourne to survey 400 IT operations professionals across the USA, UK, Germany, and Canada with the goal of understanding the challenges they’re facing and the technologies—including automation, AI, and generative AI—they’re using to overcome them.

State of Observability 2024 Reveals How Leaders Outpace Their Peers

In 2024, simply having an observability practice is a given. In this era of observability, a high-functioning team will set leaders apart from their peers. Leading observability practitioners don’t fix issues by putting hundreds of people into a virtual room, or frantically messaging in a temporary Slack channel to find root causes. Because leaders embed observability into their development practices early, a feature launch is a quiet non-event.

Entra ID Security Monitoring

The whitepaper delves into how effective monitoring of identity access and authentication can enhance security, improve compliance, and mitigate potential threats. By examining key metrics, best practices, and real-time monitoring strategies, this whitepaper demonstrates how Microsoft Entra ID monitoring can proactively safeguard IT infrastructures, detect suspicious activity, and streamline access management for hybrid environments.

Best Practices for Mainframe Modernization with MQ Infrastructure

Mainframe systems may be the workhorses of many enterprises, but let’s face it, modernization is long overdue for most organizations. With decades-old infrastructure running mission-critical workloads, updating these systems isn’t just about keeping up with the times—it’s about ensuring that your business remains agile, competitive, and efficient. And a big part of this journey? MQ infrastructure. They form the backbone of communication between mainframes and newer technologies.

The role of AI in Kubernetes monitoring

In a dynamic environment like Kubernetes, where manual tracking is impossible, AI-powered monitoring tools, such as Site24x7, surf through enormous amounts of data, detecting irregularities, predicting vulnerabilities, and alerting the user about a possible outage that is about to happen if the resource is not handled.

The Role of External Service Monitoring in SRE Practices

Modern businesses rely on a variety of external services to support their operations, including APIs, cloud platforms, CDNs, payment gateways, and more. Whether it's pulling data from an external API, using a cloud service for storage, or integrating a third-party tool for analytics, these services help achieve many business objectives. Given their criticality, it’s important to have a reliable mechanism for monitoring external services.

Generate metrics from your high-volume logs with Datadog Observability Pipelines

Logs are a rich source of information, providing you with the minute details you need to troubleshoot a specific issue or perform extensive historical analysis. But with billions of logs being generated from your infrastructure every day, it isn’t practical to sift through them all to derive actionable insights. Firewall, CDN, network activity, and load balancer logs are especially high volume, requiring storage solutions that can be expensive and difficult to scale.

Accelerate Visibility and Analysis With New Cribl Search Packs

Our new Cribl Search Packs give you a framework for packaging, sharing, and installing config bundles that align with a given data source or use case. Similar in concept to our original Cribl Stream Packs framework, Cribl Search Packs help users find value in their datasets more quickly across common use cases. In fact, Stream Pack users were a powerful driver in the development of Search Packs.

Debugging Kubernetes Autoscaling with Honeycomb Log Analytics

Let’s be real, we’ve never been huge fans of conventional unstructured logs at Honeycomb. From the very start, we’ve emitted from our own codestructured wide events and distributed traces with well-formed schemas. Fortunately (because it avoids reinventing the wheel) and unfortunately (because it doesn’t adhere to our standards for observability) for us, not all the software we run is written by us.

Objectively Gauging User Experience with Apdex and AppNeta

In today’s digital environments, slow is the new down. As users continue to grow increasingly accustomed to rapid response—and less willing to wait—slow application performance continues to be highly problematic for organizations. While downtime of major services can make headlines, it is more often slow performance that hurts businesses, ultimately stifling productivity and profits.

Mastering Enterprise Network Complexity with Advanced Visualization Techniques

The landscape of enterprise networking has undergone tremendous change in recent years. Widespread adoption of software-defined networking (SDN), the proliferation of multi-cloud environments, the rise of edge computing, and the implementation of zero-trust security models have collectively reshaped network architectures. While these trends bring unprecedented flexibility and scalability, they have also exponentially increased complexity.

Monitoring and Troubleshooting Nerdio

Today I’ll give a brief overview on monitoring and troubleshooting Nerdio, a.NET application, popular with MSPs (Managed Service Providers) and enterprises using Microsoft Azure Virtual Desktop (AVD). Nerdio is a cloud-based application used by administrators to automate the deployment and management of virtual desktops in Azure.

Monitor your generative AI app with the AI Observability solution in Grafana Cloud

Generative AI has emerged as a powerful force for synthesizing new content—text, images, even music—with astounding proficiency. However, monitoring, optimizing, and maintaining the health of these complex AI systems is challenging, and traditional observability tools are struggling to keep pace. At Grafana Labs, we believe that every data point tells a story, and every story needs a capable narrator.

Top 7 Dynatrace Competitors and Alternatives In 2024

Application Performance Monitoring (APM) tools play a critical role in ensuring seamless user experiences for businesses. While Dynatrace has established itself as a leader in this field, there exists a range of alternative solutions in the market that may align more closely with the specific needs of your organization. This comprehensive guide delves into the diverse competitors of Dynatrace, offering valuable insights to empower you in making a well-considered choice when procuring an APM solution.

Master debugging with four ways to visualize your traces

In a world where microservices rule and distributed architectures are the norm, understanding how a single request flows through your system can be an overwhelming challenge. But don’t worry—there’s light at the end of the tunnel! And not just one light, but four.

BT Ireland Reduced Alarm Noise with DX NetOps: Here's How

For today’s enterprises, there’s no good time for network downtime. In this post, we detail how DX NetOps by Broadcom provides advanced capabilities that help teams minimize outage incidents and duration. We then offer an example of how these capabilities benefited a leading telecommunications provider in the UK, fueling an 80% reduction in alarm noise and a 40% decrease in mean time to resolution.

Comprehensive Guide to Dotcom-Monitor's DNS Monitoring Solution

In today’s digital world, a business’s online success relies heavily on a strong infrastructure. At the heart of that infrastructure is DNS (Domain Name System). Without DNS, the internet as we know it simply wouldn’t work.. Given its vital role, any issue with DNS can lead to serious problems for a business. Things like website downtime, sluggish performance, or even security breaches are just a few of the risks that arise when DNS servers fail.

Gaining End-to-End Network Observability in a Multi-Cloud World

In a relatively short period of time, networks have grown much bigger, much more complex, and much more critical to the ongoing operation of the business. Quite simply, while ensuring optimized network services has never been more critical, it’s also never been more difficult. In many large enterprises, network operations teams are seeing tens of thousands of endpoints added to already complex internal environments.

The Rising Role of Slack in Incident Management

Why is Slack becoming so popular in incident management? Slack is one of the most popular communication tools used in companies. If you're part of a remote team, your team is probably on Slack or something similar like MS Teams. Although IM tools lack the communication nuances that are taken for granted in face to face interactions, they provide many other advantages.
Sponsored Post

How to Detect Threats to AI Systems with MITRE ATLAS Framework

Cyber threats against AI systems are on the rise, and today's AI developers need a robust approach to securing AI applications that address the unique vulnerabilities and attack patterns associated with AI systems and ML models deployed in production environments. In this blog, we're taking a closer look at two specific tools that AI developers can use to help detect cyber threats against AI systems.
Sponsored Post

Telemetry Pipelines: Elevate Your Data Workflow with CloudFabrix

In an era where digital infrastructures are increasingly hybrid, the ability to efficiently monitor, analyze, and act on vast amounts of operational data is a significant challenge. According to Gartner, the surge in data volumes, with some workloads producing petabytes of telemetry annually, has led to heightened complexity and soaring costs—potentially exceeding $10 million annually for large enterprises.

How to Optimize MPLS Network Monitoring to Improve Performance and SLAs

In the IT infrastructure serving increasingly digitized enterprises, the criticality of network quality of service is more than evident to ensure connectivity to everyone at any time. System and network administrators need to understand which technology enables efficient, reliable, and lowest latency data transmission between IT applications and services.

Laptops, Desktops, and Data-Oh My! Cribl Edge Has You Covered

As organizations continue to become more reliant on distributed and hybrid workforces, the need for comprehensive data collection across every endpoint—servers, applications, desktops, and laptops—has never been more critical. But let’s be real: agents can be a total headache. That’s where Cribl Edge comes in, now with support for desktops and laptops (in preview)!

Effortless Data Compliance with Cribl Lake

Organizations generate, collect, and store vast amounts of telemetry data. With this data comes the growing responsibility to ensure compliance with various regulations, from GDPR to HIPPA. Data compliance ensures data is handled, stored, and processed according to laws and standards protecting personal information. But what makes compliance regulations scary is that it’s ever-changing and rules vary across industries, making it complex to manage.

AIOps monitoring: Definition, uses, and features

AIOps monitoring is a proactive process that uses AI to anticipate and identify IT infrastructure issues. Going beyond traditional troubleshooting, it enables your systems to detect anomalies in advance to prevent potential disruptions. AIOps uses advanced technology like AI and machine learning to simplify IT operations. AIOps monitoring collects and analyzes large data sets from diverse sources, such as logs, metrics, and events.

Email Round-Trip Monitoring Use Cases

Email round-trip monitoring is a powerful tool that tracks the full journey of an email from when it is sent to when it is successfully received. This comprehensive monitoring provides real-time insights into the performance and reliability of email systems, helping to identify issues that could affect uptime, deliverability, and overall communication efficiency.

NiCE IT Management Solutions | Transforming IT Performance with Innovative Solutions

Discover NiCE in just under 5 minutes! Learn how we solve key challenges and deliver innovative solutions that drive success. Our video highlights who we are, what we do, and how we help businesses thrive. Watch now to see how NiCE can transform your IT performance and operations with cutting-edge solutions tailored to your needs.

What is Enterprise DORA Metrics (in 2 minutes)

Seeing snippets of DORA Metrics across all of your products doesn't give you the big picture. Imagine if you had 50 products and you're stitching metrics together to make a conclusion of how well the organization is performing as a whole. That's inefficient, inaccurate and a time consuming task that doesn't give leadership the real-time view it needs to make quick decisions. Introducing something you've never seen before: Real-Time Enterprise DORA Metrics.

How Ecommerce Businesses Monitor Web Traffic

Businesses in many industries turn to MetricFire for one goal: to quickly set up hosted monitoring with an expert team. Developers everywhere ask, "Will setting up a monitoring solution with a free trial be worth my time?" How can you find the right monitoring solution for your use case? This article will review some common monitoring use cases for online retail and ecommerce businesses. If any part of this article rings true for your business, click here to contact us.

Hear how PayPal is accelerating their pace of innovation with Datadog

With over 426 million active users, comprised of consumers and merchants, Paypal processes approximately 25 billion transactions valued at around $1.53 trillion USD. Paypal is shaping the future of commerce for millions of customers globally, and to do that, they use Datadog to provide timely insights into their entire stack.

What is log analysis? Overview and best practices

In today’s complex IT environments, logs are the unsung heroes of infrastructure management. They hold a wealth of information that can mean the difference between reactive firefighting and proactive performance tuning. Log analysis is a process in modern IT and security environments that involves collecting, processing, and interpreting log information generated by computer systems. These systems include the various applications and devices on a business network.

Leveraging AI for Predictive Analytics in Observability

Predictive analytics has become a key goal in observability. If teams can foresee potential system failures, performance bottlenecks, or resource constraints before they happen, they can act preemptively to mitigate issues. AI holds the promise of making this possible. In this post, we explore how AI can push observability toward predictive analytics, the industry’s current hurdles, and practical use cases for leveraging AI today.

Networking Basics: OSPF Protocol Explained

Open Shortest Path First (OSPF) is a standard routing protocol that’s been used the world over for many years. Supported by practically every routing vendor, as well as the open source community, OSPF is one of the few protocols in the IT industry you can count on being available just about anywhere you might need it. Enterprise networks that outgrow a single site will often use OSPF to interconnect their campuses and wide area networks (WANs).

Digitate's Flamingo release advances AI and unified observability to power the autonomous enterprise

Digitate announces the general availability of ignio™ Flamingo, featuring a robust suite of AI-driven capabilities across its award-winning products and solutions to further the vision of an autonomous enterprise.

Getting transparency on hidden Azure Function Integrations

Recently we released a new feature for Business Activity Monitoring and one of our customers was able to get almost immediate value from this feature with an integration use case they were struggling to support. The solution implemented involves the source data coming from various operational technology systems that push data to an event hub.

The 2024 Guide to Open Source Status Page Providers

Maintaining transparent communication about service availability is crucial for businesses of all sizes. Status pages are an important part of your communication strategy during times of outages and maintenance events. You can choose to go with a fully managed status page provider, or host an open-source one yourself. Open source status page providers offer a cost-effective and customizable solution. However, then can come with their own drawbacks.

What are Long Animation Frames (LoAF)

A Long Animation Frame, often called a LoAF, occurs when your website’s animations take too long to render, slowing down interactions and making your site feel “frozen” or “janky.” And yes, it’s hilarious that it sounds like a loaf of bread—so get ready for plenty of bread, butter, and toasting puns! You might be thinking, “I’m building an online store (or whatever), what do I care about animations? I’m not talking about cartoons.

What are SLOs/SLIs/SLAs?

You’ve likely noticed how some pizza places promise delivery in 30 minutes, or they’ll give you your money back. But what are they really promising? They’re setting a clear performance goal and backing it up with confidence. How do they measure their performance? They track how long each delivery takes. And why do they make this promise? Because fast service is key to keeping their business thriving.

Top 10 Kafka Configuration Tweaks for Better Performance

Kafka is great for handling data at scale, but to get the most out of it, you need to do a little fine-tuning. Think of it like having a high-performance car—yeah, it runs out of the box, but a few tweaks under the hood can really make it fly. Whether you’re looking to boost throughput, reduce lag, or just keep things humming smoothly, these Kafka configuration tweaks are your go-to guide for better performance. Ready to get hands-on?

In & outside business hour notifications

Developers, marketing teams and business owners rely on Oh Dear to monitor their entire website and applications. We offer a feature-packed, all-in-one service with simple pricing - designed specifically for your peace of mind. Oh Dear already has a flexible and powerful notification system and to date has performed over 38 billion checks and sent over 19 million notifications across Email, Slack, MS Teams, PagerDuty, webhook and more.

Guide to Error & Exception Handling in React

No app is perfect. Even if we try our best to test all possible cases, sometimes things will go wrong. It only takes one failing request to get you in trouble. It’s how we handle it that makes the difference between an application crash and a graceful fail. In this article, we’ll cover the basics of error and exception handling in React apps. We’ll also explore different kinds of errors and best practices for recovering from them in a user-friendly way.

How to quickly configure Grafana Cloud Application Observability with Open Telemetry Operator

Monitoring application health is a lot like monitoring your personal health. Vital signs such as heart rate, blood pressure, and overall well-being can spot problems before they escalate, helping us maintain good health. Similarly, application health requires constant monitoring of performance indicators like CPU usage, memory consumption, and application response times.

Stronger together: Sumo Logic and AWS partnership expands with five new competencies

For over a decade, we’ve worked closely with AWS to help our joint customers ensure the health and security of their mission-critical applications. That’s why we’re so excited to have recently renewed our Strategic Collaboration Agreement (SCA) with AWS and to announce five new AWS competencies across multiple industries.

How to Configure the OpenTelemetry Operator With Your Kubernetes Cluster | Tutorial | Grafana

In this video, Grafana Labs Staff Solutions Engineer Lionel Marks describes how to configure the OpenTelemetry Operator along with your Kubernetes cluster to automatically inject, configure, and package auto-instrumentation components that you can then monitor in Grafana Cloud Application Observability.

What's New at Catchpoint! Fall 2024 Product Launch Event

Watch our semi-annual launch event hosted by Matt Izzo, CPO, and Howard Beader, VP Product Marketing - with a live demo from Bob Ruggiero, Director of Solutions Engineering. We share details of our Internet Performance Monitoring (IPM) platform strategy, enabling you to monitor what matters from where it matters to get to the answers faster, and highlight our new capabilities around.

Identifying performance bottlenecks in complex applications

Performance bottlenecks can sneak in and slow everything to a crawl regardless of how advanced your application is. These hidden culprits can turn a seamless user experience into a frustrating one. In this blog, we’ll uncover the most common bottlenecks that drag down complex applications and share proven strategies to identify and resolve them. By the end, you'll have the tools to keep your application running at top speed, regardless of the workload.

How to Use FastAPI [Detailed Python Guide]

FastAPI Python combines modern Python features with high-performance web development capabilities. This framework stands out for its speed, ease of use, and built-in support for asynchronous programming. Whether you're building APIs, microservices, or full-stack applications, FastAPI offers tools to streamline your development process.

How to Dig Deeper on the Network When You Don't Have NetFlow

Bro, I ain’t got flow isn’t only heard at your local hip hop mic night. It’s a gripe from many network administrators who have inherited small environments, networks with lower-end gear, or who are in the trenches dealing with a time-sensitive issue and need to dig deep—now. NetFlow is a Layer 3 protocol that, over time, allows administrators to see how much traffic is being generated, by whom, and where that traffic is going.

Introducing SNMP Poller History

Despite everyone’s best efforts, network failures happen. And when downtime means lost productivity, fast troubleshooting becomes an integral part of IT operations. So with the addition of SNMP poller history, Auvik providing users an archive for troubleshooting, analysis, and planning. When it comes to managing network issues, diagnosing the root cause is the first step. And often, there’s a gap between when an incident occurs, and when it’s reported. And herein lies a big problem.

Network Time Synchronization: Why and How It Works

When something goes wrong, you need to look through your log messages and figure out important things like which device saw the problem first. This automatically tells you where to start looking for the root cause. If your clocks aren’t synchronized, it becomes much more difficult to correlate log messages between devices. More generally, you want to know if the similar log messages you’re seeing are related to the same incident or if maybe some of them happened much earlier or later.

How to control time zones and timeouts in Playwright

Join Stefan Judis (Playwright Ambassador) as we explore advanced testing strategies for time zones and timers using Playwright. You'll learn about seamless time zone testing techniques and how to use Playwright's Clock API to manage timers effectively. What we'll cover: Time Zone Testing: Learn how to test across multiple time zones with Playwright to ensure your applications perform consistently worldwide. JavaScript Timers: Discover how to control and test JavaScript timeouts using the Clock API, enhancing the reliability of your scripts.

Unifying Security and Data Recovery for More Seamless and Robust Cyber Defenses

Cybercriminals are constantly looking for ways to bypass defenses. You need to plan for when attackers will breach your defenses. When attackers exploit a vulnerability, you need a solution that quickly detects activities, mitigates attacks, expels attackers and enables recovery from any damage caused. It’s becoming increasingly clear that having a unified approach to data security is essential.

How can you simplify web performance monitoring with auto RUM injection

Real user monitoring (RUM) is a powerful tool for optimizing the end-user experiences of web applications. With insights into performance, load times, user behavior, and more, RUM enables businesses to identify and address issues that negatively impact user satisfaction. Consider a scenario where a growing e-commerce company experiences periodic slowdowns during peak hours, adversely affecting user experiences and sales.

Cisco uses Elastic to save 5,000 support engineer hours a month

With the precision of search and the intelligence of AI, Cisco uses Elastic on Google Cloud to create richer search experiences, so support engineers can quickly find the answers they need. Scaling from this success, Cisco's Search team added AI models, semantic search, and vector search to more than 50 internal- and external-facing apps, helping them innovate more quickly and increase overall operational efficiency.

Introducing UptimeRobot's Core Monitoring Infrastructure Upgrade: What's Changing And What it Means For You

At UptimeRobot, we’re always evolving to serve you better—while understanding that change can sometimes be inconvenient. We’re excited to announce a major infrastructure upgrade designed to boost performance, scalability, and reliability. This upgrade will help us deliver faster, more reliable service as we grow, and we hope you’ll see the benefits soon.

Unlock the Real Value of Logs With Honeycomb Telemetry Pipeline and Honeycomb for Log Analytics

At Honeycomb, we know how important it is for organizations to have a unified observability platform. This is why we’re launching Honeycomb Telemetry Pipeline and Honeycomb for Log Analytics: to enable engineering teams to send and analyze data—including logs—into a single, unified platform. For too long, teams have had to wrangle large volumes of logs, their context scattered across multiple teams and tools, leading to knowledge silos.

Troubleshooting Kafka Clusters: Common Problems and Solutions

Apache Kafka’s thing is real-time data streaming. But keeping it running at full throttle? That takes more than just spinning up a cluster and hoping for the best. As your environment grows, you’ll need to do some tweaking to make sure Kafka keeps up with the pace. The good news? You don’t need to be a Kafka wizard to make a real difference. Even some basic tuning can have a big impact on performance.

Error 502 Bad Gateway in Nginx: What It Is and How to Fix It

A 502 Bad Gateway error implies that the server (Nginx) can’t properly communicate with the upstream web application server. A sign of more severe problems, such as server overload, improper configuration, or network failure, a 502 Bad Gateway error can cause service interruption, which can translate to revenue loss. Fortunately, you can easily resolve the error in Nginx once you identify the causes.

Azure Logic Apps Consumption: The Ultimate Tool for Business Data Tracking

In the latest release of Turbo360, significant improvements have been made to the Business Activity Monitoring (BAM) module. This module is designed to shift support “left,” meaning it empowers support operators to identify and address issues earlier in the process by providing them with a business-friendly view of the underlying complex infrastructure.

What Are Network Alerts? Alert Management Guide

It’s the middle of the workday and suddenly your IT team starts receiving calls: systems are slow, applications are unresponsive, and productivity grinds to a halt. Before you know it, you’re scrambling to pinpoint the issue and juggling complaints, all while the clock is ticking and downtime costs are piling up. The problem?

3 Minor Network Alerts You Shouldn't Ignore

When you put Auvik on a network for the first time, the software automatically starts monitoring that network for more than 40 potential issues. When Auvik finds an issue, it triggers an alert. Network alerts range in severity from emergency at the top all the way down to informational. As you work with Auvik, you may see a lot of alerts coming your way. It’s obvious you need to deal with the emergency and critical network alerts. But what about the simple warnings and informational alerts?

How I Strategically Tune Auvik Alerts to Reduce Noise and Optimize Monitoring

One of Auvik’s best and most popular features is its alerting capabilities. It allows my MSP—5K Technical Services—to automate device metric tracking, allowing us to monitor the status of our clients’ networks remotely. This is a huge boost in efficiency. However, right after deploying Auvik on a new client site, the volume of alerts can be a bit overwhelming. Auvik is pre-configured to alert on a list of standard metrics at industry best-practice thresholds.

Grafana Cloud updates: k6 browser checks in Synthetic Monitoring, an easier way to share dashboards, and more

We consistently roll out helpful updates and fun features in Grafana Cloud, our fully managed observability platform powered by the open source Grafana LGTM Stack (Loki for logs, Grafana for visualization, Tempo for traces, and Mimir for metrics). In case you missed it, here’s a roundup of the latest and greatest updates for Grafana Cloud this month. You can also read about all the features we add to Grafana Cloud in our What’s New in Grafana Cloud documentation.

What are networks?

Today, our days are seamlessly intertwined with various technologies. A regular day might see us conducting data searches on the internet, indulging in informative videos, sharing files with teammates, or engaging in video conferences across time zones. But amidst this flurry of digital activity, have we paused to consider what happens behind the scenes, orchestrating our online experiences?

How Generative AI Is Revolutionizing Debugging

In the rapidly evolving landscape of software development, the integration of generative AI has become a game-changer for organizations striving to deliver high-quality software at scale. Among its many transformative applications, autonomous debugging stands out as a critical advancement, offering the potential to revolutionize the way development teams tackle errors and maintain operational efficiency.

The Leading Java Performance Monitoring Tools

Java is a flexible and commonly used programming language known for its platform independence, object-oriented design, and robustness. It was originally developed by Sun Microsystems (now owned by Oracle Corporation) in the mid-1990s and soon gained popularity due to its "Write Once, Run Anywhere" (WORA) principle, allowing developers to write code that can operate on any device or platform with a Java Virtual Machine (JVM).

Enhanced Web Metrics: A Deeper Dive into Website Performance

At AppNeta we talk a lot about network performance, but sometimes a user experience issue lies with the application itself. As network operations teams rarely have full visibility into the applications that drive the business, getting metrics to isolate when the app is the problem is crucial to ensure low mean time to repair (MTTR) and reduce mean time to innocence (MTTI). When it is an app issue, understanding how your web application performs is crucial for ensuring a positive user experience.

Getting Started with Bytewax and InfluxDB

In this tutorial, we’ll explore how Bytewax can seamlessly integrate with InfluxDB to tackle a common challenge: downsampling. Whether you’re dealing with IoT data, DevOps monitoring, or any time series metrics, downsampling (or materialized views) is your key to managing your time series data for long-term storage without losing essential trends. Bytewax is an open source Python framework for building highly scalable dataflows to process any data stream.

Getting Started with Kafka, Telegraf, and InfluxDB v3

In the world of smart gardening, keeping track of environmental conditions like humidity, temperature, wind, and soil moisture is key to ensuring your plants thrive. But how do you bring all this data together in an efficient and scalable way? Enter the powerful trio of Kafka, Telegraf, and InfluxDB Cloud v3.

Visualize Atlassian Statuspage, Cloudflare, and Netlify data: what's new in Grafana Enterprise data source plugins

As part of our big tent philosophy here at Grafana Labs, we believe you should be able to access and derive meaningful insights from your data, regardless of where that data lives. One of the ways we stay true to that philosophy is through our Enterprise data sources.

Azure Cost Management Per Department: Optimizing Cloud Spending using Turbo360

Cloud adoption is growing rapidly, and businesses are increasingly using platforms like Azure to run their services. However, managing costs efficiently is crucial to prevent overspending. By tracking costs per department, you ensure that each team is accountable for its cloud spending, making optimization and budgeting more effective. In this article, we’ll explore how to track and allocate Azure costs per department, ensuring your organization optimizes its cloud budget.

What's new in .NET 9: Cryptography improvements

.NET 9 is releasing in mid-November 2024. Like every.NET version, this introduces several important features and enhancements aligning developers with an ever-changing development ecosystem. In this blog series, I will explore critical updates in different areas of.NET. For today's post, I'll present some improvements to Cryptography.

Introducing pipe syntax in BigQuery and Cloud Logging

Writing complex SQL queries can be challenging, but BigQuery's new pipe syntax offers a more intuitive way to structure your code. Learn how pipe syntax simplifies both exploratory analysis and complex log analytics tasks, helping you gain insights faster. Watch along and discover how to leverage pipe syntax in BigQuery for a more efficient analytics experience.

Top 5 IT outages detected by StatusGator

StatusGator is the world’s best status page aggregator: We aggregate the status of thousands of cloud services and hosted applications from their official status pages. But everyone knows official status pages are often behind and in those critical moments before the status page is updated, you might be thinking “Is it just me? Or is it really down?” StatusGator’s Early Warning Signals solves that by alerting you before providers even acknowledge the incident.

What is Data Center Colocation (Colo)?

As IT costs continue to balloon, many organizations are caught between the desire to scale and the pressure to cut costs. It’s an incredibly delicate balancing act leaders struggle to maintain: while 66% of companies in one study said they plan to increase their IT budgets, 84% were worried about a recession, while 63% struggled to secure IT talent. By spending on infrastructure, organizations are forced to spend less on innovation. But what if there is a way to have both?

What is Digital Experience Monitoring?

Digital experience monitoring (DEM) is the evolution of application performance monitoring (APM) and end user experience monitoring (EUEM) into a comprehensive tool that analyzes the efficacy of an enterprise’s applications and services. Essentially, DEM combines these functions and goes beyond both — all to ensure consistency across the customer experience.

Comprehensive Observability: Key Performance Metrics to Monitor in Cloud Environments

Enterprises need strong observability to ensure system reliability, proactively detect and resolve issues, optimize performance, enhance security, and maintain seamless business operations across complex distributed environments.

How to Join two metrics in Prometheus?

In Prometheus, metric joining allows you to merge metrics to build more detailed and insightful queries using PromQL (Prometheus Query Language). By joining metrics, you can analyse data from different sources together, providing a more comprehensive view of your system's behaviour. This metric joining capability enables you to correlate different metrics effectively, leading to better monitoring and troubleshooting.

Scaling Product Management for Hyper-Growth: Lessons from Cribl

Cribl has been experiencing rapid growth over the past six years as customers increasingly seek tools to modernize their data strategies. We introduced a new product, Cribl Lake, to help customers address even more diverse data management challenges. With customer data growing at a 28% CAGR, organizations are looking for solutions that can help them manage and optimize their data infrastructure.

Best Practices for Choosing a Status Page Provider

Downtime is inevitable but what sets successful businesses apart is how they handle it. A key part of incident management is incident communication with both internal and external stakeholders. A status page is a crucial tool for maintaining clear communication with users during outages or service interruptions. There are numerous status page providers available with different features. This article will guide you through best practices for selecting a provider that suits your needs.

Challenges and Solutions for Real-Time Monitoring in Mainframe MQ Systems

Mainframe MQ systems are the lifeblood of many enterprises, managing the messaging that keeps critical applications running smoothly. However, maintaining the health of these systems requires careful oversight, and this is where real-time monitoring comes into play. While real-time monitoring is essential to ensure uptime, performance, and security, implementing it in mainframe MQ systems can be filled with challenges.

New Broken links UI

Keeping your website free of broken links is essential for good user experience and SEO - that's why Oh Dear monitors your entire website! Our broken links crawler will find and test all the links on your site and we keep going until we have checked everything! In addition to alerting you when you need it we have given our Broken Links feature a UI makeover! With this update it's now easier than ever to identify and resolve broken links across your site.

Budget-Friendly Logging

OpenTelemetry has quickly become a must-have tool in the DevOps toolkit. It helps us understand how our applications are performing and how our systems are behaving. As more and more organizations move to cloud-native architectures and microservices, it's super important to have great monitoring and tracing in place. OpenTelemetry provides a strong and flexible framework for capturing data that helps DevOps engineers keep our systems running smoothly and efficiently.

Optimize your RAG workflows with Elasticsearch and Vectorize

We’re excited to announce Vectorize now integrates with Elasticsearch vector database! This powerful combination simplifies building retrieval augmented generation (RAG) pipelines, allowing AI engineers to focus on building applications with unprecedented speed and accuracy. Elasticsearch vector database enables fast and efficient real-time search and retrieval of vector data, making it an excellent database for RAG applications.

Top 10 Prometheus Alternatives in 2024 [Includes Open-Source]

Effective monitoring is important for maintaining robust and reliable systems. While Prometheus has long been a go-to solution for many organizations, the growing complexity of modern infrastructure has led to an increased demand for prometheus alternatives. This comprehensive guide will explore various monitoring tools that can serve as viable prometheus alternatives, helping you make an informed decision for your specific needs.

Netdata's Integration with ilert: Streamlining Monitoring and Incident Response

Netdata now integrates with ilert, a leading incident response platform. With this integration, the incident management features and alerting capabilities of ilert and the real-time systems monitoring provided by Netdata can be leveraged. By combining both systems, users can not only monitor their infrastructure with fine detail as never before, but also assure the responsiveness of critical alerts to the correct teams swiftly.

Transform your monitoring experience-Site24x7's Custom Dashboard

The dashboard in Site24x7 provides a solid foundation, but its true potential is unlocked through customization. Custom Dashboards enable you to personalize your monitoring experience, focusing on the metrics that matter most to you. By incorporating a variety of widgets, you can create a tailored and comprehensive view of your system's performance. Site24x7’s Custom Dashboards come packed with features designed to elevate your monitoring capabilities.

Status page selector: Switch between status pages

We’re excited to announce a new feature designed for our customers with multiple boards and status pages – introducing the Status Page Selector! Now, users can switch between different status pages directly from a single page. This is especially useful for companies that need separate status pages for different products, departments, or teams.

How SRE Teams Manage Downtime with Slack War Rooms

Site Reliability Engineering (SRE) teams play a very important role in ensuring that digital services remain operational. However, at times, they can face certain incidents and outages, which are inevitable for any complex system. During these disruptions, it is important to respond quickly and efficiently to reduce the impact on the organization and its users. This is where Slack War Rooms come into the picture. When an outage strikes, the clock starts ticking.

OpenTelemetry Tips Every DevOps Engineer Should Know

OpenTelemetry has quickly become a must-have tool in the DevOps toolkit. It helps us understand how our applications are performing and how our systems are behaving. As more and more organizations move to cloud-native architectures and microservices, it's super important to have great monitoring and tracing in place. OpenTelemetry provides a strong and flexible framework for capturing data that helps DevOps engineers keep our systems running smoothly and efficiently.

What is Data Observability? Guide to Ensuring Data Health and Reliability

Data's critical role in business operations has intensified the need for reliable information management. As companies increasingly base their decisions and growth strategies on data-driven insights, maintaining high-quality datasets has become essential. Data observability offers a novel approach, transforming how organizations comprehend and maintain their information assets.

Azure Logging Unleashed: Your Key to Cloud Performance

The Azure Cloud platform processes an extensive variety of data including Eventhub Diagnostic Logs, Kubernetes Metrics, SQL Logs, Activity Logs, Container Activity Logs, and Azure Metrics. Depending on the requirements of your organization these logs offer various levels of importance and priority. But it’s more than likely that you will be monitoring a large variety of these logs.

RabbitMQ vs Kafka vs Redis

RabbitMQ, Apache Kafka, and Redis are some of the most popular microservices message brokers on the market. However, while they’re all the same type of tool, they each offer different features that make them better adapted for specific use cases. To further understand this, in this article, we will outline the main similarities and differences between these tools and highlight which is the best tool for various use cases.

Key Prometheus concepts every Grafana user should know

Prometheus has become an essential technology in the world of monitoring and observability. I’ve been aware of its importance for some time, but as a performance engineer, my experience with Prometheus had been limited to using it to store some metrics and visualize them in Grafana. Being a Grafanista, I felt I should dig deeper into Prometheus, knowing it had much more to offer than just being a place to throw performance test results.

Best Practices for Client-Side Logging and Error Handling in React

Logging is an essential part of development. While working on React projects, logging provides a way to get feedback and information about what’s happening within the running code. However, once an app or website is deployed into production, the default console provides no way to continue benefiting from logs.

How Device Management Companies Can Simplify Monitoring

Many companies that provide IoT or device management solutions need help building an in-house monitoring solution. Managing devices for your clients is challenging enough—building a monitoring system is not everyone's wheelhouse and takes time to set up. In this article, we will review some of the most common use cases for device management companies and discuss how these businesses can use MetricFire to save time and money on their monitoring.

What are DNS filters and how do they simplify network traffic routing?

In a world where businesses operate globally, managing DNS queries across multiple regions can be complex. When clients from various locations send queries for a domain, those queries must be routed to the most appropriate DNS host. Factors such as the client’s geolocation, IP address, and network type play a crucial role in ensuring traffic is directed to the right place for better performance. DNS filters provide the criteria for routing traffic efficiently.

The 3 pillars of observability: Unified logs, metrics, and traces

Understanding telemetry signals for better decision-making, improved performance, and enhanced customer experiences Telemetry signals have evolved significantly over the years — if you blinked, you could have missed it. In fact, much of the common wisdom about observability needs a refresh. If your observability solution doesn’t consider the current state of telemetry, you might need an upgrade.

How search accelerates your path to "AI first"

The combination of AI and search enables new levels of enterprise intelligence, with technologies such as natural language processing (NLP), machine learning (ML)-based relevancy, vector/semantic search, and large language models (LLMs) helping organizations finally unlock the value of unanalyzed data. Search and knowledge discovery technology is required for organizations to uncover, analyze, and utilize key data.

Grafana's Prometheus libraries: How we built libraries to create a truly vendor-neutral data source

Over the summer we told you about an update to our core Prometheus data source, which was part of a larger shift in our effort to meet users where they are. It’s a change we’re really excited about, as it represents our biggest step yet toward enabling the creation of truly vendor-neutral data sources for Grafana.

The Importance of Microsegmentation in a Multilayered Cybersecurity Defense Model

Cybercrime is expected to exceed $10.5 trillion in 2025. To put that into perspective, the total U.S. GDP in 2023 was $21 trillion. So why is cybercrime so profitable? The answer lies in the ‘perfect storm’ of conditions we currently face. Today’s organizations are totally reliant on their digital assets to function. This dependence gives bad actors the opportunity to extract data, digital assets, and money once they are inside a network—often without human intervention.

Understanding Core Web Vitals - Key Metrics for Optimizing Your Website for Better User Experience

Core Web Vitals are a set of performance metrics introduced by Google to help website owners and developers improve the user experience. These metrics are: “Core Web Vitals are a set of real-world, user-centered metrics that quantify key aspects of the user experience.” — Google.

Simplifying Your Data Node Migration with Graylog

Migrating your data infrastructure can sound daunting, especially when you’re dealing with complex systems like OpenSearch. But what if it could be easier—almost ridiculously easy? If you’re thinking, “Hey, wait a second—could this be as seamless as it sounds?” You’re in for a pleasant surprise. In this blog, we’re diving into how moving and Simplifying Your Data Node Migration with Graylog makes the process smooth, secure, and efficient.

Frontend Observability: A Candid Conversation With Emily Nakashima and Charity Majors

Frontend development has evolved rapidly over the past decade, but one challenge remains constant: understanding what’s happening in real-time across diverse browsers, environments, and user interactions. This is where observability steps in—but how does it apply to the frontend world where user experience can break in countless, unexpected ways?

Rails Community Survey 2024: AppSignal Ranks in Top 5

We're excited to share that AppSignal has once again been recognized as one of the top performance and error monitoring tools in the 2024 Ruby on Rails Community Survey. This year, we maintained our position as the fifth most popular performance monitoring tool and climbed from seventh to fourth place in the error tracking rankings. This result means that AppSignal now stands shoulder-to-shoulder alongside some much larger competitors that are backed by a combined $600 million in venture capital funding.

Monitoring Automation with Icinga Director

Automating the monitoring process for a huge amount of servers, virtual machines, applications, services, private and public clouds is a main driver for users when they decide to use Icinga. In fact, monitoring large environments is not a new demand for us at all. We experienced this challenge in tandem with many corporations for many years.

Key Considerations for Integrating MQ Monitoring During Mainframe Upgrades

Mainframes are the workhorses of many enterprise systems, known for their reliability and ability to handle high transaction volumes. However, as technology evolves, even these robust systems need upgrades to keep up with modern demands. A smooth mainframe upgrade isn’t just about upgrading the core system; it’s also about ensuring that the surrounding infrastructure, including messaging systems like IBM MQ, functions seamlessly during and after the upgrade.

The Future of Data Compliance in the Public Sector: Trends and Predictions

As organizations in the public sector continue to undergo what Deloitte has called a “radical transformation” and embrace new, innovative technologies, they’re seeing improvements in everything from agility to customer experience. And, the good news is that innovation tends to breed more innovation, meaning the digital transformation of the last two decades laid the groundwork for the widespread use of artificial intelligence (AI).

Laravel performance monitoring in Honeybadger

Great news, Laravel friends! You can now monitor the performance of your Laravel apps with Honeybadger. Yes, you read that right: Laravel performance monitoring in Honeybadger! Many of you have asked for this, and we're excited to tell you about it. Earlier this year, we launched Honeybadger Insights, a new logging and performance monitoring tool bundled with Honeybadger.

Kentik Bytes: Data Explorer for Cloud Engineers

In this latest Kentik Bytes, we explore how Kentik Data Explorer empowers cloud engineers to gain visibility across distributed, multi-cloud environments. With the ability to query and analyze vast amounts of telemetry from AWS, Azure, Google Cloud, and on-premises environments, Kentik simplifies troubleshooting and cost optimization. We walk through how to filter data, use custom dimensions, and compare historical data to get deeper insights, all in one platform.

Java Logging Basics: Concepts, Tools, and Best Practices

Imagine you’re a detective trying to solve a crime, but all the evidence is invisible. Sounds impossible, right? That’s exactly what it’s like trying to debug a Java application without proper logging. Java logging is your magnifying glass, your fingerprint kit, and your trusty notepad all rolled into one. It’s the unsung hero that helps you understand what’s going on under the hood of your application. But logging isn’t just about catching bugs.

Raygun's new SDK for .NET Blazor makes error monitoring easy

.NET Blazor, a robust web development framework, offers developers the unique opportunity to build interactive web applications using C#, HTML, CSS, and JavaScript that can run on the server, on the user’s browser, or even as a mobile application when part of a.NET MAUI application. Its unique approach differentiates Blazor from traditional web development methods.

Introducing Site24x7's OCI Monitoring: Optimizing Oracle Cloud Infrastructure

As businesses increasingly rely on cloud services, managing cloud environments efficiently has become more crucial than ever. Oracle Cloud Infrastructure (OCI) is a leading cloud service provider, offering a robust suite of cloud services—spanning computing to networking and storage. But to ensure that your cloud resources are always operating optimally, monitoring is not just recommended, it is essential.

Is Datadog Worth the Price? An In-Depth Cost Analysis in 2024

Datadog has established itself as one of the leading solutions for monitoring, logging, and analytics. But with the increasing number of alternatives available, many businesses are asking, "Is Datadog worth the price?" This article breaks down Datadog's pricing structure, the value of its features, and compares it to competitive alternatives. By the end, you'll have a clear understanding of whether Datadog is the right fit for your business.

Common Kafka Security Misconfigurations and How to Avoid Them

Apache Kafka is the go-to solution for companies needing to move data fast and efficiently, but here’s the catch—when you’re handling sensitive data, the stakes are high. One misstep in your security configuration, and you’re not just dealing with a hiccup; you could be looking at full-blown security breaches, unauthorized access, or lost data. No one wants that. Yet, many organizations still stumble into the same security pitfalls.

Why use the Opslogix SCOM Data Source for Grafana?

In data-driven environments, effective monitoring and reporting is critical for IT operations. For organizations using Microsoft’s System Center Operations Manager (SCOM), the integration with visualization tools like Grafana can enhance data accessibility and understandability. One standout integration solution is the Opslogix SCOM Data Source for Grafana. In this blog post we will talk about why it can be the next game-changer for your organization.

Troubleshooting Microservices with Splunk Observability Cloud and the AI Assistant for Observability

In this video, I’m going show you how to troubleshoot microservices in Splunk Observability Cloud using features like APM’s Service Map and Tag Spotlight to identify what’s causing our microservice to produce high error rates. We’ll then review Related Logs in Log Observer to determine why the error in our service is occurring.

Obkio Autumn Updates: What's New and What's Coming!

At Obkio, we’re always working to enhance your experience with our app. Over the past few months, we’ve rolled out some exciting features and updates to improve the user experience and overall functionality of our app. Here’s a rundown of what’s new and what you can expect in the near future!

The new era of observability: Why logs matter more than ever

20 years ago, software ate the world. The old ways of monitoring, failing over, or routinely rebooting quickly became inadequate and with a new focus on software excellence, how we monitor and maintain them had to be rethought. Even back then, when new software was released on an annual basis, it was clear that developers and futurists needed to build, inform, and optimize their approach, which required a deeper understanding of the application experience.

What is MTTR in Networking?

When a critical system goes down, every second counts. That’s why IT and network professionals need to get comfortable with tracking incident response metrics like MTTR. MTTR (which you’ll soon come to find has several meanings) is a set of key metrics that measure how fast your team can repair and recover from incidents, directly impacting your system uptime and service quality.

Top Tips for Querying OpenSearch

OpenSearch allows you to store a sizeable amount of data, commonly logs, metrics, and documents. You access useful data within OpenSearch by querying to get specific information, deep analysis, and insights for decision-making. With OpenSearch, you can perform complex searches by using natural language, Boolean operators, and filters to pinpoint relevant information efficiently.

Downtime happens, fix it faster - Uptime monitoring now in open beta

That moment when everything’s running smoothly—users engaged, conversions flowing—until your site takes a break, and you find out from a tweet. We’ve all been there, scrambling to fix an issue that’s been broken for who knows how long while social media lights up. A few minutes of downtime, and now you’re not just fixing the issue—you’re dealing with frustrated users and a reputation hit.

Shaping the Next Generation of AI-Powered Observability

Observability is crucial for maintaining complex systems’ health and performance. In its traditional form, observability involves monitoring key metrics, logging events, and tracing requests to ensure that applications and infrastructure run smoothly. The emergence of Artificial Intelligence (AI) promises to revolutionize the way organizations approach observability.

Four ways observability can enhance IT resilience in 2025

Enterprises are yet to hit a sweet spot with their IT infrastructure monitoring. Despite investing thousands of dollars and getting a bunch of monitoring tools, it is almost always true that the customer catches the issue before the monitoring tool does. In today’s time, teams are looking at more than just monitoring tools. In fact, they want a system that can detect and resolve the issue in the same platform without any delays or intervention.

Azure monitoring in Applications Manager

Azure monitoring involves tracking and analyzing the health and performance of your cloud infrastructure hosted on Microsoft Azure. It involves gaining real-time insights into the performance of Azure resources, such as virtual machines, databases, and applications, enabling you to identify and resolve issues before they impact your operations. With a plethora of options available in the market, choosing the right Azure monitoring software can be a daunting task.

Redis Monitoring: What It Is and How to Do It

Redis is an in-memory data store used primarily as a quick-response database or an application cache. As an open-source NoSQL database, Redis handles data operations in microseconds, making it perfect for applications that need real-time processing. Fast, flexible, and easy to use, Redis has become a key player in modern application design.. Developers love Redis for its scalability and because it delivers application performance much faster than traditional databases, thanks to its in-memory operations.

Network monitoring, explained

Network monitoring continuously observes and manages the performance, availability, and security of a computer network to identify issues before they affect operations. As IT infrastructure grows more complex, network monitoring ensures your business stays online, whether dealing with on-premises or cloud environments. In hybrid or multi-cloud settings, having visibility across all systems is crucial to maintain seamless performance and prevent disruptions.

Revisiting improved HTTP logging in ASP.NET Core 8

A few years ago, I had a play with HTTP logging added in ASP.NET Core 6. ASP.NET Core 8 introduced a set of additional configuration options that I believe are essential to make this feature usable. I will recap the details from the previous post below, but for more context, the first part of this series is here. In this post, I'll go through some of the changes introduced in HTTP logging since last. Before I jump into the improvements, let's recap how to set up HTTP logging.

Inside PromQL: A closer look at the mechanics of a Prometheus query

Even though I’m a Prometheus maintainer and work inside the Prometheus code, I found many of the details of PromQL, the Prometheus query language, obscure. Many times I would look something up, or go deep into the code to find out exactly what it did, only to forget it again the next month. So, trying to live up to my job title of Distinguished Engineer at Grafana Labs, I resolved to write the definitive guide: what really happens when I execute a PromQL query?

How to Build a Data Migration Plan? A Step By Step Guide

Data growth is growing at an extraordinary pace, with a compound annual growth rate (CAGR) of 28% projected over the next few years. For organizations dealing with logs, metrics, and traces, this massive data expansion brings both opportunities and challenges. As data volumes soar, having flexibility in where you store and analyze it—whether in a SIEM, object storage, or other platforms—has become essential.

Driving Unparalleled Growth for MSPs and Deliver Value for Their Clients with ScienceLogic

Since ScienceLogic was founded in 2003, our goal has been to support our partners, including Managed Service Providers (MSPs), with solutions that help them and their clients gain unparalleled visibility into their IT environments. Our objective has always been to help these organizations bring order to complexity, turn inefficiencies into productivity, and, in the process, help service providers and the companies they serve exceed their business objectives.

Measuring Largest Contentful Paint with Request Metrics

Measuring Largest Contentful Paint (LCP) is important because it helps you understand how quickly the main content of a web page loads and becomes visible to users. LCP focuses on when the largest visible element—like a hero image, heading, or video—renders in the viewport, making it a key indicator of perceived load speed. Optimizing for LCP ensures faster, smoother interactions, enhancing both user satisfaction and search engine ranking. Let's see how you can get to the bottom of any LCP problems in Request Metrics!

Icinga Notifications: Custom Channel Plugins

As many of you have already seen in our previous blog posts and our early beta release, we’re working on a new, independent notification module. Right now, we only offer three ready-made channels for sending notifications. Today, I want to show you how you can create your own channel and add it to the Icinga Notifications module. In this blog post, I’ll show you how to build a bridge to Telegram and send new notifications to a group chat.

Hurricane Helene Devastates Network Connectivity in Parts of the South

In this post, we dig into the impacts from Hurricane Helene which came ashore late last month wreaking destruction and severe flooding in the Southeastern United States. Using Kentik’s traffic data as well as Georgia Tech’s IODA, we detail the impacts in three of the hardest-hit states: Georgia, South Carolina, and North Carolina.

Understanding Java Logs

Logs are the notetakers for your Java application. In a meeting, you might take notes so that you can remember important details later. Your Java logs do the same thing for your application. They document important information about the application’s ability to function and problems that keep it from working as intended. Logs give you information to help fix coding errors, but they also give your end users information that helps them monitor performance and security.

Redefining RUM: A Comparative Gap Analysis of Existing Tools

Real user monitoring (RUM) began as a straightforward approach to tracking basic web performance metrics. Focused on things like page load times and response rates, RUM relied on server-side logging and simple browser timings. While these tools captured Core Web Vitals (CWVs), they offered limited insights into how users actually interacted with pages, focused mainly on server-side performance.

What Is A Network Drop: Solving Drops in Networks

Network drops can seriously impact business operations, leading to lost productivity, communication breakdowns, and even financial losses. Whether you're managing critical systems, supporting remote teams, or delivering services to customers, a stable network is essential for maintaining business continuity. But what causes these network drops? How can you fix them? And most importantly, how can you prevent them from happening again?

Introducing the Observability Center of Excellence: Taking Your Observability Game to the Next Level

Chasing false alerts — or worse, having your system go down with no alerts or telemetry to give you a heads-up — is the nightmare we all want to avoid. If you’ve experienced this, you’re not alone. Before joining Splunk, I spent 14 years as an observability practitioner and leader for several Fortune 500 companies and in my 2.5 years with Splunk I have had the opportunity to work with customers of all shapes and sizes.

IT's Not Easy Being Green - SolarWinds TechPod 091

In this episode of SolarWinds TechPod, hosts Sean Sebring and Chrystal Taylor discuss sustainability in technology with SolarWinds Evangelist Sascha Giese. They explore the energy consumption of data centers, innovative green initiatives, and the importance of circular IT practices. The conversation also touches on the concept of greenwashing and the responsibility of corporations and individuals in reducing their carbon footprints.

Autoscaling in Cloud Computing

Autoscaling in cloud computing is the ability of a system to adjust its resources in response to changes in demand automatically. This guarantees that applications always have the resources they need to perform optimally, even during periods of high traffic. Autoscaling eliminates manual intervention, allowing your dev team time to focus on your product. All major cloud providers like AWS, Azure, and Google Cloud Platform offer robust autoscaling solutions with many features and capabilities.

How to Integrate Docker with Logit.io

Docker is an open-source container service provider, designed to help developers build, run, and share container applications. Users building and running these container applications need to conduct effective debugging and monitoring practices and for this, they have turned to Docker logging. To understand the importance of this, the latest edition of our how-to guide series surrounds Docker.

Common Kafka Performance Issues and How to Fix Them

Kafka’s bread and butter is real-time data streaming, but like any complex system, it can run into performance issues. These problems often sneak up as your cluster scales, leading to bottlenecks, slowdowns, or even crashes if left unchecked. The good news? Most of these issues are fixable with the right diagnosis and a few tweaks. In this blog, we’ll look at some of the most common Kafka performance issues and provide practical solutions to get things running smoothly again.

25 Azure Monitoring Tools To Consider For Cloud Optimization

Microsoft Azure is the most popular cloud computing platform after Amazon Web Services (AWS). With over 200 services and resources available, there are plenty of ways to use Azure. This means the Azure public cloud allows hundreds, if not thousands, of unique configurations. This flexibility is ideal for tailoring Azure to your workload’s requirements but also makes cloud management more challenging.

Grafana for beginners: Quick tips to add a data source, choose a visualization type, and more

In the observability space, ease-of-use has always been a key differentiator for Grafana. As much as we want to offer a powerful observability platform to our users, we also want to ensure they can get up and running as quickly as possible. Still, for those of you sitting down to build your first dashboard, we totally understand that a little guidance can go a long way.

What is Network Device Monitoring & How to Configure It? | Obkio NPM Onboarding Series

In this video, we’re looking at the “Network Devices” tab in Obkio’s Network Performance Monitoring App. Here you monitor network devices using SNMP polling and configure network device monitoring. Obkio collects different network metrics about the network device, mainly the CPU usage of the device in question, as well as information about the bandwidth of the ports.

Using Trace Data for Effective Root Cause Analysis

Solving system failures and performance issues can be like solving a tough puzzle for engineers. But trace data can make it simpler. It helps engineers see how systems behave, find problems, and understand what's causing them. So let’s chat about why trace data is important, how it's used for finding the root cause of issues, and how it can help engineers troubleshoot more effectively.

Why Early Crash Reporting Saves Time and Prevents Costly Bugs

At BugSplat, we always advocate for teams to introduce crash reporting and establish a bug-tracking/bug-fixing workflow early in their development process. So you can imagine my excitement when I found myself at Denver Startup Week chatting with the founder of a startup that has several projects in flight. He mentioned they’d just kicked off development of a new application, and things were moving quickly.

The hidden challenges of Internet Resilience: Key insights from 2024 report

The result of responses from over 300 digital business leaders in North America and EMEA across technology platform providers, financial services, retail, and other industries, our research showed that almost half the surveyed organizations are losing upward of $1M monthly in terms of total economic impact (TEI) due to outages and service degradations.

What is Network Access Control? A Complete Guide to NAC

Network access control (NAC) is a critical component of any organization’s cybersecurity strategy. As companies adopt increasingly flexible work environments and emerging technologies like the Internet of Things (IoT), their networks have expanded rapidly. More users, devices, and access points mean more potential vulnerabilities that attackers could exploit. Implementing NAC solutions lets organizations stay securely connected despite relying on a complex, dynamic infrastructure.

3 Switch Features You Should Never Change

In separate incidents this past month, I’ve helped clients troubleshoot network problems that turned out to be due to misconfigured switches. In all cases, the errors turned out to be things that I don’t think should ever have been changed from their default settings. So I thought it might be useful to have a brief discussion about how switches work and what features should or should not be used in normal office environments.

Making serverless applications reliable and bug-free

Building applications using serverless technology on AWS—like AWS Lambda and Amazon API Gateway—can be incredibly powerful. You get to scale effortlessly and focus on writing code without worrying about managing servers. But as your application grows and spreads across hundreds or even thousands of cloud resources, keeping track of errors and fixing issues quickly becomes a big challenge.

How to Identify Advanced Persistent Threats in Cybersecurity

Cyber threats are a major concern. Individuals, governments, and businesses all feel the impact. The emergence of advanced persistent threats is one of the most alarming forms of cyber espionage (APTs). These hacks are notable for their intricacy, tenacity, and broad penetration capabilities, whether they target a mobile or web application. APTs can harm the target network, including heightened geopolitical tensions, data theft, and protracted service interruptions.

Introducing Spectate's new (more affordable) pricing

At Spectate, we're committed to helping you improve the reliability of your websites and applications. We believe that reliability shouldn't come at a high cost, which is why we're excited to announce that today we announce a major update to our pricing plans making them more affordable and accessible for businesses of all sizes to improve their reliability and efficiency in incident management.

Integrate Incident Alerts Into Your Slack Workspace

Staying on top of your third-party Cloud and SaaS service outages is crucial to maintain the reliability of your own applications. Like many modern teams, Slack might be your communication tool of choice. You can keep up with such incidents by pushing these events to a Slack channel. There are different ways of pushing incident events to Slack. In this article we will explore how to integrate IncidentHub incident lifecycle events using an incoming webhook.

What Is Full Stack Observability and Why Is It Important?

The complexity of modern software systems has reached unprecedented levels. Comprehensive monitoring and observability have become paramount as organizations continue embracing cloud-native architectures, microservices, and distributed systems. Enter full stack observability - a game-changing approach that's revolutionizing how we understand and manage our IT environments.

How to Use Workforce Managing Software Properly

Using Workforce in your business can help streamline processes, improve efficiency, and enhance employee satisfaction. If you are considering implementing Workforce into your daily operations, read through this guide on how to use it properly and get the most out of it in your work setting.

Common Pitfalls in Physical Security and How to Overcome Them

Today's business landscape makes physical security of increasing importance, particularly as businesses grow larger and face more obstacles in maintaining effective physical protection measures for assets and personnel. Relying on outdated lock-and-key systems, lack of flexibility with access controls or insufficient monitoring are all risks to business that Digilock RFID lock systems help businesses overcome more efficiently by offering more secure solutions than any one person alone could.

Stop Using TCP Health Checks for Kubernetes Applications

As developers, one of the most important things we can consider when designing and building applications is the ability to know if our application is running in an ideal operating condition, or said another way: the ability to know whether or not your application is healthy. This is particularly important when deploying your application to Kubernetes. Kubernetes has the concept of container probes that, when used, can help ensure the health and availability of your application.

The Best Tips for Implementing Effective Alerts

When monitoring your logs metrics and traces it’s crucial that you can detect issues early to ensure the uptime of applications, alleviate bottlenecks, and enhance the performance of your systems. If you’re an experienced developer or IT professional this is a straightforward task when you’re viewing the data in front of you. However, when you aren’t viewing your data, it's just as important to guarantee that your systems are functioning optimally. This is achieved through alerts.

11 helpful KPIs to improve your network performance

Digitalization has surpassed network modernization, resulting in networks struggling to keep up with daily operations. While many networks can accommodate GenAI and other new technologies, network administrators are responsible for maintaining uninterrupted operations and preventing any errors. For this, they must diligently monitor network performance and related metrics so their networks remain secure and robust yet flexible enough to adapt to the latest technologies.

Transforming cybersecurity with Elastic Search AI: A game-changer for Proficio

How Proficio leveraged Elastic Security on AWS to revolutionize threat detection and response In today’s rapidly evolving digital landscape, maintaining robust cybersecurity defenses has never been more critical. Proficio, a leading managed security services provider, faces the continual challenge of monitoring an expansive array of data points and potential vulnerabilities.

Monitoring Policy Groups in AppNeta: Streamlining Setup and Maintenance

The AppNeta by Broadcom product team has been focused on enhancing the solution’s capabilities for monitoring setup and administration. This evolution began with the introduction of Monitoring Policies, which provided a framework for setting up monitoring in a scalable, automated fashion. Following this, we added new network rules that made it simple to select and tag the networks that should be monitored.

Capturing a Complete Topology for AIOps

Our thinking and use of topology within AIOps and Observability solutions from Broadcom has advanced significantly in recent years while solidly building on our innovative domain tools. We’re looking to communicate these innovations, advancements, and benefits for IT operations. In this blog, we continue where the previous blog left off to explain the boundary blame concept and mechanism to obtain a sufficiently complete topology.

7 Ways to Boost Your Website Traffic

There was a time when getting traffic to your website was simple. But those days are long gone. According to research, only 3.45% of web pages get any traffic nowadays, and out of those, a mere 1.94% see between one and ten monthly visits. With Google tweaking its ranking factors seemingly every other week and over 2 billion websites competing for attention, getting eyes on your site has become an uphill battle. But don't worry.

How Healthchecks.io Sends Webhook Notifications

Webhooks are a powerful way to notify external systems about checks changing state in Healthchecks.io. Webhook notifications are available to all user accounts, paid and free. Webhooks were the second notification method supported by Healthchecks (the first one was email). The webhook delivery code started as a simple requests.get(user_supplied_url) and evolved. Today, the webhook integration in Healthchecks supports.

Datadog on OpenTelemetry

OpenTelemetry (OTel) is an open source, vendor-neutral observability framework that supplies APIs, SDKs, and tools to instrument, generate, collect, and export telemetry data (metrics, logs, traces and soon profiles). It has a vibrant ecosystem of components, integrations and vendors. In this episode, Juliano Costa will discuss OpenTelemetry with Felix Geisendörfer, Senior Staff Engineer on the Continuous Profiling team, and Pablo Baeyens, Software Engineer on the OpenTelemetry team.

Webinar Recap | Next Gen Log Management: Maximize Log Value with Telemetry Pipelines

During our webinar, Next Gen Log Management: Maximize Log Value with Telemetry Pipelines, we discussed how you can take your log management strategy to the next level with telemetry pipelines and unlock the full potential of your data. Bill explained that the rapid growth of log data is driving up storage and management costs. He emphasized the need for an intelligent, adaptable log management system to efficiently handle this situation.

Comprehensive Observability: Key Availability and Reliability Metrics to Monitor in Cloud Environments

Strong observability in cloud environments is essential for monitoring the health of interconnected systems. Unlike traditional monitoring, which is limited to specific cloud stacks or devices, observability provides comprehensive visibility across the entire hybrid IT infrastructure including applications, IT systems and services.

Five Playwright CLI features you should know

Thanks to Microsoft's Playwright, running end-to-end tests with real browsers is quickly done. Initialize a new Playwright project, install all the dependencies, and off you go! Then, any new headless browser test run is only one npx playwright test away. But have you checked all the test command's CLI options? playwright test includes a few real gems to help you create better tests faster. Let me share a mixed bag of my favorite CLI tricks in this post.

8 Most Common Latency Issues & How to Troubleshoot Them

Whether you’re a business running cloud-based applications, an educational institution facilitating virtual learning or a remote worker, latency issues can be a major roadblock. At a time when businesses and remote workers depend heavily on cloud services, real-time communication tools like Zoom, and collaboration platforms such as Microsoft Teams, even a slight delay in network performance can disrupt workflows, cause frustration, and hinder overall efficiency.

Transforming Compliance and Operational Efficiency: A Success Story with Motadata AIOps APIs

In the fast-paced world of equity broking, compliance with regulatory requirements and operational efficiency are paramount. Broking platforms must ensure that their systems are not only continuously monitored, but their data is accurately reported to regulatory bodies. This is a story of how a leading equity broker from India leveraged our AIOps APIs to meet their regulatory compliance requirements while achieving operational excellence.

All about Explore Logs for Grafana Loki (Loki Community Call October 2024)

In this Community Call, Senior Software Engineer Trevor Whitney talks to us all about Explore Logs for Grafana Loki, an open-source app for visualizing logs from Loki in Grafana without needing to learn and write LogQL queries. He is joined by Senior Developer Advocates Nicole van der Hoeven and Jay Clifford. Community Calls are monthly meetings that are open to everyone interested in the development of Loki. They are an opportunity for software engineers working on Loki to discuss new features as well as for open-source users of Loki to ask questions.

The Role of Technology in Reducing Risks When Working at Heights

Working at heights is one of the most dangerous tasks in many industries, including construction, maintenance, and telecommunications. Accidents related to working at elevated levels, such as falls, can lead to severe injuries or even fatalities. While safety regulations and protocols are in place to minimize these risks, the introduction of new technologies has significantly enhanced the ability to protect workers. From advanced safety equipment to innovative training methods, technology is playing a vital role in reducing risks associated with working at heights.

Top Reasons to Move to AVD (Azure Virtual Desktop)

There are a lot of articles along the lines of – “Top Reasons to Move to AVD” or “Top Benefits of AVD”. Having read a fair few, I suspect the Chat-GPT fairies have been hard at work! A veritable mush of phrases such as “flexibility”, “security”, “user experience” and so. Let’s dissect the question – “What are the reasons to move to AVD?”.

Logz.io Earns 15 G2 Badges for Fall 2024: AI-Powered Observability That Delivers

At Logz.io, we believe that observability should be simple, smart, and fast—powered by AI to help teams move with confidence. This Fall, our users recognized that commitment by awarding Logz.io 15 badges on G2 across multiple categories and global markets. From ease of use to fast implementation, users and businesses alike are experiencing how AI-driven observability can transform their operations. Here’s a breakdown of what we achieved and why it matters for you.

Cribl and CrowdStrike Deepen Partnership with Falcon Next-Gen SIEM integration

Cribl is The Data Engine for Security and IT data, and integrations fuel our mission. Since day one, Cribl has been delivering new Stream integrations to meet customers where they are in their data management journey. No matter where customer data resides or needs to go, we want to be there for every customer. It’s your data, and Cribl was created to help you unlock it.

How to Slash Cyber Security Costs with Cribl Stream

Imagine the panic of a business owner who starts the day with a devastating realization: their entire database has been compromised, and the attackers demand a ransom that threatens the very survival of the business. Unfortunately, this isn’t just a nightmare what-if, it’s an all-too-common reality in today’s connected world.

Introducing Ping Monitoring in StatusGator

We’re excited to announce a new addition to StatusGator’s robust monitoring suite: Ping Monitoring. Along with service and website monitoring, you can now set up ping monitors to check the status of your network or other critical infrastructure. This new feature gives you more ways to ensure your systems are running smoothly by adding lightweight, real-time checks of systems that are not web-based.

Atomic Repositories in Clean Architecture and TypeScript

You’re checking out on an e-commerce site. You have a cart with several items and quantities, and you click the checkout button. Under the hood, the operation flow might look like this: But alas, if you’ve designed your e-commerce site like this, you have likely created an atomicity problem. Atomicity in the Repository Pattern occurs when multiple repositories execute their queries in one transaction. If one query fails, all of them fail and must be rolled back.

Why Is My Internet Connection Unstable? - Tips for Remote Users & Businesses

The digital world is fast-paced, and both remote users and businesses rely heavily on stable Internet connections to stay connected, productive, and efficient. But what happens when your Internet connection becomes unreliable? Whether you're experiencing video call interruptions, slow loading times, or frequent disconnections, an unstable connection can cause chaos. So, why is your Internet connection unstable, and how can you fix it?

SolarWinds Day | Observability Anywhere. Precision Everywhere.

SolarWinds is expanding its cloud-monitoring capabilities across our self-hosted and SaaS observability offerings. In this video, we'll explore new and expanded capabilities for our observability solutions and learn how this increased functionality enables IT teams or organizations to decide for themselves how they monitor and manage their hybrid IT.

Azure Cost Allocation to manage Azure spend and get the most out of it

As more and more companies are moving their operations to the cloud, cost management becomes one of the significant concerns, and Azure cost allocation provides the solution for it. Due to the fact that more and more companies use Azure services, it has become crucial to define the correct Azure cost allocation and resource management.

Retail ITOps: Boost Operational Resilience with Business Service Observability

david.arrowsmith • Oct 03, 2024 In today’s competitive and fast-paced retail environment, service availability is paramount to delivering exceptional customer experiences. As an ITOps Manager or Site Reliability Engineer in a large retail enterprise, you're tasked with managing complex, interdependent systems that support vital business functions such as supply chain operations, point-of-sale (POS) systems, and inventory management.

Handling Kafka Partition Rebalancing Issues

If you’ve been working with Kafka long enough, you know its power when it comes to real-time data streaming. But, like any complex system, it comes with its own set of headaches—especially when it comes to partition rebalancing. One day your cluster is humming along, and the next, a rebalance kicks in, and suddenly you’re staring at a bunch of overloaded brokers and bottlenecked data flows.

Splunking GenAI Applications for Observability Insights

Has your organization finally developed that game changing generative AI application? Is your CTO, CIO, or CEO banking on it being a success? I bet they are! Now, here’s the big question: Are you prepared to monitor and troubleshoot your new application once users get engaged? Fear not, my boy Derek Mitchell has you covered with two incredible Splunk Lantern articles which goes deep into how Splunk Observability Cloud allows you to instrument GenAI apps to gain critical observability insights.

How to use Prometheus to efficiently detect anomalies at scale

When you investigate an incident, context is everything. Let’s say you’re working on-call and get pinged in the middle of the night. You open the alert and it sends you to a dashboard where you recognize a latency pattern. But is the spike normal for that time of day? Is it even relevant? Next thing you know, you’re expanding the time window and checking other related metrics as you try to figure out what’s going on. It’s not to say you won’t find the answers.

SolarWinds closes the market's hybrid IT observability gap, accelerating transformations for customers

The next generation of SolarWinds Observability delivers innovative and comprehensive full-stack visibility across all IT environments-on-premises, cloud, or hybrid-with flexible self-hosted and SaaS deployment options.

Bandwidth control: A comprehensive guide

A well-kept network is the mainstay of any business. Ignoring its upkeep is a recipe for disaster. To ensure smooth operations and avoid costly downtime, businesses must prioritize network health. Investing in the right equipment and assembling a skilled team is akin to building a sturdy foundation for your business. Managing and controlling your network’s bandwidth is an important ingredient for keeping your network in tip-top shape.

New Relic vs AppDynamics - A Detailed Comparison for 2024

New Relic and AppDynamics are leading monitoring and observability tools for monitoring the performance of your applications and network. Both help you keep track of how well your systems are running, but they do it in different ways. New Relic is a great tool for APM, making it versatile for tracking overall system performance. It also features an easy-to-use interface and strong data visualization.

Integrating Open edX with AppSignal

Imagine stepping into the role of a DevOps engineer at an online learning company that utilizes Open edX as its core Learning Management System (LMS). As the platform scales to accommodate more learners, a myriad of challenges begin to surface: These are just the tip of the iceberg. It's pivotal that you provide timely reports on site performance and error tracking in real time, and fix any issues before they affect a significant user base.

Learn How Slack Helps SREs Stay Ahead of Service Disruptions

Site Reliability Engineers (SREs) are crucial for the smooth delivery of online services. Their job is to ensure that systems are reliable, available, and efficient. But when things go wrong, they’re the ones who jump into action to fix issues as fast as possible. And with modern systems being as complex as they are, managing service disruptions can be quite a challenge. This is where Slack comes in. It’s more than just a chat tool.

Debugging a Slack Integration with Sentry's Trace View

While building Sentry, we also use Sentry to identify bugs, performance slowdowns, and issues that worsen our users’ experience. With our focus on keeping developers in their flow as much as possible, that often means identifying, fixing, and improving our integrations with other critical developer tools. Recently, one of our customers reported an issue with our Slack integration that I was able to debug and resolve with the help of our Trace View.

The Journey to Autonomic IT: Progressing to AI-Advised IT

So far, we’ve detailed the Autonomic IT maturity model and discussed the characteristics of the early stages of that journey, progressing from “Siloed IT” to “Coordinated IT” and then to “Machine-Assisted IT in recent blog posts.” Wherever your organization is on this journey, there is likely still work to be done.

Top 6 Tips for Forwarding Logs

Log forwarding can be seen as the first step towards centralized log management. With centralized log management, your organization can gain from enhanced visibility, monitoring, and analysis capabilities, making it a coveted practice for numerous organizations. Log forwarding is crucial for maintaining robust IT security and operational efficiency, allowing organizations to manage and analyze logs from multiple systems in a centralized, scalable manner.

Container monitoring with Grafana: Helpful resources to get started

In simple terms, containers are a standard package of software that enable applications to run consistently across different computing environments. Often, these applications are broken down into smaller collections of independent services known as microservices. For many organizations, these microservices-based applications have replaced traditional monolithic applications because they offer increased performance, flexibility, and scale.

Using Honeycomb for Frontend Observability to Improve Honeycomb

Recently, we announced the launch of Honeycomb for Frontend Observability, our new solution that helps frontend developers move from traditional monitoring to observability. What this means in practice is that frontend developers are no longer limited to a metrics view of their app that can only be disaggregated in a few dimensions. Now, they can enjoy the full power of observability, where their app collects a broad set of data as traces to enable much richer analysis of the state of a web service.

What is an SNMP trap? A complete overview

SHARE Simple Network Management Protocol (SNMP) traps are messages sent by SNMP devices that notify network monitoring systems about device events or significant status changes. At LogicMonitor, our view on SNMP has evolved over the years. While we have often favored other logging methods that offered more insights and were considered easier to analyze in the past, we recognize that SNMP traps remain an essential tool in network management.

When SSL Issues aren't just about SSL: A deep dive into the TIBCO Mashery outage

On October 1, 2024, TIBCO Mashery, an enterprise API management platform leveraged by some of the world’s most recognizable brands, experienced a significant outage. At around 7:10 AM ET, users began encountering SSL connection errors that appeared straightforward at first glance.

Infrastructure and Observability as Code | An Introduction

In this video I will introduce you to the concept of Observability as Code and what that looks like in Splunk Observability Cloud. I’ll first discuss the issues you might encounter managing infrastructure manually, and then define Infrastructure as Code so that you have a better understanding of the motivation behind Observability as Code. We’ll briefly introduce Terraform and then I’ll discuss the benefits of implementing Observability as Code using Splunk’s Terraform provider in Splunk Observability Cloud.

Reduce your AWS Step Functions' error remediation time by redriving executions directly from Datadog

AWS enables customers to retry or redrive Step Functions executions to continue any failed executions of Standard Workflows from their points of failure while maintaining all inputs. For example, if you find broken downstream logic in your code or experience unexpected errors upon execution, you can remediate those errors by fully re-running an execution or use redrive to continue this execution.

Outages, privacy, and cybersecurity worries: Insights from our K12 technology survey

Ever wondered what keeps K12 IT professionals up at night? Outages, technology changes, and device management are just the beginning. Our survey reveals the real struggles of K-12 IT staff. With responses from 51 experts, we dive into their biggest concerns and emerging trends. Discover what keeps them busy and how they’re adapting in a rapidly evolving tech landscape.

How to Know if My ISP is Getting Packet Loss & How to Fix It

Packet loss is one of the most common network problems that can occur at any moment, impacting various applications and services, including Internet performance. When users experience issues like slow loading times or dropped connections, their first instinct may be to wonder: Is the packet loss on my end or my ISP's end? How can I know if my ISP is experiencing packet loss? This question is crucial for both customers and ISPs.

A Comprehensive Guide to Modernizing Mainframes with MQ Monitoring

Mainframes. Just the word alone can conjure up images of massive, humming machines sitting in a data center, quietly running the backbone of your business. These systems have been around for decades, rock-solid and dependable, but let’s be honest—they’re not exactly built for the speed and flexibility of today’s tech world. The good news? You don’t have to retire your trusty mainframe to keep up with modern demands.

The Journey to Autonomic IT: Progressing to Machine-Assisted IT

So far, we’ve detailed the Autonomic IT maturity model and discussed the characteristics of the early stages of that journey, progressing from “Siloed IT” to “Coordinated IT” and then to “Machine-Assisted IT in recent blog posts.” Wherever your organization is on this journey, there is likely still work to be done.

Unified observability Maximize visibility & control of multi cloud environments

In today’s multi-cloud world, gaining real-time visibility across complex infrastructure is vital for business resilience and IT efficiency. However, traditional observability tools often fall short, leaving gaps in data collection and actionable insights. This is where unified observability comes in. Unified observability is Digitate’s unique approach, enabling organizations to monitor and control their business, applications, and infrastructure layers from a single pane of glass.

A Maturity Model for Network AIOps

AIOps is ushering in a new era in which enterprise operations are fully autonomous under the supervision of operations staff. However, this shift requires an evolution of current practices and technologies. In this comprehensive guide, we present a four-stage model for embracing AIOps, going from the lowest level to the highest visionary state.
Sponsored Post

Improve End-to-End Visibility With Network Segment Analysis

With the digital landscape today, maintaining seamless connectivity is a priority for most organizations. However, Internet Service Providers (ISPs), the Internet, and Software-Defined Wide Area Network (SDWAN) performance issues can severely impact operations, frustrate end-users, and can be costly when downtime occurs.
Sponsored Post

Responsible engineering prevents costly failures in a scaling world

Here at Raygun, we are committed to providing awesome digital experiences. Technology can transform the digital world, just like the physical one, for the people's benefit. We believe responsible engineering drives this transformation, which we summarize as follows: In this article, we demonstrate how these core principles-which we all share at Raygun-have informed the design of our tools. Software tools enable engineers to assure the quality of their evolving products, and ultimately support seamless digital experiences for end users.

Getting Started with OpenTelemetry Visualization - A Practical Guide

OpenTelemetry is a Cloud Native Computing Foundation(CNCF) project aimed at standardizing the way we instrument applications for generating telemetry data(logs, metrics, and traces). However, OpenTelemetry does not provide storage and visualization for the collected telemetry data. For OpenTelemetry visualization, you need to use a backend that can ingest the collected data and provide a web UI to visualize it.

Top PostgreSQL Monitoring Tools

PostgreSQL PostgreSQL is a powerful open-source relational database management system (RDBMS) and is one of the most popular relational databases with over 1.5 billion users. It’s renowned for its reliability, robustness, and comprehensive capabilities. It is capable of managing a broad variety of workloads, from small single-machine applications to large-scale enterprise databases.

Get Started with InfluxDB's JavaScript API

Time series databases are designed to store and analyze data collected at specified points in time. They’re essential for applications that handle huge amounts of continuously generated data, such as Internet of Things (IoT) devices, system monitors, and financial systems. InfluxDB, an open source time series database known for its outstanding performance and scalability, has gained popularity due to its capacity to manage large amounts of time-stamped data.

Boosting Code Readability and Manageability in ASP.NET Core

In Software development, code readability transforms complexity into clarity. Martin Fowler said: Code should be readable and manageable so other developers can understand and work without additional fatigue. .NET has many ways to enhance readability and manageability. This post will explore C#'s extension methods by listing five use cases that I use on all of the ASP.NET Core projects I'm working on.

Agents of Mass Collection: Cribl Edge Set-up and Tips

Collection agents emerged to alleviate the pain of having log files distributed around your application servers. However, they brought new problems since each log analysis tool wanted its own agent, trading in its own protocols and/or formats, usually targeting only a single use case. Meaning you had to install multiple agents for different use cases. Onboarding data and managing all these agents seems to be an afterthought.

Refinery and EMA Sampling

Refinery is Honeycomb’s sampling proxy, which our largest customers use to improve the value they get from their telemetry. It has a variety of interesting samplers to choose from. One category of these is called dynamic sampling. It’s basically a technique for adjusting sample rates to account for the volume of incoming data—but doing so in a way that rare events get more priority than common events. Honeycomb’s query engine can compensate for sampling rates on a per-event basis.

Unleashing the Power of Kentik Data Explorer for Cloud Engineers

Kentik Data Explorer is a powerful tool designed for engineers managing complex environments. It provides comprehensive visibility across various cloud platforms by ingesting and enriching telemetry data from sources like AWS, GCP, and Azure, and with the ability to explore data through granular filters and dimensions, engineers can quickly analyze cloud performance, detect security threats, and control costs in real-time exploration and historically.

Gain visibility into your Camunda 8 components with Bordant Technologies' Datadog integration

Camunda 8 is a process orchestration platform that automates and executes business processes at scale. Many organizations orchestrate their business processes using Camunda 8 Self-Managed because it can operate in their preferred public cloud provider, such as AWS, or in a private cloud, like a Kubernetes cluster. However, hosting Camunda 8 while maintaining its health and performance will require complete visibility into your environment, helping you properly allocate resources and minimize downtime.

What I Wish I Knew Before Building My First OTel Collector

Starting your journey to build your first OTel Collector can be really exciting, but it can also feel a bit overwhelming. OpenTelemetry, or OTel, is an amazing tool that can help standardize the collection of observability data, but it's normal to feel a bit lost at first. There are lots of little details and best practices that can make the whole process easier, but many of us end up learning them the hard way.

Status page dark mode logo, now available

We’ve added a new option to help you customize your status page even further – you can now upload a separate logo specifically for dark mode! This ensures your logo looks great, no matter which theme your users are viewing. To set this up, simply go to the Status Page Settings and head to the Appearance section. There, you’ll find the option to upload a logo tailored for dark mode.

Introducing Timeout for Website Monitors

We’ve got a great new feature for your website monitors: timeout configuration! Now, you can fine-tune your monitors by setting a custom timeout – the maximum amount of time (in seconds) you’re willing to wait for a response before considering the service down. You can choose from predefined options of 5, 15, 30, or 60 seconds, allowing for flexibility based on your needs. This feature gives you more control over how sensitive your website monitors are to slow networks.