Operations | Monitoring | ITSM | DevOps | Cloud
April 2021
Product Training - How to Build the Ultimate SCOM Console
Product Training - Dashboard Server 101
Extend IT Observability to the Cloud - Deep Dive of SquaredUp Cloud
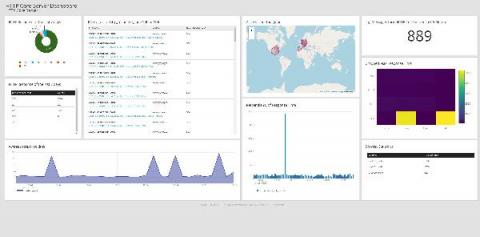
Dashboard Anything - Deep Dive of Dashboard Server
Digital Transformation and its Impact on IT Operations
Customer Spotlight - Award for Outstanding Dashboard
Product Training - How to Dashboard Azure Costs and Resources
Panel Discussion & Closing
NiCE VMware Monitoring Adds Value 2021Q2
SquaredUp 5.1 is here
We are delighted to announce that SquaredUp 5.1 is now available! With this latest update, we are introducing new integrations and visualizations that extend the picture of your business services and applications by unlocking even more of your data that is trapped within silos. You can now get insights on your enterprise applications from any angle! These features are available in all our products, including our newest product Dashboard Server.
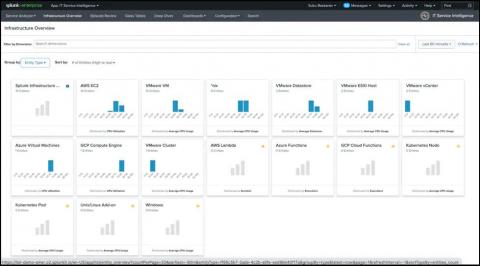
Explainer Video: Splunk for Infrastructure Monitoring and Troubleshooting
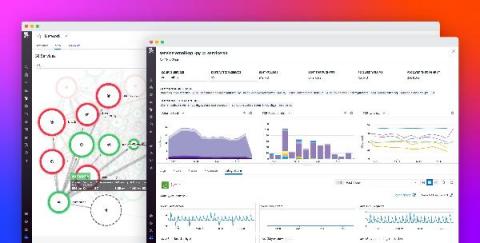
See Inside the Datadog Platform
End-to-End Observability Drives Great Digital Experiences
Keeping Watch Over Microservices and Containers
Under the Hood With Splunk Observability
Network Observability for Distributed Services
A guide to website uptime monitoring with UptimeRobot
Your website is your primary storefront on the internet and any website issues can lead to customer dissatisfaction and lost business. Which is why it is important to monitor your website to make sure that it is working properly. In this guide, we will learn how to set up website uptime monitoring with UptimeRobot.
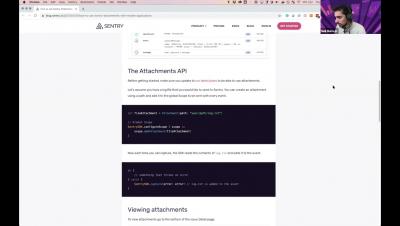
How to start performance monitoring with Sentry
Making sure that your websites and apps are not slowing down and frustrating your users is important to keep your customers happy. Sentry performance monitoring enables you to find and solve performance issues in your apps.
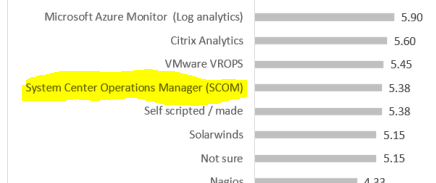
Why the VDI Like a Pro Survey - 2021 - Monitoring Poll result for SCOM is false
Why The VDI Like a Pro - EUC - State of the Union - 2021 - Monitoring Poll result for SCOM is false.
Dashbird becomes Gartner Cool Vendor 2021!
We’re officially cool! Dashbird is extremely proud to be named as a Cool Vendor by Gartner in Monitoring, Observability, and Cloud Operations in their 28 April 2021 report on “Cool Vendors in Monitoring, Observability and Cloud Operations”. “Dashbird provides a novel approach to observability for serverless applications that run inside an AWS environment.
The Application Blame Game - New Survey Reveals Troubling Trends in IT
Studies consistently show that a positive UX (user experience) drives revenue growth, repeat business and brand loyalty. Here’s a good example: in Robert Pressman’s book Software Engineering: A Practitioner’s Approach, he writes “For every dollar spent to resolve a problem during product design, $10 would be spent on the same problem during development, and multiply to $100 or more if the problem had to be solved after the product’s release.”
Interlink Software and AppDynamics deliver unified, data-driven Service Visualization and faster fault resolution.
We are delighted to share news of our partnership with leading, real-time Application Performance Monitoring (APM) vendor Cisco AppDynamics and are now a fully-fledged member of their Integration Partner Program (IPP.) For our mutual enterprise customers service affecting issues can lie undetected in the vast volumes of data generated by the multiple, disconnected tools used to monitor their multi-cloud environments, applications and technical solutions.
Announcing support for the AWS managed Lambda Layer for OpenTelemetry
Datadog’s support of OpenTelemetry—a vendor-agnostic, open source set of APIs and libraries for collecting system and application telemetry data—has helped thousands of organizations implement monitoring strategies that complement their existing workflows. Many of our customers leverage OpenTelemetry for their server- and container-based deployments, but also need visibility into the health and performance of their serverless applications running on AWS Lambda.
Key Kubernetes Metrics and Resources to Monitor for Peak Cluster Performance
Monitoring is not easy. Period. In our guide to Kubernetes monitoring we explained how you need a different approach to monitoring Kubernetes than with traditional VMs. In this blog post, we’ll go into more detail about the key Kubernetes metrics you have access to and how to make sense of them. Kubernetes is the most popular container orchestrator currently available. It’s available as a service across all major cloud providers. Kubernetes is now a household name.
How to monitor Microsoft SQL Server with Prometheus
In this article, you will learn how to monitor SQL Server with Prometheus. SQL Server is a popular database, which is very straightforward to monitor with a simple Prometheus exporter. Like all databases, SQL Server has many points of failure, such as delays in transactions or too many connections in the database. We are basing this guide on Golden Signals, a reduced set of metrics that offer a wide view of a service from a user or consumer perspective.
How to Monitor Zoom Network Performance | Obkio
What's new in Grafana Enterprise Metrics 1.3, our scalable, self-hosted Prometheus service
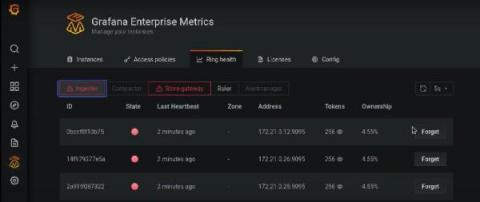
We built Grafana Enterprise Metrics (GEM) to empower centralized observability teams to provide a multi-tenanted, horizontally scalable Prometheus-as-a-Service experience for their end users. The GEM plugin for Grafana is a key piece of realizing this vision. It provides a point-and-click way for teams operating GEM to understand the state of their cluster and manage settings for each of the tenants within it.
Dashboard Server: Working with the SQL tile
In my previous blogs in the Dashboard Server Learning Path, we looked at working with the Web API tile and the PowerShell tile. In this instalment, let’s try the SQL tile. This tile will let you connect to any SQL database and run a SQL query straight from SquaredUp. This tile is also available in both the SquaredUp for SCOM and Azure products, so I have some familiarity with it already.
Dashboard Server - Introduction
Dashboard Server - Create your first dashboard
Dashboard Server - Visualising from an API
Dashboard Server - Share with Open Access
Logz.io and the AWS Distro for OpenTelemetry
Amazon Web Services has announced enhanced support for the open-source distribution of the OpenTelemetry project for its users. AWS Distro for OpenTelemetry (ADOT) now includes support for AWS Lambda layers for the most popular languages and additional partners integrated into the ADOT collector. And one of those partners is Logz.io! Logz.io is happy to announce that our exporter is now included in the AWS Distro for OpenTelemetry.
How to Improve Kubernetes Management and Administration with LogDNA
Datadog Serverless Monitoring
The IT Skills Gap-A Downside of Innovation
How To - Monitor Split Tunnel Traffic with Catchpoint
When the world transitioned to a remote workspace, one of the things that most of us figured out quickly was that some applications just don’t work well with corporate VPN. Video and voice applications, like Microsoft Teams, are essential to business operations. I wouldn’t want to add another point of failure that I’d need to troubleshoot if I didn’t have to.
Calculating a state over multiple services
These days many setups have a lot of redundancy and you may not want to send notifications during the night, just because one of multiple http servers has a problem. This blog post will show you how to setup a single service with a state combining multiple other services.
6 Steps to Getting Started With Observability
During my office hours, I frequently get asked for practical tips on getting started with observability. Often it’s from folks on teams who are already practicing continuous delivery (or trying to get there) and are interested in more advanced practices like progressive delivery. They know observability can help—but as individual contributors—they don’t sign the checks, so they feel powerless to help get their team started with observability.
Q&A from the Moogsoft/Datadog Fireside Chat
On April 15th Moogsoft’s VP Marketing, John Haley, welcomed Datadog Product Manager, Alex Vetras, along with DevOps Institute Chief Ambassador, Helen Beal, and Moogsoft’s CTO, Dave Casper, for an informal roundtable exploring how users can now see rich-context incidents from across the full stack in minutes, and the opportunities this presents to organizations.
Migrating to Serverless and making it work post-transition
In this article, we’ll be taking you through the steps and what to bear in mind in each stage of migrating to serverless – from preparation to migration and post-transition.
Datadog Mobile RUM now supports React Native monitoring
React Native is an open source framework for building cross-platform mobile applications. With React Native, developers can easily reuse the same JavaScript code for iOS, Android, and the browser, with only minimal need to accommodate specific platforms.
Linting Ruby Code
Linting is the process of statically analyzing code in search of potential problems. What constitutes a problem, in this case, can vary across programming languages, or even across projects within the same language. I would put these problems under a few different categories: Let’s take a look at a few examples of each.
A Comparison of Top Application Performance Monitoring Tools
In the competitive business world, building a robust software application becomes a vital part of the business. Ensured application performance requires consistent monitoring across several aspects. However, building dedicated tools from scratch is time-consuming and likely unviable.
Using Coralogix to Gain Insights From Your FortiGate Logs
FortiGate, a next-generation firewall from IT Cyber Security leaders Fortinet, provides the ultimate threat protection for businesses of all sizes. FortiGate helps you understand what is happening on your network, and informs you about certain network activities, such as the detection of a virus, a visit to an invalid website, an intrusion, a failed login attempt, and myriad others. This post will show you how Coralogix can provide analytics and insights for your FortiGate logs.
Get instant Grafana dashboards for Prometheus metrics with the Elixir PromEx library
I have been using Grafana for almost four years now, and in that time it has become my go-to tool for my application observability needs. Especially now that Grafana allows you to also view logs and traces, you can easily have all three pillars of observability surfaced through Grafana. As a result, when I started working on the Elixir PromEx library, having Grafana be the end target for the metrics dashboards made perfect sense.
Agent installation options for Google Cloud VMs
Site Reliability Engineering (SRE) and Operations teams responsible for operating virtual machines (VMs) are always looking for ways to provide a more stable, more scalable environment for their development partners. Part of providing that stable experience is having telemetry data (metrics, logs and traces) from systems and applications so you can monitor and troubleshoot effectively.
The Evolution of Observability and Monitoring panel discussion Failover Conf 2021
New functionality for modifying server parameters in Pandora FMS
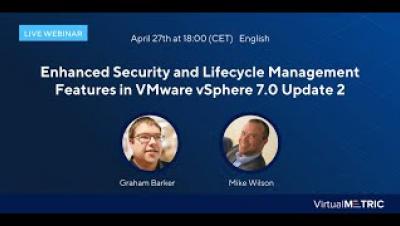
Enhanced Security and Lifecycle Management Features in VMware vSphere 7.0 Update 2
How an Experience Level Agreement can Benefit your Business
The success of a business is dependent on two key components: a quality product/service that is being offered and a team that can market and communicate about that product/service effectively. However, that team needs to first be able to communicate with each other to brainstorm and strategize. With many businesses still working on a remote or hybrid model because of the global pandemic, digital communication has become an invaluable part of productivity.
Searching through logs with the free and open Logs app in Kibana
Log exploration and analysis is a key step in troubleshooting performance issues in IT environments — from understanding application slow downs to investigating misbehaving containers. Did you get an alert that heap usage is spiking on a specific server? A quick search of the logs filtered from that host shows that cache misses started around the same time as the initial spike.
What Are AWS Lambda Triggers?
This is a basic introduction to Lambda triggers that uses DynamoDB as an event source example. We talk a lot about the more advanced level of Lambda triggers in our popular two-part series: Complete Guide to Lambda Triggers. If you want to learn more, read part one and part two. We’re going back to the basics this time because skipping some steps when learning something new might get you confused. It tends to get annoying, or it can even make you frustrated. Why?
Have Your Say in the new Idea Portal
Centralized Log Management for Multi-Cloud Strategies
The future of enterprise IT stacks is the cloud. In fact, according to a 2019 Gartner post, when we say “cloud infrastructure,” 81% of people really mean multi-cloud. Considering the analyst took this survey prior to the pandemic, we can safely assume that the number of companies with multi-cloud stacks is probably higher than this. Companies choose a multi-cloud strategy for a lot of reasons, including making disaster recovery and migration easier.
Fostering Exceptional Microsoft 365 User Experiences
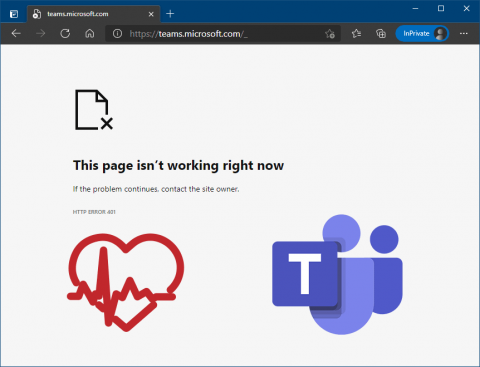
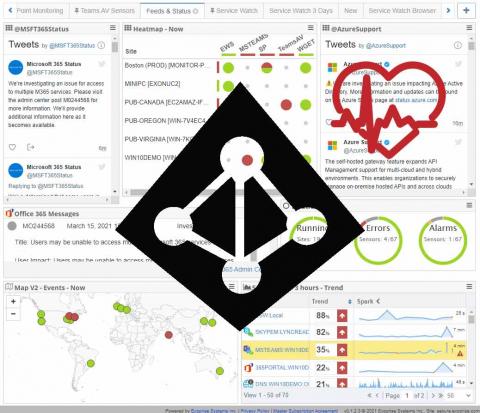
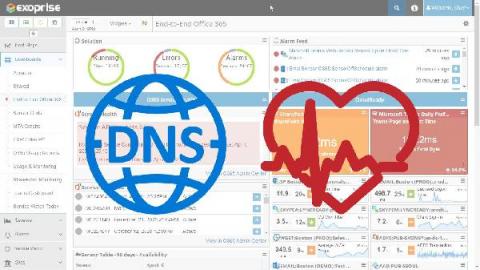
Microsoft 365 Teams Outage, April 27th, 2021
This early AM on the East Coast, Teams experienced an access outage. The Exoprise sensors detected this outage an hour before Microsoft published a report on the issue. Here’s an example of what you get when you attempt to sign in, fresh, to Microsoft Teams.
Launching RMM Central: A unified IT solution for managed service providers
We’re pleased to introduce ManageEngine RMM Central, a unified remote monitoring and management solution. Maintaining the IT infrastructure and systems of client networks is a herculean task for IT service providers. Multiple tools perform various capabilities in network management, be it maintaining or managing workstations, laptops, servers, and other networks.
Monitor cloud endpoint health with Datadog's cloud service autodetection
Your modern cloud-hosted applications rely on a number of key components—such as databases and load balancers—that are managed by the cloud provider. While these cloud resources can reduce the overhead of maintaining your own infrastructure, capturing and contextualizing monitoring data from services you don’t own can be difficult.
Catchpoint Announces Native Support for Google's Core Web Vitals
What's Changed in VMware vSphere 7 Update 2: All You Need to Know
VMware has recently released vSphere 7 Update 2, and there is a lot of new stuff to look out for. vSphere, VMware’s server virtualization product, has been an industry favorite for a long time. The vSphere 7 came out in April 2020, and this is so far the second update to it, hence the name. When you look at the changes they’ve rolled out, you’ll know that they are really focusing on some key areas. As a result, VMware infrastructure is getting pretty solid and modern.
GKE operations magic: From an alert to resolution in 5 steps
As applications move from monolithic architectures to microservices-based architectures, DevOps and Site Reliability Engineering (SRE) teams face new operational challenges. Microservices are updated constantly with new features and resource managers/schedulers (like Kubernetes and GKE) can add/remove containers in response to changing workloads. The old way of creating alerts based on learned behaviors of your monolithic applications will not work with microservices applications.
9 Best Cloud Logging Services for Log Management, Analysis, Monitoring & More [2021 Comparison]
Log management stopped being a very simple operation quite some time ago. Long gone are the “good old days” when you could log into the machine, check the logs, and grep for the interesting parts. Right now things are better. With the observability tools that are now a part of our everyday lives, we can easily troubleshoot without the need to connect to servers at all. With the right tools, we can even predict potential issues and be alerted at the same time an incident happens.
Benchmarking Grafana Enterprise Metrics for horizontally scaling Prometheus up to 500 million active series
Since we launched Grafana Enterprise Metrics (GEM), our self-hosted Prometheus service, last year, we’ve seen customers run it at great scale. We have clusters with more than 100 million metrics, and GEM’s new scalable compactor can handle an estimated 650 million active series. Still, we wanted to run performance tests that would more definitively show GEM’s horizontal scalability and allow us to get more accurate TCO estimates.
Introducing Datadog in 45 seconds
Introduction to error monitoring with Raygun
Raygun enables you to track errors in your web and mobile applications and set up a process to manage them. This guide will help you set up Raygun to build more stable software.
Introduction to cron job monitoring with Healthchecks
Software teams use cron jobs to handle many important tasks like database backups and maintenance scripts. Cron jobs make sure that your applications are behaving as they should, but cron job failures are often silent and not noticed until the problem becomes worse. In this guide, we will learn how to stay aware about cron job failures by using Healthchecks.
Five Reasons to Use Catchpoint for Measuring Core Web Vitals
We are in this together. As part of our continuous efforts to meet customer expectations, we have recently added Core Web Vitals to our performance measurement programs. We are happy to share that these metrics are now a native part of the Catchpoint Platform. DevOps’ SREs, Platform Operations Engineers, and business and monitoring strategists alike will realize a series of key benefits from this addition.
Getting Started with the Splunk Distribution of OpenTelemetry Java
Splunk Distro for OpenTelemetry is a secure, production-ready, Splunk-supported distribution of the OpenTelemetry project and provides multiple installable packages that automatically instruments your Java application to capture and report distributed traces to Splunk APM (no code changes required!), making it easy to get started with distributed tracing!
What is 802.1X Authentication?
Improve Your CMDB for Business Outcomes with Application Dependency Mapping
A configuration management database (CMBD) is a centralized repository that stores information about all the significant entities in your IT environment. These can include your hardware, installed software applications, documents, business services, and even the people who are part of your IT system. The CMDB is designed to help you maintain and support the interrelationships between the configuration items (CIs) within a vast IT structure.
Uncover How Your Employees Experience Their SaaS Applications in Real-Time
With employees depending on web applications every day, you can’t risk leaving anything to doubt when it comes to managing your IT estate. Although technology performance might appear “in the green” from IT’s perspective, how often are employees experiencing application outages or slowdowns you’re not aware of? Are they using that highly touted new app you rolled out – or avoiding it because of hidden usability problems?
How PayIt, a secure cloud service provider for digital government, uses Grafana and Prometheus for observability at cloud native scale
A trip to the DMV — and a realization that there had to be a better, more modern way for the system to work — sparked the idea for PayIt, a secure cloud service provider for digital government that launched in 2013. The company’s mission is to help state, local, and government agencies reach their constituents better and more effectively, shifting the reliance from in-office payments to digital ones.
How to Spend Less Time on Bugs and More Time on Features
Application Performance Management 101
Hybrid IT and Virtualized Workloads Preparing for a Shift to Microsoft Azure
10 Simple AWS Hacks That Will Make You Super Productive
Useful AWS hacks and tricks that will save you time and money. If you work a lot with AWS, you probably realized that literally, everything on AWS is an API call; hence everything can be automated. This article will discuss several tricks that will save you time when performing everyday tasks in the AWS cloud. Make sure to read till the end. The most interesting one is listed at the very end 😉
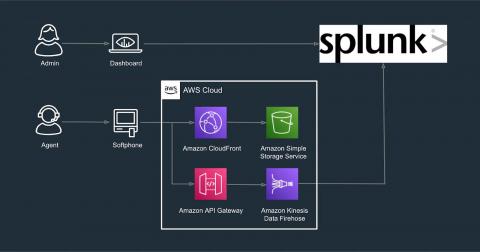
Splunk App for Amazon Connect: End-to-End(point) Visibility for an Optimal Customer Experience
How do you ensure a customer experience (CX) that leaves both participants of a conversation not just satisfied, but elated afterwards? And how do you do that, thousands of times over the course of a day and millions of times a year?
How to Optimize Website Performance
In a 2019 study from Milliseconds Make Millions by Fifty-Five and shared on Google’s official blog found several interesting insights on small speed increases. 37 brands qualified for study, after qualitative checks, with speed data measured via Google Lighthouse and aggregated against each brand’s Web analytics. The study targeted four key speed metrics. The results were fed into a Logarithmic Regression model to extract meaning.
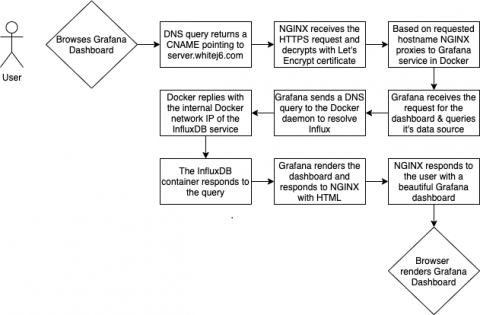
Deploying Services with Docker, NGINX, Route 53 & Let's Encrypt
Docker is a power tool for deploying applications or services, and there are numerous Docker orchestration tools available that can help to simplify the management of the deployed containers. But what if you are wanting to deploy a small number of services and not wanting to undertake setting up and managing another application stack just to run a handful of containers. I will cover how I deployed a handful of services on a single Docker host.
Top 7 Tools for Adding Web Forms to Static Websites
The power of the Internet and the World Wide Web is known to everyone. Within a few years after its inception, businesses started to take advantage of all the facilities in features. And within no time, e-commerce became prominent as a new way to do business. Nowadays, it is the dominant way any company or business can reach its customers across the globe with a website.
Website Monitoring Prices Compared
The comparison for 2021 has been completed. You can skip straight to the results for 2021, view the results for 2020 & 2019, or read on to see how we ranked the sites... We compared every available website monitoring service by price.
The State of Observability 2021: Key Findings
We at VMware Tanzu recently published our first-ever summary of the current state of observability. The main goal of our research was to uncover the key trends in observability adoption by hearing directly from IT practitioners, including DevOps teams, SREs, application architects, and their managers. We also wanted to understand what’s driving the popularity of observability and what the organizational impact of deploying observability is.
Dashboard Server: Working with the PowerShell tile
Amongst all the cool features of SquaredUp Dashboard Server, the coolest kid on the block is probably the PowerShell tile. The reason is simple – PowerShell is easy, it’s awesome, and it’s powerful! You can not only retrieve data from the source (like the APIs), but you can also manipulate that data, work with variables, loop it, filter it, and use it in whichever way works the best. Like they say, the things PowerShell can do are only restricted by the proficiency of the user.
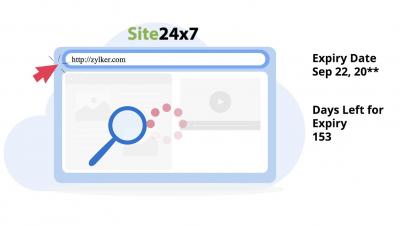
Domain expiration checks
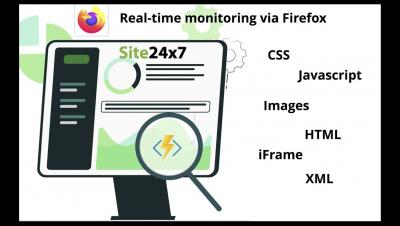
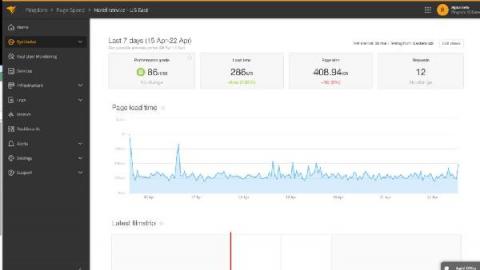
Monitoring static and dynamic websites using the Web Page Speed (Browser)
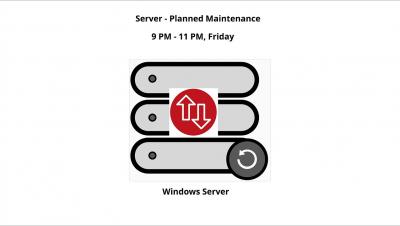
Mark downtime as maintenance
How to Build a Scalable Prometheus Architecture
When building distributed, scalable cloud-native apps containing dozens or even hundreds of microservices, you need reliable monitoring and alerting. If you’re monitoring cloud-native apps in 2021, there’s a good chance you’ve chosen Prometheus. Prometheus is an excellent choice for monitoring containerized microservices and the infrastructure that runs them — often Kubernetes.
Dynamic Observability: Troubleshooting Techniques for 2021
Securing Azure SQL Database, Part 3: Service Endpoints
Monitoring DNS Performance The Right Way With Catchpoint
The Domain Name System (DNS) is at the core of the engine that keeps the internet running. We have explained how DNS works and why it is critical to the functioning of the internet in our Synthetic Monitoring Guide. The DNS resolution relies on various components, such as the DNS resolvers, name servers, authoritative servers, and zone files, to function properly and the process typically takes milliseconds to complete.
How to monitor your web application availability
How do you execute an effective web application availability monitoring? All stakeholders should monitor to ensure that web app’s availability is not compromised. Great design and excellent user experience are put to waste if your web app is not accessible. Let’s establish first how web application monitoring works.
Email Infrastructure Monitoring Checklist
A lot of time and resources are invested in making sure your customers get your emails. This is where email infrastructure comes in handy. While you have limited control over user interaction with your emails, monitoring email infrastructure is in your hands. Email infrastructure usually consists of your server and domain configuration, server performance, IP address, mail agents, and more. And to make sure your email infrastructure is in perfect working order, you need to constantly monitor it.
Can I Send an Alert to Discord?
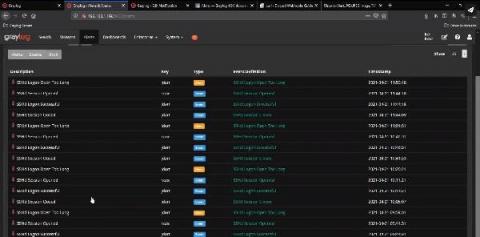
This is a great question. The answer is yes. You can send Graylog alerts via email, text, or Slack, and now Discord. Yes Discord! The growth and use of Discord has transformed from just many Gaming users to businesses using it as a communication platform. Many businesses like: Gaming Developers, Publishers, Journalists, Community and Event Organizers use Discord. Discord lets Gamer Developers work in teams with each other on their projects.
SaaS Life Isn't All Sunshine And Rainbows
2 Steps, Splunk ITSI & Citrix
Martello Powers Microsoft 365 Service Excellence
Enterprise Management Associates (EMA) recently developed a report examining the business case for IT end-to-end observability and control and delved into how digital experience management was at the intersection of Microsoft 365 services and IT. Below you will find some excerpts from their report that detail how Martello solutions are able to use digital experience monitoring to provide Microsoft 365 service excellence to our clients.
10 Benefits Of Virtualization In The Data Center
Are you looking for ways to improve your data center performance and resource utilization? Consider employing virtualization. Virtualization offers a cost-effective solution to satisfy the growing need for storage capacities and IT support required by most organizations. It is a process that allows you to scale up your physical resources to meet your increasing demands. You can virtualize physical servers, networking, storage, and other infrastructure components to enhance your data center operations.
Monitoring Ceph health with Prometheus
Monitoring Ceph with Prometheus is straightforward since Ceph already exposes an endpoint with all of its metrics for Prometheus. In this article, we will put it all together to help you start monitoring your Ceph storage cluster and guide you through all the important metrics. Ceph offers a great solution for object-based storage to manage large amounts of data even on economical hardware. Besides, the Ceph Foundation is organized as a direct fund under the Linux Foundation.
Monitor applications on GKE Autopilot with the GKE Dashboard
Elite software development teams automate and integrate monitoring observability tools more frequently than lower performing teams, per the Accelerate: State of DevOps report. Organizations that need the highest levels of reliability, security, and scalability for their applications choose Google Kubernetes Engine (GKE). Recently we introduced GKE Autopilot to further simplify Kubernetes operations by automating the management of the cluster infrastructure, control plane, and nodes.
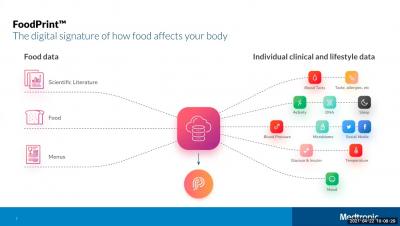
Webinar: How Medtronic Tripled Serverless Development Velocity
We've added first-class Windows support to Grafana Agent
The Grafana Agent team is happy to announce that Grafana Agent 0.14.0-rc2 includes improved Windows support. Up until now, running Grafana Agent — our tool for gathering metrics, logs, and traces — in Windows was difficult and not well supported for Windows best practices. In short, it was not a good Windows citizen. In the new release candidate, we’re making changes to improve the experience, based on feedback from GitHub issues, customer contacts, and our own experience.
Q&A With Forrester Senior Analyst Rich Lane
I recently had the honor of moderating a webinar featuring Forrester Senior Analyst Rich Lane and Steve Breen, Head of Managed Services at ANS, titled “AIOps for the Modern Enterprise: Real-World Advice & Implementation Tips from the Pros.” In this informative session, Rich and Steve talked about the importance of building AI and automation into business strategy and provided tips, tricks, and real-life examples of how modern organizations are using AIOps to drive positive business outc
Citrix CTP Shares How to Troubleshoot End User Experience Issues
Continuous Monitoring: What Is It and How Is it Impacting DevOps Today?
Continuous monitoring (CM), also referred to continuous control monitoring (CCM), is an automated process that allows DevOps teams to detect compliance and security threats in their software development lifecycle and infrastructure. Traditionally, businesses have relied on periodic manual or computer-assisted assessments to provide snapshots of the overall health of their IT environment.
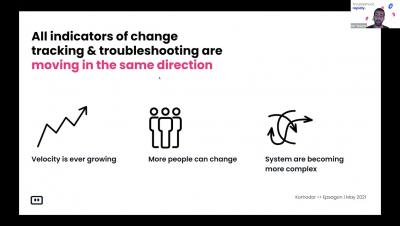
[Webinar] Observability and Resilience in Microservice Environments with Komodor & Epsagon
Optimizing Load Times on Apache Web Server on Digital Ocean With SolarWinds Pingdom
Choosing Azure Instances for Microsoft WVD: Community and Vendor Resources
In an earlier blog, we had discussed what is Microsoft Windows Virtual Desktop (WVD) and why it is gaining popularity. In this blog, we present various community and vendor resources that can help you choose the right Azure instances for your Microsoft WVD deployment. Here, at eG Innovations, we offer a wealth of monitoring and simulation tools to allow you to monitor what real users are experiencing when accessing Microsoft WVD.
DEM and secure connectivity vendor offerings: the fox & the henhouse
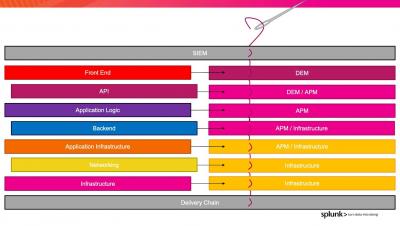
A typical service delivery chain starts from the device and runs through the network and all the way through to the application. There are many things that can go wrong along the way! It’s critical to monitor that experience and quickly understand where issues occur, why they occur, and what can be done to remedy them. That’s where employee and/or customer Digital Experience Monitoring (DEM) comes into play.
Proactive Monitoring in Digital Transformation Times
Pandora FMS is a proactive, advanced, flexible and easy-to-configure monitoring tool according to each business. Pandora FMS integrates with the needs of the business, being able to monitor servers, network equipment, terminals and whatever is necessary. In this article we will focus on monitoring using Pandora FMS, bearing in mind the new reality, which has arrived to stay, known as “Digital Transformation”.
The essentials of Windows event logging
One of the most prevalent log sources in many enterprises is Windows Event Logs. Being able to collect and process these logs has a huge impact on the effectiveness of any cybersecurity team. In this multi-part blog series, we will be looking at all things related to Windows Event Logs. We will begin our journey with audit policies and generating event logs, then move through collecting and analysing logs, and finally to building use cases such as detection rules, reports, and more.
Monitoring AWS EC2 with Splunk Observability
Today, much of our online world is powered by cloud computing, and Amazon Web Services offers an amazing depth and breadth of available services. However, most of the time it starts with Amazon Elastic Compute Cloud, EC2. EC2 is powered by virtual servers called instances and allows users to provision scalable compute capacity as desired. This means no server hardware investment and the ability to scale up or down in response to demand (thus elastic).
4 Steps for Investing in Telecoms Solutions & Employee Experience
After more than a year of remote work and video meetings, most people are ready to bid farewell to the days of collaborating with colleagues through their computer screens. Not so fast. The approaching end to the pandemic doesn’t mean an end to telecommunication as the primary form of workforce collaboration. According to a recent study: While some companies have embraced remote work as the new normal, most businesses are preparing for a hybrid workplace.
The 5 easiest ways to spot a fake website in seconds
Let me start by telling you a story about someone that couldn’t spot a fake website. I was speaking to my best friend two days ago, catching up over some now-allowed outside brunch when she dropped an absolute clanger on me.
Export API v2 - Streamline Large Log Data Exports
The LogDNA platform improves how teams use logs to help with debugging and troubleshooting. However, having fast access to actionable data isn’t the only value you can get from logs. There’s a lot of additional value in analyzing historical log data to understand long term trends. For example, customers can use log data as a way to represent audit events for user actions and benefit from visualizing them in a 3rd party software.
2 Steps v5 Demo
Monitoring in a Cloud-Native Era
Cisco AppDynamics Expands Global Software-as-a-Service Offering With Five New Locations
SolarWinds Improves Placement on Completeness of Vision Axis in the 2021 Gartner Magic Quadrant for Application Performance Monitoring
Detect unauthorized third parties in your AWS account
Detecting when an unauthorized third party is accessing your AWS account is critical to ensuring your account remains secure. For example, an attacker may have gained access to your environment and created a backdoor to maintain persistence within your environment. Another common (and more frequent) type of unauthorized access can happen when a developer sets up a third-party tool and grants it access to your account to monitor your infrastructure for operations or optimize your bill.
Trying Out OpenSearch with Logz.io
I’m excited to see our vision for an open source path forward for Elasticsearch and Kibana taking shape with OpenSearch! Since Elastic announced its intent to close-source Elasticsearch and Kibana, we’ve been working in full gear to have an open source path forward for these projects. This is our commitment to our users, this is our commitment to the community. We’ve collaborated with AWS and others to fork Elasticsearch and Kibana and create OpenSearch.
25 Ways to Monitor Your Site with An Uptime.com Free Trial
With a service as intricate as monitoring it’s nearly impossible to have all your questions answered just by exploring the product website. No matter how clear the pricing and feature descriptions are, it’s hard for a feature description to tell you if it can rise to every occasion your devops team will face. A free trial is an opportunity to connect with a service and test for your use cases.
How to Test Website Speed: A Step by Step Tutorial on Measuring Page Load Times the Right Way
It shouldn’t come as a surprise that website speed is important to your viewers. It’s the first thing they experience after accessing your website. Your website speed is like an unsung hero that you don’t really notice when it works the way it should, but the second it doesn’t live up to the expectations of your users, they will immediately notice it.
How to Ensure Superior End-User Digital Experience in the Age of Work from Anywhere
Audit logs in Site24x7
Proactively Monitor & Troubleshoot Microsoft Teams Issues on Citrix
Full-stack monitoring for code-to-cloud visibility
The 7 Hues of DevOps
Expanded SaaS Coverage Delivers Full-Stack Observability At A Global Scale
AppDynamics expands SaaS offerings with new strategic locations to increase flexibility of cloud deployments, accelerate digital transformation, and eliminate concerns related to regional data residency regulations.
Debugging Filters and Apply Rules using the Script Debugger
Have you ever been in a situation where something in your Icinga configuration did not work as expected and you ended up doing small changes and reloading Icinga over and over again? This can be especially tricky with apply rules and filters if they don’t match the objects you hope for. This post will show you how you can use the Icinga Script Debugger in this situation to get an interactive console in the context where the apply rule or filter is evaluated.
MITRE Engenuity ATT&CK Round 3: Carbanak + FIN7 vs. the free and open capabilities in Elastic Security
Whether this is the third time you are looking at the MITRE Engenuity ATT&CK® evaluation results or your first, you may be asking yourself: what was unique about this year’s evaluation? Well, let’s first start with: who is MITRE Engenuity? They are a tech foundation that collaborates with the private sector on many initiatives — most notably cybersecurity — and in recent years have become synonymous with cyber threat evaluations.
Getting started with free and open Elastic Observability
Unify and contextualize your logs, metrics, application trace data, and availability data behind a single pane of glass. Elastic Observability provides a unified view into the health and performance of your entire digital ecosystem. With easy ingest of multiple kinds of data via pre-built collectors for hundreds of data sources, Elastic Observability delivers seamless integration between the facets of observability.
How a customer turned digital transformation success with Elastic into a partnership opportunity
Our journey with Elastic began with a search for a single monitoring platform service for all kinds of applications and infrastructure across geographies and in the cloud. Like many other organizations who use Elastic, our story does not end there.
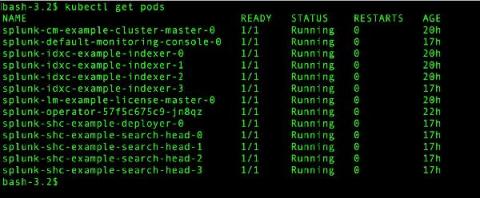
Going Live: Splunk Operator for Kubernetes 1.0.0
With everything going on in the world, it seems like a lifetime ago that we started talking about the Splunk Operator for Kubernetes, which enables customers to easily deploy, scale, and manage Splunk Enterprise on their choice of cloud environment. During that time, we’ve heard from an increasing number of on-premise and public cloud Bring-Your-Own-License Splunk customers that containerization and Kubernetes are an important part of their current and future deployment plans.
How to Find IP Addresses on a Network and Monitoring their Usage
Root Cause Analysis in IT: Collaborating to Improve Availability
The shift to remote work changed the way IT teams collaborate. Instead of walking over to a colleague’s desk, co-workers collaborate digitally. Looking forward, many companies will continue some form of remote work by taking a hybrid approach. Root cause analysis in IT will always require collaboration as teams look to improve service availability and prevent problems. Sitting in front of the same screen and looking at the same data makes it easy to discuss problems.
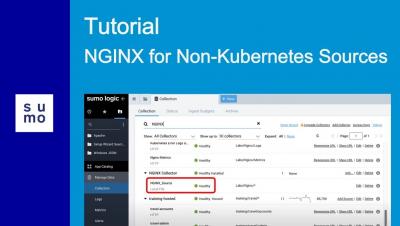
NGINX Ingress Controller Template
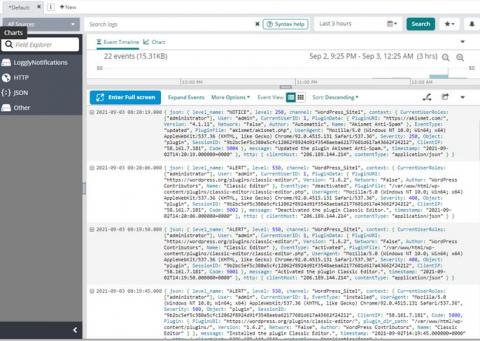
We set out with a plan this year to nurture and grow our developer ecosystem. In 2020, we launched our Template Library to empower joint users of LogDNA and our partners to have an out-of-the-box logging experience from every layer of their stack. As the use of these templates has grown, users have told us that they save them time from manually creating Views, Boards, and Screens, and helps them gain insight from their logs much quicker.
OpsRamp Study Reveals Why Enterprise IT Leaders Believe Digital Operations Management is Essential to Economic Recovery
Netreo Expands APM Capabilities with Strategic Acquisition of Stackify
How to monitor HashiCorp Vault with Datadog
In this series, we’ve introduced key HashiCorp Vault metrics and logs to watch, and looked at some ways to retrieve that information with built-in monitoring tools. Vault is made up of many moving parts, including the core, secrets engine, and audit devices. To get a full picture of Vault health and performance, it’s important to track all these components, along with the resources they consume from their underlying infrastructure.
Tools for HashiCorp Vault monitoring
In Part 1, we looked at the key metrics for monitoring the health and performance of your HashiCorp Vault deployment. We also discussed how Vault server and audit logs can give you additional context for troubleshooting issues ranging from losses in availability to policy misconfiguration. Now, we’ll show you how to access this data with tools that ship with Vault.
Debug Android crashes faster with Datadog
Technical issues, such as fatal crashes, are one of the biggest reasons why users uninstall mobile applications, so quickly identifying and resolving issues is vital for user retention. This can be challenging, particularly in the Android market, which has a wide variety of mobile devices and versions of the Android operating system. You need visibility into every issue so you can determine which crashes impact your application the most and efficiently resolve them.
NiCE Management Pack 3.3 for Microsoft 365 released
The NiCE Active 365 Management Pack for SCOM enables advanced monitoring for Microsoft 365, Teams, SharePoint, OneDrive, Exchange, and AAD Connect in hybrid environments. It ensures end-to-end control for your Microsoft 365 cloud and hybrid services. The new NiCE Active 365 Management Pack 3.3 release comes with great new features.
Using Coralogix + StackPulse to Automatically Enrich Alerts and Manage Incidents
Keeping digital services reliable is more important than ever. When something goes wrong in production, on-call teams face significant pressure to identify and resolve the incident quickly – in order to keep customers happy. But it can be difficult to get the right signals to the right person in a timely fashion.
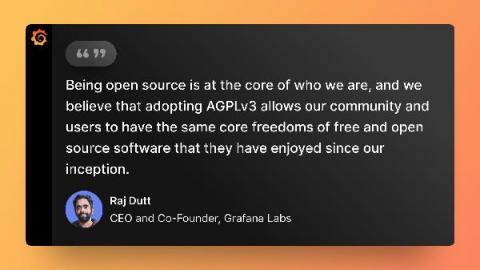
Q&A with Grafana Labs CEO Raj Dutt about our licensing changes
When Grafana Labs CEO and co-founder Raj Dutt announced to the team that the company would be relicensing our core open source projects from Apache 2.0 to AGPLv3, he opened the floor for discussion and encouraged anyone who had further questions to reach out. We believe in honesty and transparency, so we collected hard questions from Grafanistas, and Raj answered them for this public Q&A. The time felt right. As I’ve said publicly before, I’ve been thinking about this topic for years.
Grafana, Loki, and Tempo will be relicensed to AGPLv3
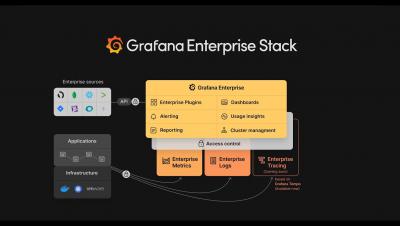
Grafana Labs was founded in 2014 to build a sustainable business around the open source Grafana project, so that revenue from our commercial offerings could be re-invested in the technology and the community. Since then, we’ve expanded further in the open source world — creating Grafana Loki and Grafana Tempo and contributing heavily to projects such as Graphite, Prometheus, and Cortex — while building the Grafana Cloud and Grafana Enterprise Stack products for customers.
What is Hyperconverged Infrastructure?
Hyperconverged Infrastructure is a unified system that combines computer network and storage in one easy way to manage virtualized systems. To give you a brief understanding, these systems have two major components hypervisors and storage controllers. To elaborate further, typically the hyper converged systems are available as fully integrated hardware appliances and a standalone software. The question now arises how does it work?
Silencing Distractions with Review List and Automations
Responding to and ignoring notifications can be a full-contact sport. It makes sense, though, from GitHub, Slack, to Jira and Sentry; our world revolves around robots telling us everything is important, critical, and urgent. Just like that, it’s near impossible to see what actually matters so you can solve quicker and more comprehensively.
Industry First Citrix Cloud Connector Module
Radnor, PA – April 20, 2021 – Goliath Technologies, a leader in end user experience monitoring and troubleshooting software, announced today they are introducing the industry’s first Citrix Cloud Connector Module. This new module monitors not only the health of the entire Citrix Cloud infrastructure but all Cloud Connectors as well.
Dash Studio: Building time-based comparison dashboards
Martello iQ | Service Analytics and Monitoring | Live Demo
Martello's 'Work from Anywhere' Monitoring Solutions
Application Monitoring with Spring Boot, Prometheus, and GroundWork Monitor
In our previous Blog, we introduced how we use Prometheus and the GroundWork Application Performance Monitoring (APM) connector to instrument a GoLang program to send metrics to GroundWork Monitor Enterprise. In this article, we continue with more Prometheus examples, but this time we demonstrate how to instrument a Java application with Spring Boot for easy monitoring.
We Want Your Ideas (Auvik Idea Portal)
The benefits and challenges of a single pane of glass
SCOM 2019 is a monitoring powerhouse. Its capabilities are unmatched. But it also has some serious issues when it comes to unearthing and visualizing the valuable data locked inside. The replacement of Silverlight with HTML5 in the SCOM 2019 web console was a welcome enhancement, but the SCOM web console still shares its design with the administration console, which is slow, complex, and makes it downright difficult to get the visibility you need.
Automated Root Cause Analysis (RCA) Steps And Processes
Get started with root cause analysis (RCA) for application performance. Learn how to implement an RCA process with easy steps and automation methods.
Outdated Calculus of Cloud Cost Containment
How to Find and Fix IP Address Conflicts
Stackify + Netreo Creates a Dev + Ops Powerhouse
TLDR: Stackify is joining with Netreo to bring best-of-breed solutions for developers and IT operations. Together, their observability platform can help both small development teams and the world’s largest enterprises manage and monitor their applications and infrastructure. Stackify has been working for the last 9 years to help software developers monitor and deb their productions applications.
Tailored Expansions Make Measuring Digital Work Easier for IT
Every IT environment is different. Some depend heavily on an efficient reactive support team, others need to manage a totally decentralized workforce, while some focus their resources on an infallible security and compliance team. Whatever your IT ecosystem looks like, you need to make sure you are taking into account the things that matter most to you, your IT department and your business at large.
DHCP server monitoring made easy with OpUtils
In today’s complex IT infrastructures, Dynamic Host Configuration Protocol (DHCP) servers play an indispensable role in automating IP allocation and configuration. A DHCP server’s capacity to allocate IPs to the requesting clients in real-time is one of the factors that ensures constant uptime of dynamic networks. However, even though a network’s availability depends on them, DHCP servers are often not closely monitored by IT teams.
Understanding the Page Speed Metrics in Google Lighthouse
If your experience is anything like mine, you're probably pretty confused about all the acronyms involved in checking your page speed. Chances are you probably also want to know which metrics matter, and if your score is good or bad. Table of Contents.
[Webinar] The role of log management in aiding observability in distributed systems
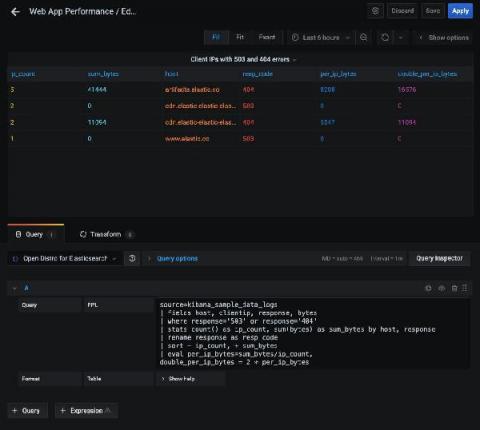
Introducing the new Open Distro for Elasticsearch plugin for Grafana, also available in Amazon Managed Service for Grafana
Back in December, Amazon Web Services (AWS) and Grafana Labs partnered to launch the Amazon Managed Service for Grafana in a preview to a limited set of customers. Amazon Managed Service for Grafana is a scalable managed offering that provides AWS customers a native way to run Grafana directly within AWS alongside all their other AWS services.
Logz.io Named a Leader in GigaOm Radar for Cloud Observability
Today we are excited to share a key milestone, not only for Logz.io, but also for our industry as a whole. For the first time ever, an industry analyst took on the ambitious challenge of analyzing and assessing several different markets including monitoring and telemetry, APM, AIOps, observability, and more. The radar also takes account of evaluating leaders’ various products, unveiling a comprehensive overview under the unified lens of Observability.
THWACK Livecast Series - Session 1: Keeping Your ISP Honest and Troubleshooting SaaS Applications
What Is Synthetic Monitoring and Why It's Important for Your Business
Vodafone Idea BGP Leak - Global Routing System Must Implement MANRS
At the end of last week, a significant BGP leak caused widespread network outages that impacted major network operators, cloud, and CDN providers. The incident on Friday, April 16th, 2021 was (yet another) classic origin hijack case from Vodafone Idea (AS55410), an Indian operator based in Mumbai and Gandhinagar. The Vodafone Idea ASN was inundated with traffic,13 times higher than average, leaving its users unable to access the internet.
Bridge the gap in your OSS by adding an AI brain on top
Telecom companies monitor their network using a variety of monitoring tools. There are separate fault management and performance management platforms for different areas of the network (core, RAN, etc.), and infrastructure is monitored separately. Although these solutions monitor network functions and logic – something that would seem to make sense — in practice this strategy fails to produce accurate and effective monitoring or reduce time to detection of service experience issues.
Dashbird becomes SOC 2 compliant
We are pleased to announce that as of 13th April 2021, Dashbird has successfully completed its SOC 2 Type 2 audit. SOC 2 engagements are based on the AICPA’s Trust Service Criteria. SOC 2 audit reports focus on a Service Organization’s non-financial reporting controls as they relate to the Security of a system. The audit was conducted by Dansa D’Arata Soucia LLP.
Up Close Monitoring with SignalFlow
It’s April, and that means it’s Mathematics and Statistic Awareness month. And in our everyday world of monitoring and observability, both play an ever-increasing role in how we keep track of our environments, both our apps and our infrastructure. Our world is no longer about just pinging the server/app to make sure “It’s alive!”.
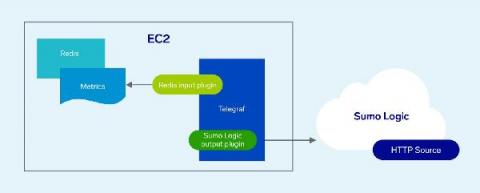
Using Telegraf to Collect Infrastructure Performance Metrics
How to Optimize JavaScript Performance
JavaScript is a common language in mobile and web app development. Due to its popularity, JavaScript optimization is becoming increasingly necessary for improving application performance. Let’s learn some of the challenges associated with JavaScript and how to optimize js performance.
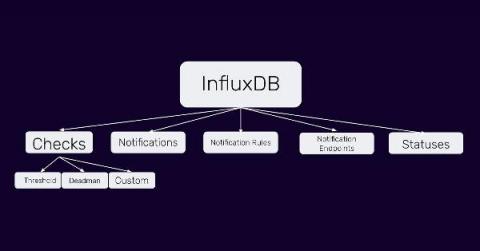
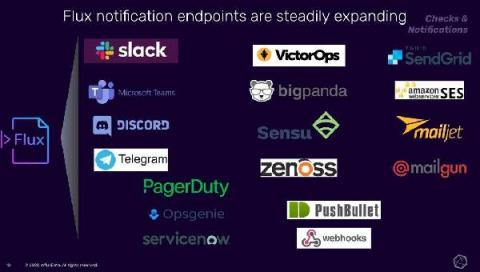
InfluxDB's Checks and Notifications System
InfluxDB 2.0’s Checks and Notifications system is likely the most powerful and flexible system available for creating alerts based on time series data. To get the most out of the system, it is helpful to understand the different pieces and how they fit together. After reading this article, you should be able to create precise alerting using the InfluxDB 2.0 User Interface (UI), as well as be able to extend and customize the system to suit your specific needs.
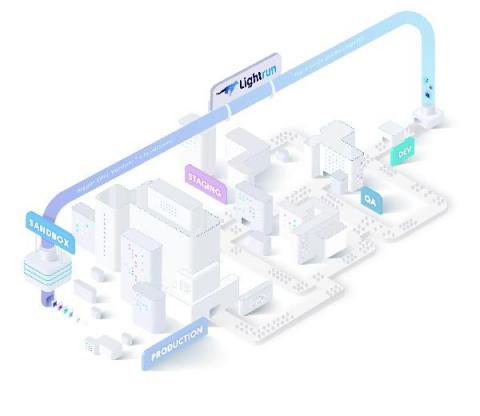
Announcing Lightrun Cloud: Shifting Left Observability, One Developer at a Time
We’re proud to announce the general availability of Lightrun Cloud – a completely free and self-service version of the Lightrun platform. We consider Lightrun Cloud to be a major milestone in our constant journey to empower developers with better observability tooling and welcome you to sign up for a free account.
How to connect code to customer - A deep dive into customer-centric monitoring
Self-hosting software & why it may be worth considering again now
Not all industries are the same in terms of the sensitivity of data they handle. And as you mature as a company, you need to be more careful of how you handle your critical data. With the advent of modern cloud native technologies & Kubernetes, on-prem software is more viable now.
Maximizing VMware Performance and Memory Utilization
VMware is one of the top virtualization software that allows you to create virtual machines and make the best use of your resources. One of the major focuses of virtualization solutions is to enable optimized use of resources like memory and computing power, but overcommitting your hypervisor towards greedy resource management can lead to severe degradation in the overall performance.
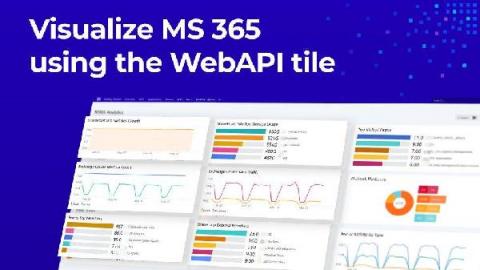
How to build insightful M365 Analytics Dashboards with SquaredUp and Microsoft Graph API (Part 2)
In the last blog post, I walked you through how to connect to the Microsoft Graph API so you can start pulling in the M365 analytics to create a dashboard in SquaredUp. In this blog post, I’ll walk you through exactly how to create this dashboard. This dashboard will allow you to monitor key metrics for Microsoft 365 SharePoint, Exchange Online, and Teams so you can be proactive in assigning storage.
The genesis of SigNoz - A full-stack open source observability platform
Why we felt there was a need for a full stack open source observability platform and how we went about building it.
How to start API monitoring with Checkly
APIs are the backbone of software products. Whether the APIs are customer facing or for internal use, making sure that your APIs are up and running is crucial. In this post, we will see how to get started with API monitoring with Checkly.
How to monitor your cron jobs using Cronitor
Cron jobs handle a lot of background plumbing that keep applications running smoothly. But cron job failures often go unnoticed and be disastrous for your users and business. To make sure that you are aware about cron job issues, you should use a cron monitoring tool. In this post, we will see how to get started with Cronitor to monitor your cron jobs.
Expanded SaaS Coverage Delivers Full-Stack Observability At A Global Scale
AppDynamics expands SaaS offerings with new strategic locations to increase flexibility of cloud deployments, accelerate digital transformation, and eliminate concerns related to regional data residency regulations.
Troubleshooting Firewall Issues in DigitalOcean
Announcing New Honeycomb Management API
Starting today, Honeycomb’s Management API is generally available to all Honeycomb users. The Honeycomb Management API is a set of endpoints that lets you programmatically set up, configure, and delete queries, datasets, derived columns, and more. With this release, you can now manage Honeycomb with configuration as code either directly via API or with third-party tools, like Terraform, using the community-contributed Honeycomb provider.
Up Close Monitoring with AWS Fargate
On our cloud-native journey, we live in a containerized world. Our environments are containers, managed by orchestrators, and living on some level of computing clusters. Of course, that means you are also responsible for managing all those bits, right?
Getting Started with the Splunk Distribution of OpenTelemetry Python
In our last blog, we introduced OpenTelemetry Python v1.0.0 and walked you through instrumenting a Python application and install both the OpenTelemetry API and SDK.
8 major websites that you won't believe went down in April
I don’t like to be the bearer of bad news, on the contrary, I think that the more we talk about website downtime, the more people that will be aware that it happens to the best of us. I’ve put together some of the most well-known companies in the world on this April’s downtime list so you can see for yourself just how easy it is for your website to go down, regardless of how many pennies are in the bank.
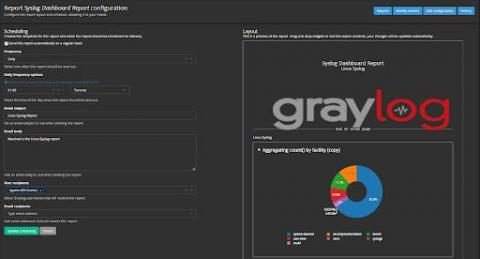
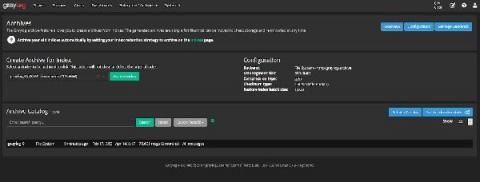
How Does Archiving Work in Graylog?
Every week we get many great questions through support, the community, social media, and our weekly demo. On Fridays, I like to share the most common questions and answers, tips, insights, a closer look at Graylog, interviews, etc. If you have any questions for me, drop them on Twitter, and I’ll do my best to fold them into upcoming Friday posts. Our handle is @graylog2.
How To Improve Survey Response Rates With Extortion
Logit.io Announce Platform Support For Open Distro For Elasticsearch
Dashboard Server: Working with the WebAPI tile
Now that we’ve familiarized ourselves with the basics, let’s get on creating our first dashboard! I spot an familiar tile here, the WebAPI tile. This tile is available in the SquaredUp SCOM and Azure products too. WebAPI tile is the way you bring external data into SquaredUp. As long as the tool you’re connecting to has an API endpoint that returns data in JSON payload, you can work with that data to display the data in a dashboard in SquaredUp.
Monitoring Nginx web server with Bleemeo
This blog article will cover how to monitor your nginx web server with Bleemeo, what is monitored and graphed by default and how to go further by configuring custom dashboards to have a global overview of your infrastructure.
Top 5 key metrics for monitoring AWS RDS
Monitoring AWS RDS may require some observability strategy changes if you switched from a classic on-prem MySQL/PostgreSQL solution. AWS RDS is a great solution that helps you focus on the data, and forget about bare metal, patches, backups, etc. However, since you don’t have direct access to the machine, you’ll need to adapt your monitoring platform.
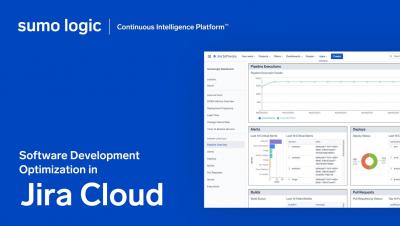
Software Development Optimization in Jira Cloud
Software Development Optimization for Atlassian
PagerDuty for Cloud Migration & Amazon CloudWatch Integration Workflow Demo
How to start error tracking with Rollbar
Rollbar is an error tracking product that monitors your applications for errors and helps you take action on them. Rollbar also integrates with other products so you can send the errors to project management tools, incident alerting tools etc. In this post, we will show you how to get started with error tracking using Rollbar.
How to track application errors with Bugsnag
Bugsnag is an error tracking tool that monitors exceptions in your applications and shows them in an easy-to-use dashboard. It also shows you the stability score to help you keep track of your application health. In this guide, we will learn how to use Bugsnag to monitor your software for errors.
Boost Sales Productivity With Endpoint Monitoring
If Salesforce is slow, your sales team productivity is slow. Being able to look up opportunities and close deals is essential to getting business in the door. A downtime or a slow loading application can disrupt the sales process. Such a delay can result in revenue loss and increased toil as your operations teams are in constant firefight mode.
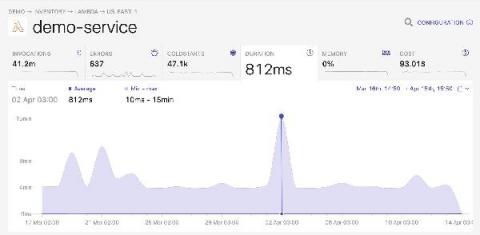
Performance Monitoring for AWS Lambda
Let’s start with what you should monitor in Lambda functions. In general, there are two areas – user experience and the cost of the system. User experience usually comes down to availability, latency, and feature set of a service, while the cost of operating a service is important to ensure the profitability of the business.
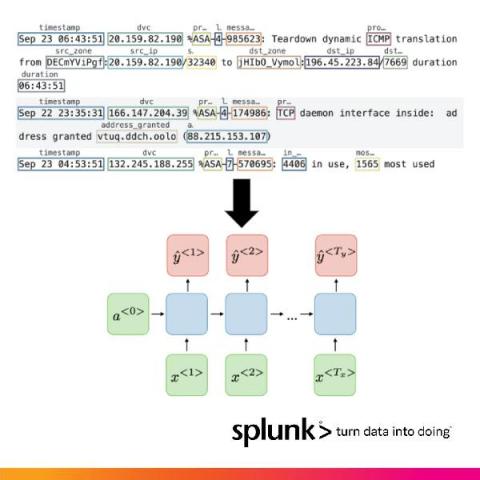
How Splunk Is Parsing Machine Logs With Machine Learning On NVIDIA's Triton and Morpheus
Large amounts of data no longer reside within siloed applications. A global workforce, combined with the growing need for data, is driving an increasingly distributed and complex attack surface that needs to be protected. Sophisticated cyberattacks can easily hide inside this data-centric world, making traditional perimeter-only security models obsolete.
New Splunk Synthetic Monitoring Features Help Integrate Uptime and Performance Across the Entire Splunk Platform
For teams that build or maintain modern applications with their end-users in mind, the acquisition of Rigor means that Splunk now offers the most comprehensive synthetic monitoring solution on the market. Rigor, now Splunk Synthetic Monitoring and Web Optimization, provides best-in-class synthetic monitoring capabilities enabling IT Ops and engineering teams to detect and respond to uptime and performance issues within incident response coordination and throughout software development lifecycles.
Logit.io's Response To The Elasticsearch B.V. SSPL Licensing Change
On the 14th of January 2021, Elasticsearch B.V. announced that future releases of Elasticsearch and Kibana would be released under a dual license SSPL (Server Side Public License). As a result of this change it is evident that the components that make up Elasticsearch and Kibana in version 7.11 (and onwards) of the ELK Stack will no longer be considered as open source based upon the Open Source Initiative's requirements for licensing.
Accelerate Incident Resolution By Benchmarks-enriched On-call Contexts
6 Data Cleansing Strategies For Your Organization
Honeybadger's Awesome Promo Video
Detect anomalous activity in your environment with new term-based Detection Rules
When it comes to securing your production environment, it’s essential that your security teams are able to detect any suspicious activity before it becomes a more serious threat. While detecting clear-cut attacker techniques is essential, being able to spot unknowns is vital for full security coverage.
Datadog receives a "Leader" distinction in Gartner's 2021 Magic Quadrant for APM
This week, Gartner published the 2021 Magic Quadrant for Application Performance Monitoring, which positions vendors according to their ability to execute and the completeness of their vision. This year, Datadog placed higher and further in both categories to move from our previous “Visionary” distinction, which we received the first time we were included on the Quadrant, into the “Leader” quadrant.
New Software Eliminates Guess Work in Troubleshooting and Documenting Remote Worker Issues
Radnor, PA – April 14, 2021 – Goliath Technologies, a leader in end-user experience monitoring and troubleshooting software, announced today new software with embedded intelligence and automation that will alert IT Pros of remote worker performance issues and visualize root cause for faster resolutions. Additionally, new end user forensic and experience analytics are available to support objective IT performance benchmarking and management reporting.
Profiles in Open Source: Dana Fridman & Contributing as a Product Designer
Dana Fridman is a design guru. Her contributions to UX at Logz.io are unmatched, and her input on upcoming updates to our app’s UI will be an achievement. But her portfolio is getting more than just Logz.io projects right now. As part of her work here, she is also making her mark on Jaeger. You see, Dana is the major design contributor to the open source Jaeger project. Open source contributions tend to be backend-focused and the domain of developers.
InfluxDB IOx Tech Talks: Replication, Durability and Subscriptions in InfluxDB IOx
How to build insightful M365 Analytics Dashboards with SquaredUp and Microsoft Graph API (Part 1)
It’s incredibly helpful to be able to visualize the data produced by your organization’s M365 tenant so you can manage licenses, usage, capacity, and more. SquaredUp dashboards are ideal for this. You can use the WebAPI Tile in SquaredUp to connect to the Microsoft Graph API, which offers a broad set of functionalities for working with Azure via code. Microsoft 365 sits on top of Azure and can be managed via Graph API, too.
How to tune a group in SCOM
Groups are key to managing and maintaining Microsoft’s System Center Operations Manager (SCOM). The typical way to assign an object to your group is by using its class to define the desired object. Once you set up a group you will then want to apply overrides so you can change the parameters or rules that govern that specific group.
Easily monitor your Tencent Cloud services with the new Grafana plugin
Plugins make it easier for Grafana users to get faster time to value. With a few clicks, you can start tapping into the different data stores you and your business already leverage — and see them all in one place in your Grafana dashboard. I’m a huge fan of partner-developed plugins for a few reasons, with my favorite being subject matter expertise. Who better to develop your plugin than the team that knows the product inside out?
How to install Pandora FMS in Docker.
Datadog On Agent Integration Development
Bits of Security, Security Panel
Bits of Security
How to Collect and Visualize Windows Events From 5 Hosts in 5 Minutes
If you’re investigating incidents on your Windows hosts, sifting through the Event Viewer can be a painful experience. It’s best to collect and ship Windows Events to a separate backend for easier visualization and analysis – but depending on the solution you choose, this can take some significant legwork. Often, this can require manually configuring a 3rd party tool or agent, just to get started.
The SolarWinds 5 Essential IT Tools Pack Overview
10x development speed with local serverless debugging
What's the Difference Between DevOps and DevSecOps?
DevOps vs DevSecOps: Learn the similarities and differences of each agile methodology and the essential processes involved.
Multi-Cloud Management: What Do You Need to Know For 2021?
This year, our team at Catchpoint put together the IT Monitoring Trends 2021 Report. We focus on seven key trends that will shape year two of our new, unstable normal. The goal: to help you as either a “boots on the ground” engineer or a C-level exec to know what to expect of the year ahead. We also share actionable best practices for how to shape your IT monitoring strategy. Multi-cloud and hybrid-IT management is one of the seven trends.
It's all about the tools, is it?
User Interface design or product design in general is less about tools than it is to have a proper understanding about the product you work on. And besides understanding, how the user is going to use your product, recognizing patterns and underlying relationships between key elements is crucial. Besides that, there are some tools, that really enable me to iterate quickly on ideas and concepts and then communicate these to the team.
Elastic named a Visionary in the 2021 Gartner Magic Quadrant for Application Performance Monitoring
We’re excited to announce that Elastic has been named a Visionary in the 2021 Gartner Magic Quadrant for Application Performance Monitoring. We are thrilled with the Visionary placement and believe that it validates our differentiated approach to delivering a modern application performance monitoring solution, powered by the Elastic Stack. Download the complimentary report to see how Gartner evaluates the market, and why they recognized Elastic as a Visionary in our first time participating.
Achieve Excellence in Continuous Testing by Knowing Your Product - Part 2
This is part two of a two-part series. If you have not done so, read Part 1. Achieving excellence in continuous testing is not just about mastering all the new tools, programming languages, and frameworks. It involves developing a deep understanding of the product you are testing. What follows are some additional tips that can help.
Lift-and-Shift Cloud Migrations: The Good, the Bad, and How To Avoid the Ugly
There are many paths to the cloud, and the one you choose depends on your particular digital transformation requirements and resources. About a decade ago, Gartner cleverly developed an alliterative nomenclature to describe five different migration strategies: the five Rs. That list has evolved over time and there a lot of 5-, 6-, and 7-strategy variations out there.
How to Parse Your XML Data with Telegraf
In March, we released Telegraf 1.18, which included a wide range of new input and output plugins. One exciting new addition was an XML Parser Plugin that added support for another input data format to parse into InfluxDB metrics.
InfluxData releases InfluxDB Notebooks to enhance collaboration for teams working with time series data
SAN FRANCISCO — April 14, 2021 — InfluxData, creator of the leading time series database InfluxDB, today announced the general availability of InfluxDB Notebooks, a new capability that improves communication for software development teams, ultimately enhancing productivity within InfluxDB Cloud. InfluxDB Notebooks is the first of the company’s new capabilities designed to make it easier for developers to collaborate around time series data within the platform.
Catchpoint Announces Virtual SRE Community Event on June 10
Ten Ways to Improve WordPress Page Speed
Page Speed is a pretty big deal these days. As of May 2021, Google will start combining Core Web Vitals (how Google measures page speed) with other UX-related signals to rank your page. In other words, Page Speed impacts your SEO. Since Google changed Googlebot's algorithm to highly favour fast, mobile-friendly websites, it has become more important to have a fast website.
How Does Internal Uptime Monitoring Work?
Your site or application runs on a server, which is just another computer inside some server warehouse. That server is subject to the same kinds of limitations as your personal computer, and you need a way to determine usage of those resources similar to the internal monitoring for disk space or CPU usage that you find inside a Windows or Mac operating system. These internal metrics collectively determine the power or capacity of your server.
Web Assembly Deep Dive - How it Works, And Is It The Future?
You’ve most likely heard of Web Assembly. Maybe you’ve heard about how game-changing of a technology it is, and maybe you’ve heard about how it’s going to change the web. Is it true? The answer to this question is not as simple as a yes or no, but we can definitely tell a lot as it’s been around for a while now. Since November 2017, Web Assembly has been supported in all major browsers, and even mobile web browsers for iOS and Android.
Why You Need to Closely Monitor Your Exchange Servers
Monitoring your on-prem and hybrid cloud infrastructure has always been important. With an ever-growing rise in cyber attacks, zero-day exploits, and insider threats, keeping track of your infrastructure has a renewed level of significance. Microsoft Exchange is one of the most prominent enterprise systems in use today, with both cloud and on-prem iterations.
Bits of Security, Snyk.io: Stranger Danger: Finding Security Vulnerabilities Before They Find You!
Bits of Security, PedidosYa: Fraud Detection using Datadog and Sherlock
Kubernetes Master Class - How to Update Monitoring After Upgrading to Rancher 2.5
The More You Monitor - What is AIOps?
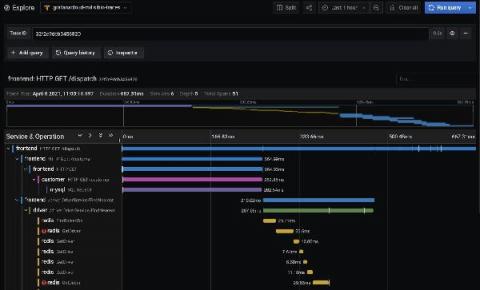
How to send traces to Grafana Cloud's Tempo service with OpenTelemetry Collector
As an open source company, we understand the value of open standards and interoperability. This holds true for Grafana Cloud and our managed Tempo service for traces, which is currently in beta. The Grafana Agent makes it easy to send traces to Grafana Cloud, but it is not required. In fact, Grafana Cloud’s Tempo service is exposed as a standards-compliant gRPC endpoint that conforms to the Open Telemetry TraceService with HTTP Basic authorization.
Cisco AppDynamics Is a Leader for the Ninth Time in the 2021 Gartner Magic Quadrant for Application Performance Monitoring
2021 Gartner Magic Quadrant for APM recognizes Cisco AppDynamics for our ability to execute and completeness of vision.
It's a Mad, Mad, Mad, Mad Multipath World
Optimizing Load Times on Apache Web Server on Digital Ocean With SolarWinds Pingdom
Department of Defense Designates Splunk a Core Enterprise Technology
Last month, as part of its continuing efforts to acquire and secure advanced technology for cyberdefense, data analytics and other mission critical operations, the Department of Defense (DOD) designated the Splunk Enterprise Software Initiative (ESI) Blanket Purchase Agreement (BPA) as a Core Enterprise Technology Agreement (CETA). Of the 100+ OEMs that have been awarded a DOD ESI BPA, only seven have been selected for CETA designation by the DOD.
Network Firewall Security: Monitoring Firewalls 101
TL;DR InfluxDB Tech Tips: Configuring a Slack Notification with InfluxDB
With InfluxDB you can create notifications to make the most out of your alerts. Notifications enable you to send check statuses to the endpoint of your choice. In this TL;DR we set up a Slack Notification Rule and Endpoint through the InfluxDB UI.
Datadog acquires Sqreen to strengthen application security
We began our security journey last year with the release of Datadog Security Monitoring, which provides runtime security visibility and detection capabilities for your environment. Today, we are thrilled to announce that Sqreen, an application security platform, is joining the Datadog team. Together, these products further integrate the work of security, development, and ops teams—and provide a robust, full-stack security monitoring solution for the cloud age.
What is External Monitoring and How does it Differ From Internal Monitoring?
You likely do not own your server, but you do have an interest in making sure the applications you run on your server remain responsive. You need to know the full story, and a combination of external and internal monitoring is how you get there. Marketers understand the word “responsive” to mean “capable of rendering on any screen”, but we can think about responsive in more fundamental terms.
The challenges of monitoring a highly complex database estate at the University of the Sunshine Coast
Maximize ServiceNow with Automated Remediation
Introduction to the SQL Monitor Demo Site
What is Hardware Asset Management (HAM)? Why is it Important?
Managing hardware assets, manually, from the time they are purchased to the time they are disposed of is a tedious, cumbersome task that is susceptible to many errors. These manual and scattered processes are often inaccurate and difficult to manage. Manual data keeping means that asset information is stored in silos, which raises the overhead expenses, increases the likelihood of asset theft and losses, and makes it hard to comply with the organization’s standards and regulations.
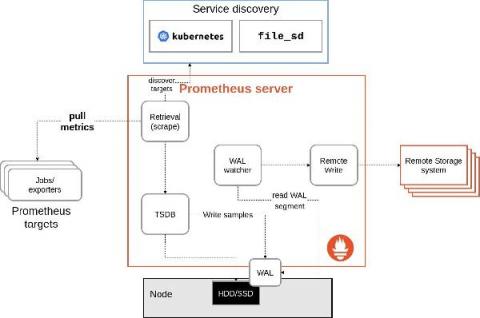
How to troubleshoot remote write issues in Prometheus
Prometheus’s remote write system has a lot of tunable knobs, and in the event of an issue, it can be unclear which ones to adjust. In this post, we’ll discuss some metrics that can help you diagnose remote write issues and decide which configuration parameters you may want to try changing. First, let’s discuss how remote write is implemented. In the past, remote write would duplicate samples coming into Prometheus via scrape.
Announcing OpenSearch: Doubling Down on Open Source
Today, I’m excited to officially announce our support for the OpenSearch project, the new fork of the Elasticsearch and Kibana codebases. As we previously shared, Logz.io has the utmost commitment to its customers and the community to ensure that these open-source technologies will prosper by being built for the community and guided by the community.
How to Take Data Stored in InfluxDB Cloud 2 and Use It in a "Switch" Node within Node-Red
Slow and Steady: Converting Sentry's Entire Frontend to TypeScript
Recently, Sentry converted 100% of its frontend React codebase from JavaScript to TypeScript. This year-long effort spanned over a dozen members of the engineering team, 1,100 files, and 95,000 lines of code. In this blog post, we share our process, techniques, challenges, and ultimately, what we learned along this journey.
How Important Are Application Performance Metrics to Mission Success?
How to Integrate Microsoft Teams and Netreo
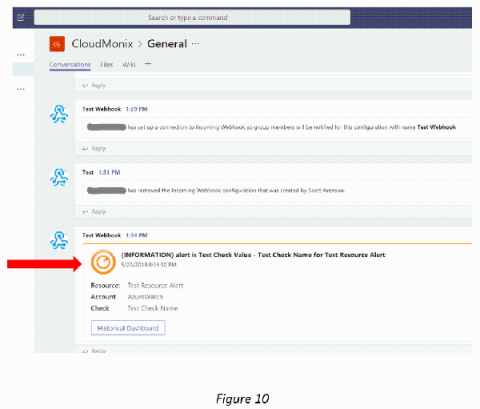
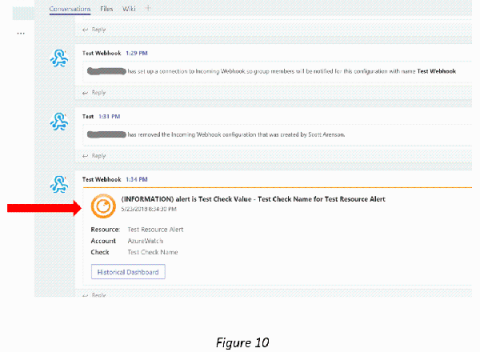
Netreo’s metrics, event monitoring, and notification capabilities can be extended to 3rd-party collaboration and messaging platforms for maximum operational efficiency. As outlined in our previous post, integrations with Netreo already include popular services such as Slack, PagerDuty, Jira, ServiceNow, and ZenDesk. Microsoft Teams is another messaging and collaboration application that enterprises are rapidly adopting.
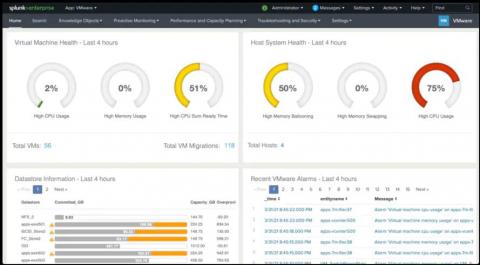
Monitor and Troubleshoot VMware Infrastructure with Splunk
Splunkbase apps are very popular among IT administrators and provide out-of-the-box content for different infrastructure types such as Windows, Unix, VMware, and AWS. As customers expanded their need for more infrastructure types, they historically had to manage and leverage multiple apps.
Splunk IT Essentials Work: A Centralized App for All Things ITOps
Splunkbase apps are very popular among IT administrators and provide out-of-the-box content for different infrastructure types such as Windows, Unix, VMware, and AWS. As customers expanded their need for more infrastructure types, they historically had to manage and leverage multiple apps. We have now introduced IT Essentials Work, one centralized app that provides a simpler way to monitor and troubleshoot across different infrastructure types without having to install and maintain different apps.
Why Python cProfile is the Recommended Profiling Interface
Performance optimization is a basic need for software development. When it comes to optimizing app performance, tracking frequency, maintaining production, or perpetuation method calls, profilers play a vital role. Learn why Python cProfile is a recommended profiling interface and how it enhances your software performance.
Wait, your IT team did that? 10 unique hybrid work saves
Although IT teams are called upon to deliver a lot these days, I doubt many are being asked to solve the type of post-2020 (read: weird) hybrid work scenarios depicted below. IT support tends to stick to its ‘bread and butter,’ they focus on things like network connectivity, application performance, cybersecurity, or onboarding for new hires—to name just a few.
Apigee API monitoring: Find and fix issues fast
Exoprise Featured in Latest Gartner Report
ThousandEyes Intelligence in AppDynamics Dash Studio Demo
Application Monitoring 101: How to set up and Monitor Performance in your Flutter Applications
Monitoring critical windows services processes
UptimeRobot April 2021 Update: Status pages and infrastructure updates
Following our latest updates, which, from now on, we’d love to share with you regularly, we’re happy to announce last month’s news. There’s always space for improvements while doing necessary maintenance, so let’s take a look at it.
Tutorial: Set Up a Linux Source
Three Ways MSPs Can Benefit From Dynamic Thresholds
People around the world depend on Managed Service Providers (MSPs) to keep their businesses running like clockwork, even as their IT infrastructure evolves. Keeping workflows efficient leads to higher profits, but this can be a challenge due to a mix of on-premise infrastructures, public and private cloud, and other complex customer environments. The shift to remote work in 2020 due to the COVID-19 pandemic has only made this more challenging for MSPs.
How Wix Monitors Mobile apps using Sentry
Resource check profile - Monitor Windows event logs and Linux syslogs
AppDynamics with Cisco Secure Application Demo
How to set up error tracking and alerts with Sentry
Sentry is one of the most popular error tracking tools, which monitors your application for errors and exceptions. Sentry also has an open source version of the product that you can host yourself, but today we will talk about their cloud hosted product.
An introduction to using Nastel with Amazon MSK
6 Best Bandwidth Monitoring Tools
Troubleshooting Firewall Issues in DigitalOcean
How to Monitor Router Traffic: 6 Router Monitoring Tips
How to Choose the Best Performance Profiling Tools
You finish writing your code and launch your application. Then, you begin experiencing performance issues. How can you fix this? It doesn’t matter how talented your development team is, every code should always be analyzed, debugged, and reviewed to make it run faster. What you need is a performance profiling tool. In this article, you will learn about performance profiling and how to determine the best performance profiling tools for your software.
How Can I Silence Alerts?
Yes, there is the ability to silence or disable alerts in Graylog. There are times in IT environments where you know you are going to generate specific events in your network. As an example, you are patching servers, upgrading hardware components, and many other things. These types of activities are very common during maintenance windows.
Are We Starting A Text Editor Holy War?
Bulk Update Multiple WebLogic WLSDM Settings via WL-OPC
When you need to change WLSDM WebLogic settings and you have so many WLSDM WebLogic domains, use the “WLSDM Configuration” page to standardize the bulk WLSDM WebLogic domains settings. WL-OPC prevents struggling with numerous tabs, unwanted confusion and saves your time with WLSDM Configurations Page! The “WLSDM Configuration” page has rich content and simple usage.
How to Extend your Monitoring with Automation and Scripting - VirtualMetric Webinar
Spring 2021 Upload
Not all the waves we make are extreme. This is our fancy way of saying that we’ve been making a lot of small, behind the scenes updates lately targeting improvements to reporting and performance. For a full rundown, check out our release updates.
Logz.io Debuts Multiple Tracing Accounts and Jaeger Architecture Visualization
Logz.io has pressed hard to align our tracing and metrics analytics capabilities over the past year. And as our technology advances, so does our service. We are announcing Multiple Tracing Accounts with Logz.io Distributed Tracing, aligning it with our logging and metrics tools. Complementing multiple data sources for metrics and logs, Logz users can segment their data according to sources and teams for better organization.
Network Packet Loss Triage Explainer
What You Need to Know About Logz io's Prometheus as a Service
How we use metamonitoring Prometheus servers to monitor all other Prometheus servers at Grafana Labs
One of the big questions in monitoring can be summed up as: Who watches the watchers? If you rely on Prometheus for your monitoring, and your monitoring fails, how will you know? The answer is a concept known as metamonitoring. At Grafana Labs, a handful of geographically distributed metamonitoring Prometheus servers monitor all other Prometheus servers and each other cross-cluster, while their alerting chain is secured by a dead-man’s-switch-like mechanism.
New Software to Support Users on Windows Virtual Desktop WVD
Getting Started with Spring Boot Actuator
Any production application needs to be monitored for its uptime. Let’s say you’ve developed a stock market statistics application, for example, using Spring Boot for your client. This application has to be up all the time while the stock market is open. If it’s down at a crucial time, it could mean huge losses for relevant stakeholders.
3, 2, 1 Liftoff! Launching Your ITSM Implementation
9 Best Network Discovery Tools
Top Observability Strategies for Distributed Systems
In a distributed IT environment, there are a lot of moving parts, and all of them need to be monitored to ensure everything is working as it should. The rise of more complex infrastructures interweaving the cloud, on-premises, and hybrid architectures makes this a challenge. To make sure you have adequate visibility, you need an IT observability strategy.
Improve Monitoring and Observability With The Catchpoint and Sumo Logic Integration
Sumo Logic is a cloud-based log management and analytics service that leverages machine-generated big data to deliver real-time IT insights. We’re excited to share that you can now easily integrate Catchpoint and Sumo Logic, giving you a number of fantastic benefits. The integration involves pushing data from Catchpoint to Sumo Logic using Webhooks and then query the data to build visualizations. Why do we use Webhooks?
Kafka Migration and Lessons Learned
Over the last few months, Honeycomb’s platform team migrated to a new iteration of our ingest pipeline for customer events. Our migration to this newer architecture did not go too smoothly, as can be attested by our status page since February. There were also many near-incidents where we got paged and reacted quickly enough to avoid major issues. We’ve decided to write a full overview of all the challenges we had encountered, which you can can download.
The great serverless cost debate (Serverless = Costless)
If you’re worried that switching to serverless infrastructure is too expensive for your business, you’re not alone. Total spending on cloud services will top $284 billion by 2024. The good news is there are many ways to track and lower your serverless operation costs without slowing down your business. Lambda and how can it help your business? Find out more by reading these Lambda frequently asked questions.
Tail your logs with Tailing Sidecar Operator
3 Smart Alternatives to Hot-Desking Your IT Team Should Try
After more than a year spent working from home, plenty of employees are actually excited to return to the office and see their colleagues face-to-face. But that excitement will quickly fade when they realize they have no place to sit. While some businesses will be staying fully-remote after the pandemic, others are preparing for a new era of hybrid work, where staff will split time between home and the office.
Introducing the Employee Experience and Digital Employee Experience Market Maps
Employee experience is one of the fastest growing IT markets today, and adoption of EX solutions is exploding. Every organization is competing on the strength of its workforce, which brings new urgency to questions like: These questions are at the heart of the employee experience market. But the market itself can be confusing. What is employee experience? What is an EX solution? There’s no standard definition and the term is often used in very different ways.
AI in the enterprise: Avoid hitting the infrastructure performance wall
AppSignal Now Monitors Koa and All Your Cascading Middleware
Koabamm! We now monitor Koa. This Node.js framework enables you to use cascading middleware, which can now also be shown in AppSignal. Let’s dive right in!
How to install Pandora FMS in Cloud environments
Have your say on the state of database monitoring in 2021
Monitor your SQL Server databases in the cloud and on-premises with one monitoring tool
Using Feature Flags in Sentry
From testing in production to running A/B tests, feature flags have a range of uses. At Sentry, one way we use feature flags is to safely allow beta access to new features for some of our “Early Adopter” customers. Because you can set multiple combinations of feature flags, every user is likely to have a different experience.
How to Ensure Successful Remote Support
In recent times, particularly during the pandemic, working remotely has become the new normal. Not only is it a need of the time, but employers have also started acknowledging the benefits of a remote workforce. Some of these include cost elimination of renting a workspace, access to a wider talent pool, and increased productivity. Furthermore, a better work-life balance also relates to higher employee satisfaction, loyalty and retention.
Application Monitoring 101: How to Setup and Monitor Performance in Android Applications
Application Monitoring 101: How to Setup and Monitor Performance in React Native Applications
Time Series Meetup: Monitoring Your ISP Using InfluxDB Cloud and Raspberry Pi
Why Monitoring Your SaaSs Could Lead to Better Sleep
SaaS or Software-as-a-Service make up a growing amount of business-critical functionality. Gone are the days of hosting every single application necessary to run a successful business. Everything from email hosting, financial systems, and human resources functions are all now done on SaaS-hosted platforms. The knowledge that all of this is out of your hands is both freeing and frustrating.
Maintaining Microsoft Teams Service Quality
When internal IT teams are responsible for ensuring service uptime, it becomes a challenge with cloud applications like Teams – especially when you don’t know the root cause of an outage. The reality for most organizations relying on Microsoft Teams and other Office 365 cloud services is that there’s an innate expectation that service availability is going to be met; Microsoft has enough redundant infrastructure to ensure they can meet their 99.9% service level agreement.
Getting started with the Lightun IntelliJ plugin
5 Best Network Uptime Monitoring Software
What is Windows Virtual Desktop?
Microsoft released its desktop-as-a-service (DaaS) offering, WVD (Windows Virtual Desktop), to the general public in September 2019. The service runs on Azure and provides a multi-user version of Windows 10, a feature unavailable for on-premises deployments of Hyper-V. WVD is a free service for Microsoft customers with most types of Windows 10 Enterprise license, however, the subscription or PAYG Azure costs are additional, as are many components you may wish to add.
Web Access Control Redefined
One of the focuses of version 2.9 of Icinga Web 2 will be on access control. For years on now, Icinga Web 2 had a very simple role based access control (RBAC) implementation. This suited most of our users fine. However, there were still some requests to enhance this further. The next major update of Icinga Web 2 (Version 2.9) and Icinga DB Web will allow users to configure exactly this.
Advanced Link Analysis: Part 2 - Implementing Link Analysis
Link analysis, which is a data analysis approach used to discover relationships and connections between data elements and entities, has many use cases including cybersecurity, fraud analytics, crime investigations, and finance. In my last post, "Advanced Link Analysis: Part 1 - Solving the Challenge of Information Density," I covered how advanced link analysis can be used to solve the challenge of information density.
Network Design and Best Practices
Workload Placement Is Science, Not Art
The terms “workload” and “application” are sometimes thrown around interchangeably, but they are not the same, and it’s important to understand the difference.
Extend AWS Observability Beyond CloudWatch
Work Anywhere: CloudReady and Service Watch
If you haven’t signed up for our upcoming April 21 Work Anywhere Webinar with Exoprise and Forrester, now is a good time. The webinar highlights the challenges that businesses face today due to Covid disruption and innovative solutions to mitigate these challenges. Millions of Americans now work from the comfort of their home using Microsoft 365, Teams, Zoom, and other critical SaaS application services for their daily activities.
SolarWinds Appoints Charles Damerell as Senior Director of UKI Sales
Catchpoint Releases Enhanced Version of the WebPageTest API
3 Successful customer-centric monitoring strategies
Monitor Azure Service Health events with Datadog
Azure Service Health continuously notifies you of issues that may affect the availability of your environment, such as service incidents, planned maintenance periods, or regional outages. We’ve recently enhanced our Azure integration to include additional support for monitoring Service Health issues, enabling you to keep tabs on the health of your Azure environment and take proactive measures to mitigate downtime.
How to Monitor RabbitMQ Performance: Tools & Metrics You Should Know About
Nowadays, most applications we build are composed of microservices and distributed in nature. In such a setup, communication between these microservices is crucial, but can, unfortunately, cause some headaches. The first thing I check when I’m troubleshooting a bug in production is inter-service communication. Having a reliable tool at your disposal to take care of this can reduce a lot of stress. RabbitMQ, a hybrid messaging broker, is one such tool.
Using NoSQL Databases as Backend Storage for Grafana
Grafana is a popular way of monitoring and analysing data. You can use it to build dashboards for visualizing, analyzing, querying, and alerting on data when it meets certain conditions. In this post, we’ll look at an overview of integrating data sources with Grafana for visualizations and analysis, connecting NoSQL systems to Grafana as data sources, and look at an in-depth example of connecting MongoDB as a Grafana data source.
What's the Most Powerful Tool in Your Security Arsenal?
Trying to work out the best security tool is a little like trying to choose a golf club three shots ahead – you don’t know what will help you get to the green until you’re in the rough. Traditionally, when people think about security tools, firewalls, IAM and permissions, encryption, and certificates come to mind. These tools all have one thing in common – they’re static.
How to Take Data Stored in InfluxDB Cloud 2 and Use It in a "Switch" Node within Node-Red
Nuxeo: Developing resilient services and delivering outstanding customer experiences with Datadog
Network Monitoring and Its Best Practices
All networks, no matter how sophisticated, are vulnerable to attack from outsiders. They can also face compromise from poor program integration, outdated software, lagging connections, and insufficient bandwidth. These issues impede the efficiency of your workforce and can frustrate clients who depend on reaching you through reliable communication methods. A technologically advanced network needs constant attention to run at peak efficiency.
Network Performance Monitoring: The Tools and Strategies
In this post, we are going to look at different tools and strategies for Network Performance Monitoring. To follow along with this blog article, make sure to book a demo and sign up for MetricFire's free trial where a lot of our customers are doing network performance monitoring using Hosted Graphite and Prometheus service. These tools are part of MetricFire’s offering.
Martello's 'Work from Anywhere' Monitoring Solutions
Application Monitoring 101: How to add Attachments to your Sentry Events
How Network Monitoring Takes Observability to the Next Level
With expectations around digital experience never higher, organizations should seriously consider implementing a network monitoring solution to support optimal business performance.
Everything you need to know about Office 365 Monitoring
Pandora FMS is a proactive, advanced and flexible monitoring tool which is also easy-to-configure according to each business and their needs. It can be integrated into all the needs of servers, network computers and terminals. Besides, in a world where the cloud has taken more prominence, it can also monitor its services or computers. In this article, we will focus on Office 365 monitoring from Pandora FMS using the module available in the Enterprise library.
How to Solve 6 Common Browser Incompatibility Issues
You have spent a small — or perhaps a large — fortune on your website, and now you’re ready to reap the rewards. You can picture it now: delighted visitors gushing about speed, performance, features, and functions. Except…that’s not happening. Instead, visitors are running into browser compatibility issues — which means instead of moving forward on the buyer’s journey, they are heading straight to a competitor. That’s the bad news.
Best Practices For Logging In AWS Lambda
Today, we’ll cover some of the ways you might find quite useful in your everyday work. We’ll go through some of the logging best practices in AWS Lambda, and we will explain how and why these ways will simplify your AWS Lambda logging. For more information about similar topics, be sure to visit our blog. Let’s start with the basics (and if you have the basics covered, feel free to skip ahead): How does logging work with AWS Lambda?
Network Integration: Moving from Reactive to Proactive with Mature Processes
How to monitor a Windows server with StatusCake
We often get requests from our customers on how to monitor a Windows server or workstation with StatusCake. So today I wanted to take you through a great method of doing this that you should be able to set up in just a few minutes on a Windows 10 workstation, or Windows server. We provide this coverage using the PUSH variant of our uptime monitoring – a type of reverse monitoring that requires the device to contact us in order to demonstrate downtime.
2 Steps Android Demo
Lighthouse Performance Metrics: What They Are & How to Improve Them
Google has made page speed a ranking factor in mobile searches for quite sometime now. Thus measuring performance has become a key part of any web development project. Performance, accessibility and general SEO best practices are major factors in search engine rankings. Your site's performance can have a big impact on how it is perceived. It can be stated as how fast a website is, or how good the user experience is with the site.
14 Alternatives to Monitis for Ping and Web Monitoring
Monitis, once a stand alone monitoring solution, has become Teamviewer Web Monitoring. If you don’t like or don’t need the changes offered you may be looking for alternatives to Monitis. Monitoring is integral to your growing suite of web and application monitoring, and it can be difficult to find a replacement that will do everything you need in one software.
Kubernetes Logging Simplified - Pt 2: Kubernetes Events
In my first post in the Kubernetes Logging Simplified blog series, I touched on some of the ‘need to know’ concepts and architectures to effectively manage your application logs in Kubernetes – providing steps on how to implement a Cluster-level logging solution to debug and analyze your application workloads. In my second post, I’m going to touch on another signal to keep an eye on: Kubernetes events.
Tutorial: Setting up NGINX for non-Kubernetes Sources
Bulk Update Multiple WebLogic WLSDM Settings via WL-OPC
CMMC compliance with EventSentry
Using Telegraf plugins to visualize industrial IoT data with the Grafana Cloud Hosted Prometheus service
One of the biggest challenges with data visualization for complicated software systems is getting quick access to the underlying data and connecting it to some form of cloud-hosted solution. Traditionally it has required quite a bit of middleware and upfront setup with additional tooling.
Conquering the Next Normal: Monitoring Techniques to Keep Up With the Pace of Change in 2021
Lightrun Launches Lightrun Cloud: Free Debugger for Developer-Native Observability
Lightrun, the continuous debugging and observability company, today announced the release of a free, self-service version of its popular debugging solution for developers. Lightrun Cloud is not only the most powerful debugger a developer can use to troubleshoot production applications live from within the IntelliJ IDE – but also the easiest to set-up, with a complete self-service experience that gets developers up and running in less than five minutes.
What's New Pandora FMS 753
Let’s check out together the new features and improvements related to the newest Pandora FMS release: Pandora FMS 753.
Splunk Developer Spring 2021 Update
The cold season is hopefully coming to an end, and Spring is here! And just like the changes in the seasons, we have a new SDK release, updated developer docs, and other signs of new growth! It’s a great time to update your apps using the latest SDKs for the latest Splunk Cloud and Splunk Enterprise releases. Plant your session proposal in the .conf21 Call For Speakers! It's also time to prune away some older jQuery and Python versions support. Read on for the latest news.
AWS Monitoring Challenges: Avoiding a Rube Goldberg Approach to AWS Management [VIDEO]
Node.js Server Monitoring: A How to Guide
Node.js is one of the most popular Javascript frameworks in 2021. With the increasing demand for Node.js comes the crucial next step of Node.js server monitoring. The best way to monitor your Node.js server is with an Application Performance Monitoring (APM) tool. Keep in mind, Node.js server monitoring is a bit of a tricky task, and there are particular challenges you should be aware of. But don’t worry because this how-to guide will walk you through it step-by-step.
How InfluxDB Works with IoT Data
Over the past few years, the IoT community has embraced InfluxDB as a cornerstone of the solutions they build. Whether modernizing or greenfield, InfluxDB has helped many in working with vast quantities of sensor and device data as we continue to deliver on our promise of time to awesome for IoT.
What are Data Center Monitoring Best Practices?
Efficient Data Center monitoring and management supports our digital economy. As a result, operation and protection of the Data Center are critical. For reliable and safe monitoring, transparency is of utmost importance. But it is surprising to witness that one of the least explored area in data center network establishment is monitoring. This is ironic because at its core, a network has two goals: 1) Get packets from A to B 2) Make sure packets are received from A to B.
Web Server Monitoring Your Application on Nginx with Logz.io
A big topic of interest nowadays is web application monitoring. Application performance monitoring and log analytics are required by businesses of all sizes to ensure their web applications’ smooth operation. If your application serves as the backend for your business processes, it is critical for your organization. You need to know, in real-time, when and why it breaks. To answer these questions, we will use Logz.io products to monitor a simple web application served by Nginx.
How to Be the Hero (Company) They Need AND Want (To Work At)
Splunk > Clara-fication: Dashboarding Best Practices
So you want to build a better dashboard, do you? Well good, you’ve come to the right place! Splunk dashboards are amazing. They are incredibly versatile and customizable. The creation of a dashboard is incredibly simple and can be done all through the UI. If more in-depth customization is required, that can be done through the SimpleXML using HTML panels, in-line CSS, or by uploading a new app from Splunkbase or custom JS/CSS.
Getting Started with OpenTelemetry Python v1.0.0
Since the OpenTelemetry Tracing Specification reached 1.0.0 — guaranteeing long-term stability for the tracing portion of the OpenTelemetry clients, the community has been busy working to get the SDKs and APIs for popular programming language ready to be GA. Next in our ‘Getting Started with OpenTelemetry’ Series, we’ll walk you through instrumenting a Python application and install both the OpenTelemetry API and SDK.
Monetizing Free Users And Recapping MicroConf
Microsoft 365 Outage, March 15th 2021
Exoprise CloudReady provides early detection of mission-critical mail outages. On March 15, Microsoft had a service outage worldwide that impacted its services such as Teams AV, Yammer, OneDrive, and Azure Active Directory. Users reported not being able to login into either of these services and were getting timeout messages. Exoprise detected the issue earlier at 3 pm EST (40 mins before Microsoft reported it) and was able to immediately relay the news to its customer base.
The Unprecedented Transformation of IT Goals in 2020
Azure DNS Outage - April 1st, 2021
Just about 2 weeks after its most recent outage, Microsoft experienced a severe DNS outage Thursday Evening at approximately 21:30 UTC on 01 Apr 2021. That’s the official start of the outage from Microsoft. But we all know that official starts and actual starts are often different. Exoprise DNS and server monitoring caught the error about 10 minutes earlier (not our biggest amount of headroom for an outage) but that is frequently the nature of DNS failures.
Debugging in PHP
PHP is a great language to start with when you are learning how to code. It has a simple syntax, it’s easy to learn and you can make dynamic websites with it. But even though it’s easy to write PHP code, it’s not always easy to debug. There are a lot of tools out there that can help you, but since PHP is an interpreted language, you can also use a couple of debugging techniques to help you find bugs in your code. In this blog post I'll cover the the following sections.
How Should your Business Approach Multi-Cloud Adoption?
The year 2020 can be seen as a major win for cloud infrastructure, even though it has been a tough year socioeconomically. Even before the pandemic, experts predicted that 83 percent of workloads of enterprises would be residing in the cloud by 2020. Now, as more enterprises are going full cloud, they are considering multi-cloud. As more people work from home, cloud computing is becoming more of a necessity. For a decade now, companies have been using the cloud for daily activities and communication.
Press Release: Scout APM Raises $8M; acquires ExceptionTrap
Camber Partners, a private equity firm focused on product-led SaaS companies, announced that it has completed an investment in Scout APM, a leading provider of Application Performance Management (APM) software. Scout APM helps developers and application administrators gain insight into their software’s performance by providing monitoring of key metrics surrounding web-application performance.
You should know about... these useful Prometheus alerting rules
Setting up Prometheus to scrape your targets for metrics is usually just one part of your larger observability strategy. The other piece in the equation is figuring out what you want your metrics to tell you and when and how often you should know about it. Thankfully, Prometheus makes it really easy for you to define alerting rules using PromQL, so you know when things are going north, south, or in no direction at all.
Analyze your GKE and GCE logging usage data easier with new dashboards
System and application logs provide crucial data for operators and developers to troubleshoot and keep applications healthy. Google Cloud automatically captures log data for its services and makes it available in Cloud Logging and Cloud Monitoring. As you add more services to your fleet, tasks such as determining a budget for storing logs data and performing granular cross-project analysis can become challenging.
How to Add SaaS API Monitoring to LogicMonitor
SaaS or Software–as-a-Service is a term that describes many applications on the web today. Whether you’re using TurboTax (tax season is coming up) or Twitter, most people use SaaS platforms on a daily basis without even realizing it.
How to Detect Memory Leaks in Java: Causes, Types, & Tools
A memory leak is a situation where unused objects occupy unnecessary space in memory. Unused objects are typically removed by the Java Garbage Collector (GC) but in cases where objects are still being referenced, they are not eligible to be removed. As a result, these unused objects are unnecessarily maintained in memory. Memory leaks block access to resources and cause an application to consume more memory over time, leading to degrading system performance.
Netdata 1.30.0
We’re excited to introduce Netdata 1.30.0. The ACLK-NG is a new, faster method of securely connecting a node running Netdata to Netdata Cloud. In our internal testing, it’s 4x faster than our previous implementation, which uses libmosquitto and libwebsockets.
Resolve Network and VPN Performance Problems Faster with Endpoint Monitoring
IT professionals are now adapting to remote environments and learning to manage a distributed, homebound workforce. In recent conversations with IT pros, many have cited that connectivity/VPN and home network issues are their top challenges but they lack the visibility to diagnose and troubleshoot these problems. Catchpoint for employee experience monitoring gives IT teams what they need: visibility from remote users’ devices to any business-critical application across any network.
Introducing Stackoscope For Serverless Applications
Here at Lumigo, we are focused on helping customers succeed with serverless and make it easier for them to build and run serverless applications in production. We love serverless and operate one of the largest serverless systems out there as we ingest and process billions of events from our customers. One thing many customers have asked us for help with is to identify misconfigured resources or places where they can improve by following best practices.
When to use Docker on AWS Lambda, Lambda Layers, and Lambda Extensions
2020 was a difficult year for all of us, and it was no different for engineering teams. Many software releases were postponed, and the industry slowed its development speed quite a bit. But at least at AWS, some teams released updates out of the door at the end of the year. AWS Lambda received two significant improvements: With these two new features and Lambda Layers, we now have three ways to add code to Lambda that isn’t directly part of our Lambda function.
Virtana Awarded 'Customer First' Status by Gartner for ITOM (IT Operations Management); Receives All 5-Star Reviews
The Virtana team are excited to announce that we have pledged to be a Customer First vendor in the ITOM (IT Operations Management) market for our product(s): VirtualWisdom, CloudWisdom, Virtana Platform, Virtana Migrate (Cloud Migration Readiness). Our team takes great pride in this program commitment, as customer feedback continues to be a critical priority, and shapes our products and services. Everyone at Virtana is deeply proud to be part of the Customer First program.
Explore NGINX usage, performance, and transactions to increase customer experience
4 Tips for a Productive Digital Workplace
What does a productive digital workplace look like? For many companies, that question isn’t easy to answer. Even before 2020, enterprise business leaders have been exploring the many benefits of bolstering their digital workplaces with smart technologies and IT practices. That last figure is particularly revealing: almost all businesses are aware of the importance of digital workplaces, but less than half are taking steps to create an effective one.
What Should You Do When You Receive Event Log Monitor Alerts?
When you are installing PA Server Monitor, you will need to configure what occurs when there are event log monitor alerts. You typically set this up during the initial install. However, it is not uncommon to want to make changes and updates or even add new events to your server monitoring software as you become more familiar with it.
Monitoring Your Website's Accessibility
Web accessibility is a vital aspect of search engine optimization (SEO) and overall user experience (UX). Maximizing the effectiveness of both is dependent upon how accessible your site is. With 5G wireless technology changing the expectations of website monitoring, you need to be even more aware of how accessibility influences your results. Tracking web accessibility metrics doesn't have to be complicated.


