

|
By Lionel Porcheron
Modern applications are distributed, ephemeral and built from a dozen moving parts. To keep them reliable, you need real visibility: not just “is the server up?”, but“how is this request behaving, right now, across every component it touches?”. The good news is that the observability world has converged on a handful of open standards.

|
By Lionel Porcheron
Monitoring a single server should not require running four daemons. Yet the default open-source recipe for “I just want to watch this one box” still looks like this: install node_exporter, stand up a Prometheus server to scrape it, add Grafana to draw the graphs, and bolt on Alertmanager so you actually hear about a full disk. That is a lot of moving parts — and a lot of YAML — for one machine. This post shows a lighter path.

|
By Lionel Porcheron
Prometheus has become the gold standard for monitoring cloud-native applications. But running Prometheus at scale comes with significant operational overhead. Let’s explore why a managed Prometheus solution might be the right choice for your team.

|
By Clement Cavanier
Kubernetes has become the de facto standard for container orchestration, but monitoring a Kubernetes cluster can be challenging. In this guide, we’ll walk through the essential steps to set up effective monitoring for your Kubernetes infrastructure.

|
By Lionel Porcheron
Infrastructure monitoring has evolved dramatically over the past decade. What started as simple uptime checks has grown into sophisticated observability platforms. This comprehensive guide covers everything you need to know about infrastructure monitoring in 2024.

|
By Tom Pillot
The Bleemeo Community Edition is the Open Source and self hosted version of the Bleemeo monitoring solution. It is composed of three main components: And some third party components: In this article, we will show you how to install and configure these components to have a fully working monitoring infrastructure.

|
By Tom Pillot
CrowdSec is an open-source software that allows you to detect peers with malicious behaviors and block them from accessing your systems. It benefits from a global community-wide IP reputation database. Attckers can then be prevented from accessing your resources by deploying bouncers. They are in charge of acting upon actors that triggered alerts: they can block the attacking IP, serve a 403 Forbidden response, and much more.

|
By Florian Gabon
As of today, Bleemeo is not ingesting logs file, but you can use some external tool to ingest logs metrics which should be pretty useful as it will help you to identify issues and trigger an alarm. You will still have to connect to the machine to check logs, but trends and alarms are centralized in your favorite monitoring tool.

|
By Florian Gabon
Most of existing solutions for SNMP monitoring need you to configure complex dashboards. With Bleemeo, you can start in 30s to monitor your existing SNMP equipments. You need to add an extra component that will be in charge of fetching metrics of all your network equipments.

|
By Florian Gabon
This article will cover. how to configure RabbitMQ with Bleemeo to automatically collect metrics, and
how to configure a dashboard to better understand your server and what's going on with Custom dashboards.

|
By Bleemeo
Monitor from multiple locations in the world your website and external services. Simple connection check or more elaborated scenarios are available in Bleemeo.

|
By Bleemeo
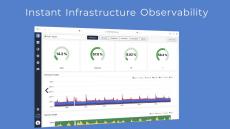
Visualize your infrastructure, containers and applications metrics and status with Bleemeo Real Time Dashboards.

|
By Bleemeo
In case of infrastructure incident receive email, Slack, HipChat, SMS, PagerDuty notifications with Bleemeo.
|
By Bleemeo
Monitoring setup can be complex and time consuming. Focus on your business and try Bleemeo: in 30s get automatic real time dashboards and complete monitoring of your servers, containers and application stack.

|
By Bleemeo
Quick introduction to Bleemeo, an Easy Monitoring for Scalable Infrastructure solution.
- June 2026 (2)
- December 2025 (1)
- October 2025 (1)
- January 2025 (1)
- February 2023 (1)
- December 2022 (1)
- September 2022 (1)
- March 2022 (1)
- December 2021 (1)
- November 2021 (1)
- July 2021 (1)
- May 2021 (1)
- April 2021 (1)
- March 2021 (3)
- October 2020 (1)
- September 2020 (1)
- August 2020 (3)
- May 2019 (1)
- April 2019 (1)
- July 2018 (1)
- July 2017 (2)
- June 2017 (2)
- April 2017 (2)
- March 2017 (1)
- February 2017 (1)
- October 2016 (1)
- August 2016 (2)
Infrastructure Monitoring made easy: no more endless repetitive configurations. Integrate Monitoring in your stack and collect server, containers and applications metrics.
The Bleemeo solution supports Linux (Ubuntu, CentOS, RedHat) and Windows systems. More than 50 services are automatically monitored and metrics from AWS managed services (RDS, DynamoDB, etc.) can be incorporated. System metrics (for physical and cloud servers), services (database, web server, etc.), containers are detected and monitored without any manual configuration.
Bleemeo in a Nutshell:
- 30 seconds from signup to first dashboard without manual configuration.
- Bleemeo agent auto-discovers services and create checks and metrics.
- Real time dashboards with 10s data refresh.
- Elastic infrastructures support with Stack Monitoring.
- Get automatic dashboards or build custom dashboards with metrics that matters.
- Integrate your business metrics with Graphite, StatsD or Prometheus.
- Uptime monitoring from multiple locations in the world.
- Open Source Bleemeo Smart Agent auto-discovers services and securely upload data to Bleemeo Cloud platform.