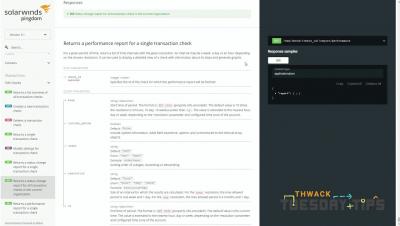
Microsoft Teams notifications now available in Oh Dear
We've added Microsoft Teams notifications to Oh Dear for uptime, certificate, performance and broken links alerts!


We've added Microsoft Teams notifications to Oh Dear for uptime, certificate, performance and broken links alerts!
Cloud Monitoring is one of the easiest ways you can gain visibility into the performance, availability, and health of your applications and infrastructure. Today, we’re excited to announce the lifting of three limits within Cloud Monitoring. First, the maximum number of projects that you can view together is now 375 (up from 100). Customers with 375 or fewer projects can view all their metrics at once, by putting all their projects within a single workspace.
Zoom leverage AWS’s global infrastructure, storage, content distribution, and security to deliver its service and store information securely in AWS data centers around the world. This means that when you’re looking to monitor your Zoom performance, it’s important to know how to identify which AWS data center location your Zoom application is using. Keep reading to find out how.
Applications fail. Containers crash. It’s a fact of life that SRE and DevOps teams know all too well. To help navigate life’s hiccups, we’ve previously shared how to debug applications running on Google Kubernetes Engine (GKE). We’ve also updated the GKE dashboard with new easier-to-use troubleshooting flows. Today, we go one step further and show you how you can use these flows to quickly find and resolve issues in your applications and infrastructure.
The principle of fail fast is either the best thing since the transistor or nothing but hot air. It depends on the size of your organization and the cohesiveness of your teams. If your team members have a strong working relationship, and dev is well integrated with everyday work company-wide, you already have a good foundation for this particular agile thinking. Most companies that have grown beyond startup-size, and even some startups, may find this idea a bit jarring.
Logs are vital for every application that runs in a server environment. Logs provide essential information which points to whether the current system is operating properly. Looking through logs, you will gather data on system issues, errors, and trends. However, it is not feasible to manually look up errors on various servers across thousands of log files. The solution? Central errors logging services.
Changes are both inevitable and necessary when you are running a business. As customer expectation and the market landscape keeps changing, you will have to take up the necessary measures to implement corresponding digital solutions and technology changes. But managing changes can be a tricky process. Some changes can be as simple as changing the folder organization in your data. But if you have not tracked it properly, you will soon run into confusing folder hierarchies and problems in data sharing.
Today, we’re going to continue diving into Catchpoint’s wealth of synthetic tests with a brief overview of network protocols and a look at some helpful use cases specifically around monitoring your email service. I’ll be sharing a hands-on demo, illustrating how this data shows up in Catchpoint – focusing on a pair of protocol tests we’ll be running against our email service.
I was recently on the Changelog Podcast talking about Elastic’s recent change away from open source licensing. I’m at 1:02:45 to 1:24:03, but the whole thing is pretty interesting if you have time to listen. This is where #InfluxDB is headed. No more open core, we're going to a combination of cloud offering, or if on-premise, a complementary offering to the open source. It'll take us time to get there, but that's the vision. Commercial complements the open source rather than replace.
Sometimes you'll want to migrate WordPress hosts - maybe it's time for renewal, and you found a better deal elsewhere, or your hosting provider isn't as reliable as they promised. Which is great for you, but your site's readers don't care that it's a better deal - they just want to see your content. So minimising downtime when transferring hosts is a pretty big deal. Let's learn how to avoid downtime.
Monitoring systems help DevOps teams detect and solve performance issues faster. With Docker and Kubernetes steadily on the rise, it’s important to get container monitoring and log management right from the start. This is no easy feat. Monitoring Docker containers is very complex. Developing a strategy and building an appropriate monitoring system is not simple at all.
The use of virtualization for hosting server VMs is well understood. Today, most virtualization platforms provide administration and monitoring software that admins can use to track the health of their hypervisors and virtual machines (VMs). The use of virtualization for desktops is more recent.
In an industry where technological evolution is commonplace, it’s easy to get lost in a sea of terminology and acronyms. It’s important to establish a solid foundation of understanding. In the second installment of our ‘Frequently Asked Questions’ series, we tackle issues related to effective monitoring, speed, and performance related to Microsoft 365 services.
One of the most commonly used functionalities for String objects in Java is String replace. With replace(), you can replace an occurrence of a Character or String literal with another Character or String literal. You might use the String.replace() method in situations like: In Java, keep in mind that String objects are immutable, which means the object cannot be changed once it’s created.
Dashbird now scans your serverless infrastructure for industry best practices. It’s the antidote for chaos. We’re excited to introduce the Dashbird Well-Architected Insights – a continuous insights scanner combined with Well-Architected reports. The new feature provides serverless developers with insights and recommendations to continually improve their applications and keep them secure, compliant, optimized, and efficient.
Let’s check out together the new features and improvements for Pandora FMS new release: Pandora FMS 752.
Say you’re looking for a smart product to detect anomalies in your organization’s IT environment. A sales rep drops by and shows you all kinds of great artificial intelligence (AI) features with fancy-sounding algorithms. It sounds very impressive and seems like there is a lot of very valuable AI in the product. But, in fact, the opposite is true. This is a manual AI product wrapped in a deceiving jacket. Let me tell you more.
Are you looking for a better way to troubleshoot, debug, and really see and understand what weird behavior is happening in production? Service-level objectives (SLOs) and observability can help you do all that—but they require collecting and storing the right data. If we’re naive with our telemetry strategy, we spend a lot of money on storing data without seeing adequate return on investment in the form of insights.
In our previous post on Grafana and SquaredUp, we compared the two tools across various benchmarks like ease of deployment, time to value, dashboard creation, dashboard sharing, and more. Both tools have their specific advantages over the other, but since the ultimate goal is to give you a single place to look – why not leverage Grafana for the visualizations and data sources it offers, but give them meaning by embedding them in SquaredUp?
Ever been stuck, trying to figure out how to craft a search to answer your question? Splunk is providing guidance right at your fingertips to help you meet your company's objectives, accomplish your end-to-end use cases, and get value out of your Data-to-Everything Platform investment.
“On Tuesday, we announced some big news: LogicMonitor has acquired Airbrake — a developer-centric application error and performance monitoring platform. This acquisition represents the latest step in our company’s journey towards becoming an end-to-end infrastructure monitoring and observability platform. As part of the acquisition, I am thrilled to welcome the Airbrake team into the fold!
Your servers generate heat—this is a fact common with any type of electronic device. The amount of heat they generate will vary, depending on where they are located and the number of servers in use. For example, a small business may have only one or two servers that are stored in a small server room. On the other hand, a large corporation could have hundreds of servers in a massive data center.
In this post, I will explain what are manual monitors? Manual monitors are monitors that do not actively monitor any resources. You can use them if you are using an external monitoring tool and can ping Fyipe API to create incidents. They can also be helpful to create manual incidents for your customers and show them on status page. Manual monitors can be created in just 2 simple steps.
Worldwide end-user spending on public cloud services is forecast to grow 18.4% in 2021, with the cloud projected to make up 14.2% of the total global enterprise IT spending market in 2024, up from 9.1% in 2020, according to Gartner. Enterprises are, therefore, rightly concerned about controlling their public cloud costs—to ensure they’re getting all the value they’re paying for.
Legacy monitoring tools weren’t built for visibility into the cloud and can obstruct your ability to compete and grow your business. Interlink Software works with MSPs to define, monetize and deliver AIOps monitoring solutions that meet the requirement for high-performing business services and hybrid cloud infrastructures that digital enterprises rely on.
Even when businesses are functioning as usual, mergers and acquisitions are intense and demanding transitions for companies to pull off. From the constant communication required in the preparation phase, to the technical demands of integrating two teams, a merger or acquisition forces companies to exhaust resources in order to make the transition a smooth success. Then the pandemic hit.
What is more important – time saved or time well spent? How you think about this problem and how you’d go about measuring it is an important consideration for managers who aspire to be leaders in today’s digital workplace. In IT and beyond, focusing on experience over service is the difference between managing the status quo and leading a change that pushes an organization forward.
A couple months ago, we hosted a week of community-led SCOM workshops and networking. These hands-on workshops took a deep dive into a series of topics handpicked by the SCOM community itself – and we are thrilled that the community found it valuable, as we learned from our post-event survey.
GitLab is one of the most popular web-based DevOps life-cycle tools in the world, used by millions as a Git-repository manager and for issue tracking, continuous integration, and deployment purposes. Today, we’re pleased to announce the first beta release of the GitLab data source plugin, which is intended to help users find interesting insights from their GitLab activity data.
Google Kubernetes Engine (GKE) is the preferred way to run Kubernetes on Google Cloud as it removes the operational overhead of managing the control plane. Earlier today, Google Cloud announced the general availability of GKE Autopilot, which manages your cluster’s entire infrastructure—both the control plane and worker nodes—so that you can spend more time building your applications.
I’ve always had a good experience using DigitalOcean, a cloud infrastructure provider which offers developers cloud services that help deploy and scale applications that run simultaneously on multiple computers. I’ve used DigitalOcean a lot for my personal projects — for example, to host my personal blog, its stats, and a NextCloud instance, all running in Kubernetes.
DevOps came about as a result of ever-growing lags between development and operation. It’s a framework that deals with communication bottlenecks, allowing for smooth change management. DevOps monitoring is a crucial element and a necessity for this framework to succeed. Monitoring plays a vital role in realizing the underlying goals of DevOps. DevOps is all about eliminating technical inefficiencies and improving the speed of the whole cycle from development to deployment.
Transformations were introduced in Grafana v7.0, and I’d like to remind you that you can use them to do some really nifty things with your data. All performed right in the browser! Transformations process the result set of a query before it’s passed on for visualization. They allow you to join separate time series together, do maths across queries, and more. My number one use case is usually doing maths across multiple data sources.
ActiveRecord is Ruby on Rails’ most magical feature. We don’t usually need to worry about its inner workings, but when we do, here’s how AppSignal can help us know what’s going on under the hood.
Running systems in production involves requirements for high availability, resilience and recovery from failure. When running cloud native applications this becomes even more critical, as the base assumption in such environments is that compute nodes will suffer outages, Kubernetes nodes will go down and microservices instances are likely to fail, yet the service is expected to remain up and running.
Don’t stop thinking about tomorrow: For enterprise IT leaders everywhere, it’s no longer enough to lead well today and have teeth in the business. You must now be prepared for all manner and scope of uncertainty and change, and according to Accenture, very few organizations are there yet. In a recent report, the consultancy reports that only 7% of organizations are “future-ready”.
Virtualization is part of many IT environments and a very effective way to reduce expenses while boosting efficiency and flexibility. The NiCE VMware Management Pack enables advanced health and performance monitoring for VMware to leverage your existing investment, reduce costs, save time, and build efficiencies that will help shape a future-proof business.
Being able to track and aggregate data by region is important when monitoring your application. It can provide visibility into where errors and latency might be occurring, where security threats might be originating, and more. Now, you can use Datadog geomaps to visualize data on a color-coded world map. This helps you understand geographic patterns at a glance, including where users are experiencing outages, app revenue by country, or if a surge in requests is coming from one particular location.
In this article, we shall talk about the advantages and disadvantages of single-tenant cloud and multi-tenant cloud. So let us get started! In the past decade adoption of cloud computing has been off the charts. For a long time most companies (primarily enterprises) managed their own IT infrastructure and they could reap the benefits of isolation, privacy and greater management control. This is what is known as a single tenant cloud architecture i.e.
If you work with Microsoft System Center Operations Manager (SCOM) and ServiceNow then you will be familiar with the fear of missing a critical infrastructure alert! But fear no more, we have just the ticket! Imagine if you could get these two tools working together, to fully synchronize your alerts and incidents for the lifetime of an issue – you’d be living the ITSM dream, right! So, here are our top four methods for making this dream a reality.
Written by Nick Cavalancia, Microsoft Cloud & Datacenter MVP The increase in reliance upon Office 365 as an organization’s digital workspace has led many organizations to measure Office 365 against how well users interact with it rather than if it’s running.
Today we will share our list of the most popular software tools used by education institutions. Why is this important? If you are managing technology in education you need to make the best choice from among many available tools. Discovering the most popular tools used by other education professionals can help you make an informed choice. After reading the report you’ll know which tools are relied upon by primary and secondary schools, colleges, and universities in the United States.
In the Modern era of application development, businesses move towards building highly available, fault-tolerant, zero downtime applications to make the user experience and performance smoother and better. One of the essential steps in that process is containerization and orchestration of an application. A Container Monitoring process is as vital as containerizing your application.
“Today’s an exciting day for LogicMonitor. But before I share our news, I want to sincerely thank our customers for your business. The Covid-19 pandemic has been a terrible experience for the world, and yet we @ LogicMonitor are fortunate and thankful to be counted on every day by thousands of organizations. I — and our team of over 650 employees worldwide — are grateful for the chance to serve your organizations during these turbulent times”
Observability and Monitoring are viewed by many as interchangeable terms. This is not the case. While they are interlinked, they are not interchangeable. There are actually very clear and defined differences between them. Monitoring is asking your system questions about its current state. Usually these are performance related, and there are many open source monitoring tools available. Many of those available are also specialized.
In January we brought Release Health to JavaScript. This month we’ve been thinking about the overall experience for JavaScript developers, some could call it JavaScript Jebruary. Think back to your last frustrating experience. It was probably caused by slow page loads or getting dizzy from staring at the ever-ending spinner. One survey showed that the average desktop load time on a webpage was 10.3 seconds and on mobile, it was 27.3 seconds.
Knowing how your users interact with your web application and how they experience it is crucial to provide the best possible experience. So what do you need to know? Start with metrics such as page load times, HTTP request times, and core Web Vitals – time to the first byte, first contentful paint. If you use Sematext Experience you’ll see a number of other useful metrics for your web applications and websites there. However, metrics themselves are only a part of the whole picture.
Currently, there is no official InfluxDB C language client library. Fortunately, I wanted to do exactly that for capturing Operating System performance statistics for AIX and Linux. This data capturing tool is called “njmon” and is open source on Sourceforge. So having worked out how and developing a small library of 12 functions for my use to make saving data simple, I thought I would share it. I hope it will prove useful for others.
Graphical processing units, or GPUs, aren’t just for PC gaming. Today, GPUs are used to train neural networks, simulate computational fluid dynamics, mine Bitcoin, and process workloads in data centers. And they are at the heart of most high-performance computing systems, making the monitoring of GPU performance in today's data centers just as important as monitoring CPU performance.
Network administrators are responsible for the day-to-day operation of computer networks at organizations of any size and scale. Their primary duty is to manage, monitor, and keep a close watch on the network infrastructure to prevent and minimize downtime. Managing a network includes monitoring all the network components, including Windows devices. In any Windows network, the desktops, servers, virtual servers, and virtual machines (VMs), like Hyper-V, run on the Windows operating system.
One of the great things about Logz.io Log Management is that it’s based on the most popular open source logging technology out there: the ELK Stack (click here to view our thoughts and plans on the recent Elastic license). This means Logz.io users get to leverage log shipping and collector options within the rich ELK ecosystem. So how do you know which log shipping technology to use?
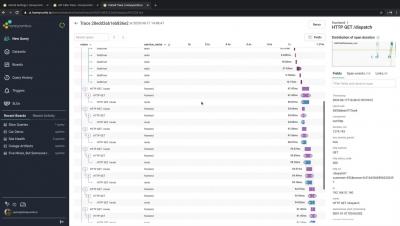
Honeycomb is all about collaboration: We believe that observability is a team sport, and we want to give you as many tools to help your team get the ball down the field (i.e., untangle knotty problems) as we can. We want you to be able to share the current state of your work so that others can follow and figure out what’s up, and we want you to leave breadcrumbs so the next time you’re stuck here, you can find your way back.
Greetings! This is Mike reporting from the Solutions Engineering team at Grafana Labs. In previous posts, you might have read our beginner’s guide to distributed tracing and how it can help to increase your application’s performance. In this post, we are back to talk about metrics and showcase another one of our newest favorite Enterprise plugins: Splunk Infrastructure Monitoring (formerly known as SignalFx)!
New Relic is one popular for SaaS-based Application Performance Management capable of providing you with a flexible and dynamic approach to monitoring. It is considered to be effective but some may feel it is not cost-effective for small-meidum-size businesses and comes with a very high learning curve. If you want an APM that you can get started quickly, requiring minimal training or experience, New Relic may not be for you.
If you’re a RabbitMQ user, chances are that you’ve seen queues growing beyond their normal size. This causes messages to get consumed long after they have been published. If you’re familiar with Kafka monitoring, you’ll call it consumer lag, but in RabbitMQ-land it’s often called queue length or queue depth.
Welcome to part 2 of our blog series, where we go through how to forward container logs from Amazon ECS and Fargate to Splunk. In part 1, "Splunking AWS ECS Part 1: Setting Up AWS And Splunk," we focused on understanding what ECS and Fargate are, along with how to get AWS and Splunk ready for log routing to Splunk’s Data-to-Everything platform.
This article is a re-post of the article written by Matthew Gregory and published on the Ockam blog. Let’s investigate how to build applications with trusted time series data in a zero trust environment! To trust an application we need to trust the data that feeds into it. Increasingly, applications rely on time series data from outside the datacenter, at the edge, or in IoT. This means we need to think of trust and data in new ways.
In this age of digital transformation, any issues with your IT infrastructure can cause major disruptions to your business. On top of this, IT environments that support critical business applications continue to get more complex and dynamic. As failures, outages, and incidents increase in volume and cost, the risk of an outage within your company becomes a very expensive one.
In this article, we will discuss major features, differences, and similarities of the open-source monitoring tools known as Prometheus and Graphite. We will then dive into how you can benefit from MetricFire’s hosted Prometheus and Graphite. Lastly, we will explain why, given the choice, hosted Graphite could be a better monitoring option for you. MetricFire provides comprehensive monitoring solutions with Hosted Prometheus and Hosted Graphite.
We can plausibly say the enterprise development market turned the tide on cloud-native development in 2020, as most net-new software and serious overhaul projects started moving toward microservices architectures, with Kubernetes as the preferred platform.
“Serverless computing is a cloud-computing execution model in which the cloud provider runs the server, and dynamically manages the allocation of machine resources. Pricing is based on the actual amount of resources consumed by an application.” — “Serverless Computing”, Wikipedia This mundane description of serverless is perhaps an understatement of one of the major shifts in recent years.
In this post, I will show you, how to monitor your Website in just 2 simple steps.
Datadog’s features give you full visibility into every part of your application environment, so it’s likely you have many resources to switch between as part of your troubleshooting and development workflows. For example, you might switch from the host map to investigate a performance issue with your services in APM, or jump between dashboards to correlate metrics and troubleshoot a problem with your CI/CD pipeline.
DevOps fits this odd niche between development and oversight. Like any “Wild West” type of position, pretty much anything goes. Your job is to think of everything including the stuff you haven’t thought of yet. You make the rules, and as long as the lights are on you’re considered a success. But alongside that freedom come the rumors and SLA myths that inspire such dread that you write them off as jokes.
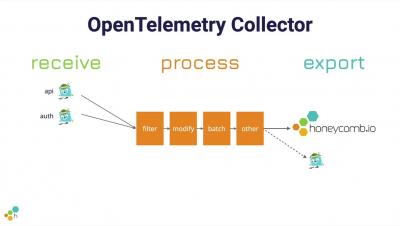
OpenTelemetry 1.0 (Otel) is finally here (in fact, 1.0.1). The announcement brings the industry closer to a standard for observability. OpenTelemetry v1.0.1 will focus solely on tracing for now, but work continues on integrations for metrics and logs. We are still a long way off from this vision becoming reality. Metrics today are in beta, and this is where the community focus is being applied. Logging is even earlier in its life lifecycle.
In my prior three blog posts, we set some ground rules, looked at some out-of-box dashboards, overloaded an in-box property, and finally created an innovative structure to communicate status using SquaredUp's EAM feature. Looking back, when I started this blog, I explicitly stated that traditional monitoring wasn't our goal. It's essential, but the industry (in broad terms) hasn't been successful with monitoring when the only focus is on the infrastructure perspective.
While SQL has been the big dog since the 70s in terms of database management, NoSQL has really come into its own since the late 2000s. In fact, NoSQL has become a powerful and important tool for data analysis and data scientists. To that end, we wanted to take a look at what NoSQL actually is, what are the benefits over SQL, and what are the different data models.
One of the best things about being a .NET developer is all the amazing ASP.NET performance tools that can make your life easier. This blog post is a list of the various types of ASP.NET performance tools at your disposal for finding and optimizing ASP.NET performance problems. Depending on the task, some of these tools will be much better than the others.
‘Enterprise class’ is a buzzword that refers to applications that are designed to be robust, flexible, and scalable for deployment by a large organization. There are no firm standards for what makes an application or platform enterprise class, but enterprise-class applications are generally: When any product is developed, there are assumptions made. These assumptions dictate how widely the tool can be deployed and what constraints it has during usage.
Does your work involve a lot of ITOps Monitoring? If so, chances are you have developed a roadmap for 2021 that addresses digital business disruption, application and infrastructure changes, and the ongoing global pandemic… And here’s an opportunity to incorporate expert advice into your plan.
In this article, we’ll be rewinding back to the very beginning of the AWS Well-Architected Framework to understand how and why it came to be, and why is it of utmost importance, but very often underrated, for serverless developers to learn, understand and apply this framework of best-practices. We’ll also be looking into how the framework has evolved and how it should be used in 2021.
The Sensu Puppet module has seen another major release up to 5.x to coincide with the release of Sensu Go 6. The 5.0.0 bump for the Sensu Puppet module was a chance for us to introduce new features to better support Sensu Go 6, as well as remove code that had been deprecated and no longer needed.
In May 2020, Google introduced Core Web Vitals, a set of three metrics that serve as the gold standard for monitoring a site’s UX performance. These metrics, which focus on load performance, interactivity, and visual stability, simplify UX metric collection by signaling which frontend performance indicators matter the most.
Customer stories are one of the best ways for users to get to know a solution or tool and learn how it can solve their problems. By sharing some of our customers’ OpManager success stories, we aim to help new users and evaluators understand our solution and its wide range of functions. Let’s take a look at how Cross Company used OpManager. Founded in 1954, Cross Company is a 100 percent employee-owned engineering and automation services company.
2020 was a year of tremendous dejection and disruption. Imagine if you had told your organization’s upper management that they had to switch their 10,000 or 20,000 strong corporate office to the virtual world back in January 2020. They would have flipped. Despite all the fear and loss that 2020 brought, we capitalized on the opportunities. And even a year later, there are still possibilities galore.
Some may consider kicking off another new year with their organization a daunting continuation of 2020, however, this is not the case with LogicMonitor. Personally, coming up on my two-year anniversary, I have felt intrinsic energy from day one. With two years under my belt at LogicMonitor, and witnessing first-hand the organization growing at a rapid rate, I thought I would reflect on the opportunity at hand for my colleagues and myself.
The primary goal of our solutions is to help companies achieve specific business goals; whether that’s maintaining and improving the user experience and overall productivity, gaining valuable insight from enhanced visibility into your organization’s IT infrastructure, developing proactive strategies that mitigate the impact of service interruptions or issues, or all of the above, Martello is proud of the products and services we are able to provide.
Websites have evolved a lot since the first sites went online almost 30 years ago. We can now shop, interact, and engage with companies from our screens. Along with customers' online habits, the way browsers render HTML has also evolved. In the earlier days of the internet, server-side rendering was the standard way to get the HTML on the screen. Many sites still use it.
Did you know that hard drives have a recommended operating temperature range? Most people do not think about what happens when they turn on their computer or server and the hard drives begin to whirl around inside. Even if you have the newer solid-state drives (SDDs), you still need to know the recommended hard drives operating temperature. Hard drives store your files, data, operating system, and numerous apps.
AWS Lambda has become a core technology in the shift to cloud-native application development, eliminating infrastructure management and fixed costs. But there are trade-offs with serverless environments. Not having access to the production infrastructure can make debugging difficult and there are a lot of moving parts, adding distributed complexity. Monitoring serverless functions in production requires observability beyond CloudWatch logs and metrics.
In the software lifecycle, you need to know what is affecting the customer from your frontend code to your underlying infrastructure. However, no one to date has solved for monitoring the health of software code vs. systems at the level that we have taken on — or at the scale that our customers require, as everything from grocery shopping to gaming is now digital.
“The best laid plans of mice and men, go oft awry, and leave us nothing but grief and pain” It may sound cliché but think back on the 2020 you had laid out and the 2020 you experienced and you’ll know it’s true. No matter what company you work for or what your job description entails, I’m willing to bet you had to throw a lot of good plans out the window when the pandemic hit. And if you didn’t, call me, I’d like your advice on some lottery numbers.
If there’s one universal constant in the world of business, it’s that things will go wrong. Probably at the most inconvenient of times and in the most inconvenient of ways. It’s Murphy’s law, or, if you’re from England the much more fun, “Sod’s law”. These moments can define your business more than any other. Unfortunately, far more than usual day-to-day ever will.
Application slowdowns, poor Internet speed, and laggy video calls are always frustrating. Whether you’re working in an office, or working from home, it’s important to keep an eye on the applications that matter most. In this article, we’re teaching you how to monitor the network performance of Google apps, including Google Meet, Google Workspace, Gmail & Google Calendar.
In this How-To, we’re going to look at a specific Catchpoint synthetic monitor that helps you analyze the health of systems built around the Internet of things (IoT). Now, IoT is obviously a huge category, so in this case, we’re going to look at systems that utilize the Message Queuing Telemetry Transport or MQTT for short.
There are multiple ways to interact programatically with Icinga. Last week Henrik demonstrated how to connect to the Icinga 2 API through the Icinga 2 Console. Working with the Icinga 2 API is probably the most obvious way to interact with Icinga. Still, I would like to suggest to you another option: How you can fetch data from Icinga Web.
It’s easy to get started with Java and Honeycomb using OpenTelemetry. With Honeycomb being a big supporter of the OpenTelemetry initiative, all it takes is a few parameters to get your data in. In this post, I will walk through setting up a demo app with the OpenTelemetry Java agent and show how I was able to get rich details with little work by combining automatic instrumentation from the agent with custom instrumentation in the code.
Grafana Cloud is the easiest way to get what you need for observability: Prometheus and Graphite for metrics, Loki for logs, and Tempo for tracing, all integrated within Grafana and managed by the Grafana Labs team. You can go from zero to beautiful graphs, insightful logs, and preconfigured alerts in minutes. Built with modern distributed systems techniques, Grafana Cloud allows you to grow with your applications and infrastructure and easily scale past 100M+ metrics.
As part of a modern software development team, you’re asked to do a lot. You’re supposed to build faster, release more frequently, crush bugs, and integrate testing suites along the way. You’re supposed to implement and practice a strong DevOps culture, read entire novels about SRE best practices, go agile, or add a bunch of Scrum ceremonies to everyone’s calendar.
Picture the scene. It’s 9am on a cold, wet, January Sunday morning in 2015 and I’m trudging up Merrion Street in Leeds. Recently made redundant, I’m on my way to a coffee shop that I’m desperately hoping is open. Am I a coffee aficionado desperate for a fix? Am I getting pumped for a gym session? Do I just enjoy walks in the rain? No. I’m on my way to a job interview.
Datadog dashboards provide a foundation for monitoring and troubleshooting your infrastructure and applications, and template variables allow you to focus your dashboards on a particular subset of hosts, containers, or services based on tags or facets. We’re pleased to announce template variable associated values, which can help you speed up your troubleshooting by dynamically presenting the most relevant values for your template variables.
Red Hat Gluster Storage is a distributed file system, built on GlusterFS and operated by Red Hat for Linux environments. With its focus on scalability, low cost, and deployment flexibility across physical, virtual, and cloud-based environments, organizations use Gluster Storage in a variety of high-scale, unstructured data storage applications.
When Cory Virok and I started Rollbar in 2012, we knew something was lacking in how software was being built. Developers continue to get better everyday at building applications — the widespread adoption of microservices architectures and open source are evidence of this. But, we realized something was still holding us back. And that was how we track and fix bugs.
Gaining enhanced visibility of your company’s IT infrastructure and developing a proactive strategy to minimize the likelihood and impact of potential issues is necessary to help maintain and improve overall business productivity. By empowering your organization with a Martello solution, you position it for success, no matter where you are in the world. Watch the videos below to learn more about our products and how they can help your business today.
With increasing complexity and workloads, the world of IT operations is constantly evolving to meet the needs of digital-first organizations. Automation, AI and DevOps are intersecting today like never before. A constant influx of new technologies means new terms. Here's our take on the meaning of leading words and phrases in the space right now.
One of the great things about InfluxDB is that it is really easy to get up and running, and it doesn’t require much monitoring when you are dealing with datasets that fit well on your local dev machine. Once you start using InfluxDB in production and pushing orders of magnitude more data into the system, it’s critical to monitor how your instance is performing so that you can proactively respond to things like disk or network failures, memory saturation, and write or query loads.
Nobody will dispute that a common goal of DevOps pros and SREs, and really any company today, is to delight their customers more by disappointing them less. This was the theme of a recent live webinar focused on announcing a new game-changing partnership between Datadog and Moogsoft. The live session combined remarks by Moogsoft CEO Phil Tee and CTO Dave Casper on bringing together the best of these two technologies with a new seamless integration.
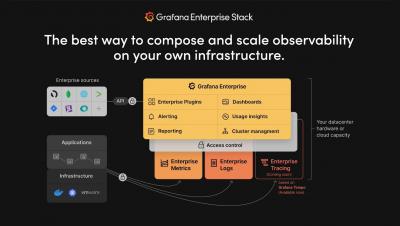
Today, we are launching a new Grafana Labs product, Grafana Enterprise Logs. Powered by the Grafana Loki open source project for cloud native log aggregation, and built by the maintainers of the project, this offering is an exciting addition to our growing self-managed observability stack tailored for enterprises.
A data center migration into the cloud is often a daunting business initiative that can take years as you transition your existing hardware, software, networking, and operations into a brand new environment. In our roles with Google Cloud’s Professional Services organization, we work side by side with customers to collaboratively architect and enable data center migrations into Google Cloud. Over the years, we’ve participated in multiple migration journeys, and devised a general approach.
Speed and function. Two words to live by when analyzing and optimizing your site, but 2021 comes with the need for an additional word: accessibility. From color blind accessibility in your UI, to increasingly detailed SLAs and speed requirements, where should you be spending your valuable resources to keep your competitive edge? Welcome to the future where, Time is Money, is relevant down to the millisecond.
With an increasing number of organizations migrating their applications and workloads to containers, the ability to monitor and track container health and usage is more critical than ever. Many teams are already using the Metricbeat docker module to collect Docker container monitoring data so it can be stored and analyzed in Elasticsearch for further analysis. But what happens when users are using Amazon Elastic Container Service (Amazon ECS)? Can Metricbeat still be used to monitor Amazon ECS? Yes!
Virtualization monitoring can ensure your virtualized infrastructure is performing at its best capacity. The chances of issues on the part of the physical server escaping your sight are quite high, as several virtual machines (VM) are sharing resources. This is why it’s important to understand everything there is to virtualization and virtualization monitoring.
Here at InfluxData, we’ve been focusing recently on deepening our support for Microsoft Azure. First we turned on InfluxDB Cloud on Azure West Europe, in Amsterdam, back in July. Then we launched InfluxDB Cloud on Azure East US, in Virginia, in September. Today, we’re pleased to announce that InfluxDB Cloud joins InfluxDB Enterprise on Azure Marketplace.
It’s only mid-February and there’s already been a surge of websites that have gone down, and big ones too. I don’t need to tell you how damaging website downtime can be, especially since we’re spending the majority of our time online due to the Covid-19 pandemic. We are working online, studying online, banking, shopping, exercising online, the list is endless, and this extra online activity has put added pressure on the websites that help us to perform these tasks.
A decade ago, DevOps teams were slow, lumbering behemoths with little automation and lots of manual review processes. As explained in the 2020 State of DevOps Report, new software releases were rare but required all hands on deck. Now, DevOps teams embrace Agile workflows and automation. They release often, with relatively few changes. High-quality DevOps change management is no longer a nice-to-have, it’s a must. For a lot of DevOps teams, this is easier said than done.
OpenTelemetry hit an exciting milestone this week. The tracing specification has achieved v1.0.0, and the general availability of tracing APIs and SDKs is imminent!
In this post, we’re going to talk about tips for securing the reliability of Loki’s write path (where Loki ingests logs). More succinctly, how can Loki ensure we don’t lose logs? This is a common starting point for those who have tried out the single binary Loki deployment and decided to build a more production-ready deployment. Now, let’s look at the two tools Loki uses to prevent log loss.
Everyone’s software crashes. As an engineer, you don’t feel your users’ frustration unless they reach out to customer support, write bad reviews, or tweet about it. This feedback is often lacking relevant information to resolve the issue. In some cases, you can re-engage with the customer, but that process is time-consuming and inefficient. Another option would be to examine the crash reports, but sometimes they don’t give sufficient insight to fix the problem.
Driving productivity of software development and delivery teams is critical for any organization. The six years of research by DevOps Research and Assessment (DORA) showcases the role easy-to-use tooling plays in driving this productivity and in turn a better work/life balance for the team. The research finds that highest performing teams are 1.5x more likely to have tools they consider easy to use.
Maintaining product focus is the best way to guarantee a successful business. As the late great Steve Jobs put it: “if you keep an eye on the profits, you’re going to skimp on the product… but if you focus on making really great products, the profits will follow.” There are a wide variety of statistics available on how much time developers actually spend writing code, anywhere from 25% to 32%.
PromQL, short for Prometheus Querying Language, is the main way to query metrics within Prometheus. You can display an expression’s return either as a graph or export it using the HTTP API. PromQL uses three data types: scalars, range vectors, and instant vectors. It also uses strings, but only as literals. This intro will provide basic PromQL examples and concepts to understand as you get used to Prometheus queries.
Application Performance Monitoring (APM) refers to monitoring or managing the performance of your code, application dependencies, transaction times, & overall user experiences. It is an important technology that ensures the computer application programs are performing as expected. The ultimate goal of performance monitoring is to supply end users with a top quality end-user experience.
Introduced in 1991, Python has grown to become a versatile and reliable programming language for modern computing requirements. Python is a powerful language used in web development, data science, software prototype creation, and much more. One of the best qualities of this language is it’s easy to learn and uniform across many use-cases.
We are excited to announce the new Elastic Cloud usage analysis page. You can now explore and analyze your Elastic Cloud usage to better understand how the resources you consume contribute to your monthly bill. Your Elastic Cloud monthly bill consists of usage fees for the resources you used, including: Understanding your resource utilization allows you to make smarter decisions about your Elastic deployments as well as identify areas where you may be able to save costs.
Tracking Apache server performance is important to avoid future problems. Hence, what is Apache? Apache is one of the most popular and widely used web servers. As an open source cross platform HTTP server, it can be run in a Linux, Unix, or Windows environment. Stable modular Apache architecture can be configured for multiple needs and it’s crucial to provide seamless and efficient server functionality.
As our customers scale and utilize Coralogix for more teams and use cases, we decided to make their lives easier and allow them to set up their Coralogix account using declarative, infrastructure-as-code techniques. In addition to setting up Log Parsing Rules and Alerts through the Coralogix user interface and REST API, Coralogix users are now able to use modern, cloud-native infrastructure provisioning platforms.
It’s no secret that Amazon Web Services is a powerhouse Cloud provider, and one of the market pioneers in Cloud operations. They do, after all, power some of the world’s biggest and most modern systems we all use and love today. It’s natural then that they attract a lot of users both big and small to deliver high quality and effective solutions. With growing user demand comes the need for new methods of visibility and intelligence.
Sometimes a seemingly well-configured and fully-functional monitoring system can malfunction and lose metrics. Subsequently, you get a distorted picture of what is happening with the monitoring object. In this article, we will look at the possible causes of Graphite dropping metrics and how to avoid it. MetricFire specializes in monitoring systems. You can use our product with minimal configuration to gain in-depth insight into your environments.
A simple command-line interface (CLI) ping will give you details about your target IP address. However, you may have to input the ipconfig command, and then the arp-a command to fully discover the status of an IP, and this is just for one IP address. Now imagine doing this for an IP block of 300 IPs, or even 50 IPs, or doing the same task periodically to manage your IP pool of thousands of addresses and their metrics. Seems like an Herculean task for any network admin!
MySQL is an open source database application that creates meaningful structure and accessibility for large amounts of data.. But, with large data comes performance issues. This article will give you performance tuning in MySQL tips in order to boost its performance.
Here at Lumigo, our mission is to help customers succeed with serverless by solving the observability problem and letting them focus on adding business value with serverless technologies. And to do that, we love to eat our own dogfood – be it using the same serverless technologies that our customers use and even using Lumigo to monitor Lumigo itself! That way, we feel your pain and we find solutions to problems that you care about.
If your company has multiple servers or services that create log files, reviewing them to find the causes of troubles or to find security breaches, takes up too much time. Log monitoring and event logging software is a powerful tool for solving the problem of reviewing logs and helping you with log analytics, business intelligence, and log management. It allows professionals to track the activities of users, detect changes to applications, hardware, and network connectivity, and more.
Many of the world’s largest businesses use eG Innovations’ solutions to enhance IT service performance, increase operational efficiency, ensure IT effectiveness, and deliver on the ROI promise of transformational IT investments across physical, virtual, and cloud environments. But what role will they play in the future of work? And how are Citrix and eG working together?
One of the most common problems developers face regarding memory is finding memory leaks. How do you know if your application’s memory is leaking? How do you find memory leaks? In this article, you will learn.
Firstly, let’s look at why it is so valuable to integrate SCOM and ServiceNow. There are lots of tools available to help you integrate SCOM and ServiceNow. So, the next step is to understand which one will provide your business with the best solution. To help you work through this decision we recommend you ask yourself the following questions.
Before talking about integration, let’s take a look at your non-automated Service Management processes. There isn’t a right or wrong answer as this varies based on your needs, think through the below questions to get a perspective on how tasks flow within your company today.
In my prior two blog posts, we focused on creating a bunch of Enterprise Applications (EAs), tagging those EAs, and then updating the Status dashboard to only show those EAs that are Critical Service Offerings (CSO). For this blog post, we will create some relationships and demonstrate how alerting behaves using SquaredUp's Manual Reporting Availability functionality available in the EAM tier of the product. For this post, we're going to do amazing stuff!
Microsoft Monitoring health and usage information is a critical maintenance task for any site or application, whether it’s running in your on-premises datacenter, hybrid or public cloud environment, or hosted environment. Today’s challenge is that enterprises still require end-to-end monitoring insights of their running (and not running) application workloads, while also knowing that they are losing ground on the physical characteristics of managing their own datacenters.
Here at Datadog, we have always strived to build monitoring tools that are robust yet flexible. We are committed to continued innovation, and we believe that when it comes to creating new solutions that complement our customers' existing workflows, our work is never done. That’s why we’re excited to announce that Timber Technologies, the company behind Vector, is joining Datadog.
Istio is an open source service mesh that can be used by developers and operators to successfully control, secure, and connect services together in the world of distributed microservices. While Istio is a powerful tool for teams, it's also important for administrators to have full visibility into its health. In this blog post, we'll take a look at monitoring Istio and its microservices with Elastic Observability. As the Istio docs mention.
Today I will show you a couple of small functions you can use with the Icinga Console. Using the Icinga Console can help with scripting in general and provides a quick and easy-to-use way of extracting information from your Icinga environment. We will take a look at extracting information belonging to the service objects in Icinga. Obviously, you can pinpoint different objects, like host objects, with which you can work via the Icinga 2 API and Console.
Here at Pandora FMS we love news. If it were up to us we would wear new dresses and stilettos every week, we would open headquarters in an unknown tropical country and we would change styles, to other more daring and exotic, in our cocktail parties. Just to make our love for the avant-garde clear once and for all.
As promised in part 1, I’m back with a short blog about our five key technology predictions for the UK public sector this year.
What are the ideal server room temperature and humidity levels where you store your servers? This is an important question you should know the answer to whether you are responsible for managing racks of servers or a small business owner with a single server. Servers house your data, files, and other information to make it easily accessible from any connected workstation. If the server room gets too hot or too humid, it can cause your servers to overheat and fail.
The days of the one-size-fits-all IT strategy are over. Employees have higher expectations for their workplace experience than ever before – which leads to growing tension when their unique needs are not met by IT. The only solution is a full embrace of personalized, right-sized IT services. Delivering consistent personalized service is easier said than done, however. Organizations must first develop a comprehensive understanding of their employees.
If you didn’t already know, one of the perks of InfluxDB 2.0 is having access to templates. InfluxDB templates allow you to easily apply a variety of preconfigured resources including Telegraf configurations, buckets, dashboard, tasks, and alerts to your InfluxDB instance. In this TL;DR we’ll walk through the easiest way to use and create a template.
OpenTelemetry is a CNCF project that standardizes observability (logs, metrics, and traces) across many languages and tools. Today we will look at how we can use the OpenTelemetry .NET library to instrument a .NET 5.0 web API, to offload traces to Tempo and logs to Loki in Grafana Cloud. Grafana Cloud now has a free plan. Set up your account and follow along!
Documentation is a roadmap. It gives us the safest route to reliable, performant code. And just as maps are updated to reflect changing infrastructure, we update our documentation to give you the best way to purposefully use Sentry. In our latest edition of Dogfooding Chronicles, we use Discover to root out the bane of all companies everywhere: the 404 page.
The IT network stays at the foundation of all the operations and data transfers within your business. Unreliable network or problems with the network performance may have a severe impact on your business. Running a business requires a robust and secure network, that managed effectively to meet all the necessary performance and security goals. The standard network monitoring is not enough in the digital transformation era.
At LogicMonitor, we deal primarily with large quantities of time series data. Our backend infrastructure processes billions of metrics, events, and configurations daily. In previous blogs, we discussed our transition from monolith to microservice. We also explained why we chose Quarkus as our microservices framework for our Java-based microservices. In this blog we will cover.
If you care about your website, show it some love this Valentine’s Day. RapidSpike is there, like Fred from First Dates, to keep the spark alive. We will be your relationship counsellor through the tough times with your website, from downtime to Magecart style attacks, and even the occasional website launch! They say healthy relationships are built around the pillars of trust, communication and passion.
Marc Hornbeek is a DevOps consultant, author and advisor who playfully calls himself “DevOps the Gray” due to his 40-plus years of work in software development. We spoke with him about the convergence of IT operations and DevOps and what it means for the IT organization.
We are thrilled to announce the general availability of alerting in the Elastic Stack with the release of 7.11. With deep integrations throughout our products and solutions, a laser focus on distinguishing signal from noise, and tie-ins to the third-party platforms you depend on like email, PagerDuty, ServiceNow, and Microsoft Teams, building, using, and acting on alerts in Elastic has never been more powerful.
We are pleased to announce the general availability (GA) of Elastic 7.11. This release brings a broad set of new capabilities to our Elastic Enterprise Search, Observability, and Security solutions, which are built into the Elastic Stack — Elasticsearch and Kibana. This release enables customers to optimize for cost, performance, insight, and flexibility with the general availability of searchable snapshots and the beta of schema on read.
The past twelve months have pushed many communication service providers (CSPs) to the limit. According to financial reports of the last six months, the New Normal brought about by the pandemic has significantly increased network expansion efforts, IoT connections, new broadband customers, and out of bundle voice traffic and mobile data.
In Grafana 7.0, we introduced a new panel architecture to enhance the UX and visualization options and create a more consistent experience across Grafana. In Grafana 7.4, we expanded on that foundation and introduced the next-generation graph panel called Time series panel, which is currently in beta. The Time series panel uses the panel architecture of Grafana 7.0 and integrates with field options, overrides, and transformations.
Here at Splunk we’re passionate about helping our customers get as much value from their data as possible. Recently Lila Fridley has written about how to select the best workflow for applying machine learning and Vinay Sridhar has provided an example of anomaly detection in SMLE.
The importance of the security of the Department of Defense’s (DoD’s) networks is no secret (well, of course a lot of it is secret!). This is evidenced by the Department’s IT/cybersecurity budget request that annually tops $40 billion dollars. Last year’s IT and Cyberspace Activities Budget Overview perhaps said it best.
If you strip the buzzwords and TLAs from the definition of DevOps? You’ll find that the roles and tasks involved aim mostly for more uptime and less downtime in the SDLC (software development lifecycle). The first step to achieving that is becoming aware of downtime as it happens with the help of monitoring solutions. Only then can you respond and resolve the issue in a timely manner that minimizes the dreaded and expensive downtime of software development teams.
In this article we will focus on our on-premise platform, or cloud monitoring after having installed Pandora FMS console in Microsoft Azure. The installation will be made with an automated script that installs the Community version and with a second script, it allows to update Pandora FMS to its Enterprise edition (Corporative), leaving a 30-day test version (Trial).
The Internet of Things (IoT) has quickly become a huge part of how people live, communicate and do business. All kinds of everyday things make up this network – fridges, kettles, light switches – you name it. If it’s connected to WiFi, it’s part of the Internet of Things. IoT raises significant challenges that could stand in your way of fully realizing its potential benefits.
When a site is down, Oh Dear sends a notification every hour. Since last year, our notifications can be snoozed for a fixed amount of time (5 minutes, 1 hour, 4 hours, one day). In the evenings and weekends, you might not want to receive repeated notifications. That's why we've added a nice human touch: all notifications can now be snoozed until the start of the next workday. You can choose this new options in the snooze settings of a check.
The 9th February marks Safer Internet Day; a day to recognize the dangers of the internet and the need to be kinder online. But it’s not just each other we have to fear on the internet. You’ve probably heard the talk – online hackers finding their way into your website without you knowing. Spambots corrupting your Google Analytics website data. Online viruses bringing your whole website to its knees. But this is just 1% of the threats that your website faces on a daily basis.
As an industry-leading provider of the most comprehensive Microsoft 365 monitoring solution, Martello is in a class all its own; our digital experience monitoring solution features key capabilities that help IT teams identify when and where cloud application performance issues are happening and how to best mitigate the impact.
This is my first week here as the first dedicated SRE for Honeycomb, and in a welcoming gesture, I was asked if I wanted to write a blog post about my first impressions and what made me decide to join the team. I’ve got a ton of personal reasons for joining Honeycomb that may not be worth being all public about, but after thinking for a while, I realized that many of the things I personally found interesting could point towards attitudes that result in better software elsewhere.
In the real world, if your observability pipeline goes down, you may not receive vital alerts for the system that’s being monitored. To solve that problem, I looked to Sensu Go internally, and decided to utilize the /metrics API endpoint that advertises Prometheus metrics. This is how I conceptualized the Sensu Go Monitoring Template, an InfluxDB Template, by simply posing the question: “How do you monitor your monitoring solution?”
Maybe you have used the previous blog post about generating smarter episodes in ITSI using graph analytics and want to know what else you can apply ML to. Maybe you’re still swamped in alerts even after using the awesome content pack for monitoring and alerting. Maybe your boss has told you to go read up on AIOps…. Whatever the reason for finding yourself here this blog is intended to help you identify the “unknown unknowns” in your alert storms.
I’ve been an open source fan and user for many, many years, going back to before we defined the term “open source” and we called it “free software.” Whenever and wherever possible I prefer to have control over the software I run on my devices. Case in point: My internet router runs OpenWrt, which is a free/open source Linux operating system designed to replace the software provided by the router’s manufacturer.
Like champagne and party hats, Splunk and Microsoft just go together. Here at Splunk, one of our New Year’s resolutions is to continue to empower our customers with data — in this case, Microsoft data. From cloud, to security, to troubleshooting, we’re back with the latest round of new integrations designed to help you do more with Splunk and Microsoft.
Before getting started on how to read Graphite metrics, let us first dive into understanding what Grafana is all about. In a nutshell, Grafana is an open source analytics and monitoring solution, developed and supported by Grafana Labs. It allows you to query, display graphs and set alerts on your time-series metrics no matter where the data is stored.
Getting visibility into your application is crucial when running your code in production. What do we mean by visibility? Primarily things like application performance via metrics, application health, and availability, its logs should you need to troubleshoot it, or its traces if you need to figure out what makes it slow and how to make it faster. Metrics give you information about the performance of each of the elements of your infrastructure.
In the 1995 movie Apollo 13, one man with a buzz cut told another man with a buzz cut (who then told several other men with buzz cuts) that “failure is not an option.” And thankfully for that extraordinarily dramatic event, it was true. It would be nice if the same commandment held for websites. However, even an infinity of buzz cuts cannot change the fact that, alas, sometimes websites fail.
We are living in a time where a difference of a mere couple of seconds can make you lose your business to another company with a faster, more easily accessible web application. In such a highly competitive space, it is important to squeeze out the maximum amount of performance from your application’s software stack and hardware infrastructure.
Successful businesses don’t sort data — they shape it. Discover, Sentry’s query builder, gives form to your event data so you can measure performance and trace issues across all your projects. Here’s how.
By sharing some ManageEngine OpManager customer success stories, we aim to help our users understand this integrated network management solution, including it’s powerful functionality. We hope this enables evaluators and users to make informed decisions. Let’s begin with the story. UAE’s Khalifa University offers excellent, world-class education. But exceptionalness does not mean monitoring and maintaining its IT infrastructure comes easy.
Hey there! This is Éamon Ryan from the Solutions Engineering team. Very recently the Splunk data source plugin, which is available with a Grafana Enterprise license, had a new release: v2.1.0. While it added a few good bug fixes for edge cases, the biggest change, I think, was the addition of support for data links! Data links actually show up in a few places inside Grafana.
In my previous Link Analysis blogs, "Visual Link Analysis with Splunk: Part 1 - Data Reduction" and "Visual Link Analysis with Splunk: Part 2 - The Visual Part," I used techniques that work well when we have a controlled data set. However, as we know, real data can be messy. When analyzing links in fraud data, the data can be very noisy. Let’s say we want to use IP addresses for link analysis in the Splunk platform. It is not unusual for two people to share an IP address.
Among the many topics that a tech founder CEO can write about in a blog, I always feel that fundraising announcements are the least glorious especially when compared to announcing great achievements such as business growth, new products, or meaningful partnerships. However, funding is a moment when others take notice, it’s a major milestone for the team and an acknowledgement from the market that what we’re building is needed and in-demand.
With the pandemic and the new challenges it posed, it's safe to say we all felt like 2020 was a tumultuous year. In spite of the losses and hurdles we've faced, the resilience of humankind is helping us adapt and keep moving forward. At Zoho, we've adapted, too, and have switched to working remotely to ensure smooth transaction of our services. With the help of our customers' feedback, we were able to roll out almost all the features we had planned for the year.
These days, more and more web applications are developed and refined to keep the customer engagement at the highest level possible. It is crucial to provide a smooth experience to the customer hence monitoring is of paramount importance. One key factor in that is monitoring the web server we use. In this article, we will explore Logz.io features by monitoring an Apache Web Server.
Improve your security posture with community Indicators of Compromise and use reputation data to detect threats in encrypted traffic. On the digital battleground, it pays to stay on your toes, but there are ways to make the work easier. Flowmon ADS 11.2 brings you new and refined methods of avoiding known threats and learning from attacks carried out against others. Main news.
One important aspect of managing a cloud environment is setting up financial governance to safeguard against budget overruns. Fortunately, Google Cloud lets you set quotas for a variety of services, which can play a key role in establishing guardrails—and protect against unforeseen cost spikes. And to help you set and manage quotas programmatically, we’re pleased to announce that the Service Usage API now supports quota limits in Preview.
“Everything as code” has become the status quo among leading organizations adopting DevOps and SRE practices, and yet, monitoring and observability have lagged behind the advancements made in application and infrastructure delivery. The term “monitoring as code” isn’t new by any means, but incorporating monitoring automation as part of an infrastructure as code (IaC) initiative is not the same as a complete end-to-end solution for monitoring as code.
We recently achieved Citrix® Ready verified status for the Nexthink Experience Platform. The completion of this rigorous testing and verification process serves to validate the tremendous value our joint customers enjoy across the entire lifecycle of Citrix Virtual Apps and Desktops projects. This value proposition holds true for on premise deployments as well as migrations to Citrix Cloud.
In July of 2020, Microsoft announced that it was improving its upload file size limit from 15GB to 100GB for all OneDrive users. Now, the company has released an even bigger update – as OneDrive users are now able to upload files up to 250GB in size. Support for this new upgrade, which will also affect Microsoft Teams and SharePoint users, began its rollout in January.
While Apache Tomcat used to be the underlying engine for JBoss EAP and AS, more recently, Undertow is used as the application server engine.
JBoss is an open source, standards-compliant, J2EE application server implemented in 100% pure Java. There are many variants of JBoss available today: While Apache Tomcat used to be the underlying engine for JBoss EAP and AS, more recently, Undertow is used as the application server engine.
Last week my colleague, Clay Ryder, and I presented a webinar, titled No! The cloud is not someone else’s data center, in which we examined how companies can reduce the complexity of a cloud migration and accelerate the benefits of digital transformation. It’s an important topic, so as a follow-up to the session, I’ve summarized five key things you need to understand to be successful in the cloud. If you missed the session, you can listen to the full discussion at the link above.
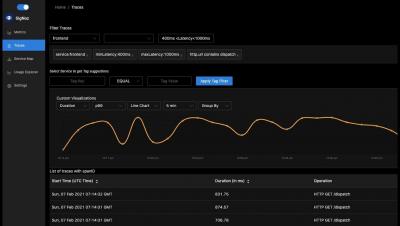
We recently added password access for our Dashboards which has been in popular demand. Previously Dashboards were public and could be accessed by anyone with who you shared the link – but from today you can add a password to your dashboard in order to ensure only authorized visitors can see the data.
In this article, I’m trying to shine some light on the AWS Lambda Layers, Lambda Extensions, and Docker image for Lambda, in order to add third-party code to Lambda. When and how to use which method, and when to mix and match? Due to the circumstances in 2020, many software releases were postponed, and so the industry slowed its development speed quite a bit. But at least at AWS, some teams got updates out of the door at the end of the year. AWS Lambda got two significant improvements.
In this article, we will explain how to monitor AWS SQS with Prometheus. To monitor AWS SQS, we will leverage the data offered by CloudWatch exporting the metrics to Prometheus using the YACE exporter (Yet Another CloudWatch Exporter). Finally, we will dive into what to monitor and what to alert. AWS SQS (Simple Queue Service) has gained popularity as a way to communicate and decouple asynchronous applications, specifically for its easy integration with AWS Lambda functions.
Very often, we face situations when the website we are trying to access refuses to load. In addition, repeatedly refreshing the site also does not bring out any positive results. This is when you understand that there is something amiss with the server and that it might be down.
Grafana v7.4 has been released! The big news for Grafana 7.4 is the next-generation graph panel called time series, which is in beta. A high-performance visualization based on the uPlot library, it uses the new panel architecture introduced in Grafana 7.0 and integrates with field options, overrides, and transformations.
A few lines of code in your website’s header can make or break your security and your customer’s trust. We know how important that is to you, so at RapidSpike we’re here to empower you with data, protecting your website from the top down, and today we’re talking about the very top — your homepage header and its precious metadata.
During an InfluxData internal hackathon, I was looking to work on a project that would help me strengthen my Telegraf and Flux skills. I also wanted to use InfluxData’s Giraffe to visualize my project in a React application. After reading Sean Brickley’s blog post on tracking the International Space Station with InfluxDB, I was inspired to build on this idea.
In this How-To video, we’ll look at how Catchpoint can help you evaluate which Content Delivery Network you should be using. CDNs, as they’re called, are not one size fits all, especially when it comes to location. Many companies simply select one CDN and run with it, even though their provider might not perform very well in all places.
The online gambling industry (which includes casino games, poker, and sports betting) is growing pretty fast, with no signs of it slowing down. More and more people have access to the Internet via mobile phones or PCs, and people like to gamble. Around 51% of the world’s population are involved in some gambling form.
You might not think that an IT server monitoring service would have an impact on your net profits. IT-related costs often fall under operational expenses. As such, you have better control over these expenses and can look for different ways you can cut costs without affecting results. Before we get to reviewing some of the ways active network monitoring and server monitoring can help cut operational costs and grow your net profits, let’s do a quick review of net profits.
Microservices, also known as microservices architecture, refers to a method of designing and developing software systems. Microservice architecture is becoming increasingly popular as developers create larger and more advanced apps. The goal is to help enterprises become more Agile, especially as they adopt a culture of continuous testing. Here are the basic features of microservices.
This post is a recap of a presentation given at ElasticON 2020. Interested in seeing more talks like this? Check out the conference archive. Network infrastructure is the engine that drives a company’s business. As companies scale, assets that compose this infrastructure become more complex to manage. That means there’s more hardware, more software, and more subscriptions and services that require tracking.
Root cause analysis can be a difficult challenge when you are troubleshooting complex IT systems. In this blog, we are going to take you through how you can perform root cause analysis on your IT Service Intelligence (ITSI) episodes using machine learning, or more specifically causal inference. The approach shown here is included in the Smart ITSI Insights app for Splunk, with this blog largely detailing how to use the ITSI Episode Analysis dashboard.
Exoprise CloudReady provides early detection of mission critical mail outages. On February 3rd, Microsoft had a mail delivery delay, that caused mail delivery failures and an outage. While CloudReady detected the Exchange Online mail delivery error almost 2 hours in advance, Microsoft did finally publish an incident to track the outage.
Founded in 1866, the University of New Hampshire (UNH) is a public research university with its main campus spread across 2,600 acres in Durham, New Hampshire. For more than 154 years, UNH has delivered hands-on learning, research, and work experiences that bring together students, faculty, and private and public partners to create life-changing opportunities and innovative solutions across the world.
When building a production application, you are usually on the lookout for ways to optimize its performance while keeping any possible trade-offs in mind. In this post, we’ll take a look at an approach that can give you a quick win when it comes to improving the way your Node.js apps handle the workload. An instance of Node.js runs in a single thread which means that on a multi-core system (which most computers are these days), not all cores will be utilized by the app.
Today, we're introducing a new major feature: monthly site reports. In such a report, you got a bird's eye summary of everything we know of a site in a particular month. We've gone the extra mile and added the ability to mail these reports to people outside of your team automatically. If you're an agency and manage sites for your clients, you could use this feature to send a monthly report of all broken links to your client. In this blog post, we'll tell you all about the feature.
Despite a halt in travel in 2020, InfluxData made incredible progress reaching users around the world through the new InfluxData Authorized Channel Partner program. The program features a robust ecosystem of distributor and reseller partners that help to support InfluxDB users around the world. In 2020, we welcomed 23 channel partners, including three regional distributors and 20 resellers in the Asia Pacific, EMEA and North American regions.
In a previous life as an Android developer, a customer reported a nasty bug that we didn’t know how to fix. After what felt like countless hours of debugging and writing back and forth to customer support, our only option left was to get our hands on the users’ local database. However, for a variety of reasons, we couldn’t ask the customer to root the device, copy the database, and send it to us.
Auto-instrumentation is a subject I have not had much experience with. Here at Grafana Labs, we primarily develop in Go, which doesn’t afford such luxuries. However, there is an enormous amount of interest from the community in Java auto-instrumentation, so I set out to determine what was possible using the shiny new OpenTelemetry auto-instrumentation libraries.
Service-Level Agreements (SLAs) are part of the package when it comes to defining contracts, particularly with technology service vendors. An SLA serves to define the metrics, expectations, and penalties that the service provider will adhere to, and SLA reports create accountability.
In this blog we are going to describe how you can create a notable event policy in IT Service Intelligence (ITSI) that is able to group your events using labels generated by unsupervised machine learning in the Smart ITSI Insights App for Splunk – and don’t worry you don’t have to be a data scientist to read this blog!
The monitoring and incident management process is often chaotic and time-consuming for organizations. However, there is a better way to approach IT incidents and make your existing process function better. Topology and relationship-based observability solutions take the incident management process from chaotic to structured. Let’s look into how StackState’s solution improves and speeds up the incident resolution process.
As one of the three pillars of observability, along with logs and traces, digesting metrics is a crucial part of any ITOps admins’ job. Metrics are a numeric representation of data measured over intervals of time and thus can derive knowledge of system behavior historically, which can help predict future patterns of behavior and inform investigations of issues and incidents.
StatsD is an industry-standard technology stack for monitoring applications and instrumenting any piece of software to deliver custom metrics. The StatsD architecture is based on delivering the metrics via UDP packets from any application to a central statsD server. Although the original StatsD server was written in Node.js, there are many implementations today, with Netdata being one of them.
There is a tremendous amount of uncertainty for anything and everything when it comes to the COVID-19 vaccine. The standards of who is eligible to get the vaccine (and when!) differs from state to state and is a moving target to say the least. While some states have already begun to distribute the vaccine according to their state mandated guidelines, others are struggling to define what those mandates are exactly.
Are you suffering from overspending in Azure, lack of cost visibility and lack of context? You’re not alone; Azure cost management is a problem we hear about time and time again. That is why we created top-notch cost tiles that would allow users to build the perfect Azure cost dashboard, and help them quickly identify overspends and expensive resources in their Azure tenant.
Network scanners have become an integral part of every IT admin’s first line of defense against security breaches. Using the right network scanner tool to conduct effective network reconnaissance and diagnosis enables you to pinpoint network issues that can escalate to security risks and network mishaps. A typical network scanner would allow you to scan a range of IP addresses sequentially, and display the active devices within that address block.
Improving front-end performance for a website is known to increase the likelihood that users will engage, enjoy, and continue to use a website. This leads to better business outcomes by improving customers' digital experiences - no-one likes waiting for a slow page to respond. Core Web Vitals are a part of Google's evaluation of a user's overall page experience, and are made up of three specific page speed, user interaction, and page stability measurements: They work together with other web vitals (mobile friendly, free of malware, secure, and low on interstitial popups) to form an overall page experience score signalling to Google that users are having a good experience.
Sensu creator and CTO Sean Porter recently wrote about “monitoring as code” and his perspectives on where the next generation of monitoring and observability workflows is headed. That post did a great job of outlining the concepts; this post will put theory into practice with SensuFlow, a new prescriptive monitoring as code workflow for Sensu Go, and its accompanying GitHub Action.
Storage devices for networking, or NAS servers are in good health. And no wonder, since we have increasingly more data to save and more need to use them from different locations. Traditionally, NAS servers have been considered a cheaper (and also more limited) alternative to other types of servers. However, NAS servers can also be used to carry out different tasks. But before we get into that, how about we find out more about what a NAS server is?
In traditional IT environments, services to customers are delivered and supported by the organization. A Service Level Agreement (SLA) is created with details like what would be the availability of service be, how reliable the service would be, what penalties can be charged in case of downtime, etc. The internal teams like the network administration team, development team, IT service desk, etc. would then draw up Operational Level Agreements (OLAs) to support the SLA.
In this post we want to lay out typical price which someone would incur in running SigNoz. This would give potential users an idea of what resources they would need to provision & typical monthly cost at different application load and sampling rates.
In the mid of December, SolarWinds disclosed that the company experienced a highly sophisticated, manual supply chain attack on versions of the Orion network monitoring product released in March – June 2020. The company shared that the attack was most likely conducted by foreign hackers and intended to be narrow, remarkably targeted, and manually executed attack.
Data streaming is important for getting insights in real time and reacting to events as fast as possible. Its application is wide, from banking transactions and website click analytics to IoT devices and motorsports. The last example represents a really interesting use case.
Don’t you hate it when you see an uncaughtException error pop up and crash your Node.js app? Yeah… I feel you. Can anything be worse? Oh yeah, sorry, unhandledRejection I didn’t see you there. What a nightmare you are. 😬 I maintain all Node.js open-source repos at Sematext. A few of them can help you out with error handling, but more about that further down. Here at Sematext, we take error handling seriously! I want to share a bit of that today.
Downtime Monkey now logs more than 4 million website responses each day. We analysed these to see how fast websites respond in practice. View the full results below or skip to the sound bites.
My personal experience with HAProxy dates back to my work with a previous company, where we used HAProxy to do load balancing between pairs of servers with specific roles. Those servers are the core of the major payment gateway in Uruguay, where thousands of users use them every day to pay their bills, recharge their mobile phones, pay parking fees, and even play lottery numbers.
In this article, we will build a CI/CD pipeline with the AWS Cloud Development Kit (CDK) and debug a test it using Dashbird’s observability tool. In 2021, continuous integration and continuous delivery, or short CI/CD, should be part of every modern software development process. It helps deliver new features and bug fixes much faster.
In part one of the "Visual Analysis with Splunk" blog series, "Visual Link Analysis with Splunk: Part 1 - Data Reduction," we covered how to take a large data set and convert it to only linked data in Splunk Enterprise. Now let’s look at how we can start visualizing the data we found that contains links. Why, you may ask, when we just developed a nice table of data that shows us links? Tables of data don’t always work well if you have more than one page of data.
Back in October, we announced the Splunk OpenTelemetry Collector Distribution, which offered the industry’s first production-ready support for OpenTelemetry. This distribution is the recommended way that customers of Splunk’s award-winning observability products capture metrics and traces.
Some of you may have seen recently that we are trying to commoditize machine learning through our MLTK smart workflows. Here I’d like to outline another example of an MLTK smart workflow, designed to help improve the usability of the predictive capabilities in ITSI.
I’m delighted to announce that Honeycomb has raised $20M in Series B funding, led by e.ventures Growth, with participation from existing investors Scale Venture Partners, Storm Ventures, Next World Capital, and Merian Ventures, and joined by Industry Ventures. Honeycomb has led the conversation and momentum behind observability for years, and now we’re poised to scale the product, community, and practice even further.
Our Makefile entry point for developing against the Mattermost Server already tries to simplify things for developers as much as possible. For example, when invoking make run-server, this build tooling takes care of all of the following (among other things!).
Everyone knows that automation is set to have a profound impact on the world of work in the coming years. Often called the ‘fourth industrial revolution,’ the impact is widely expected to be as profound as the industrial revolution itself. Just as mechanical systems replaced the works of human hands in the 19th century, artificial intelligence is expected to significantly supplant human brainpower in the 21st century, with equally profound impact on our personal and professional lives.
Understanding the Graph API’s architecture and value in standard monitoring scenarios.
You surf the internet, don't you? While all of us are at home due to Covid lock-down and accepting a new reality, the majority of the work is happening online. IT managers are looking for tools that can track the user digital experience. Executives are reading a report from Gartner or Forrester about some of the best networking monitoring solutions available on the market. Project managers are using Microsoft Teams online to communicate and ensure team members are meeting deliverables on time. Remote employees everywhere use OWA to check their office mails. No matter what, you can be quite sure that everyone is using their favorite browser and search engine for connecting online and accomplish tasks.
High-level information and speedy configuration for the busy network administrator. If you want to respond to network issues quickly and promptly, you can’t waste time digging for information. So how can Flowmon 11.1 help?
System traceability is one of the three pillars of observability stack. The basic concept of observability is of operations, which include logging, tracing, and displaying metrics. Tracing is intuitively useful. Identify specific points in an application, proxy, framework, library, runtime, middleware, and anything else in the path of a request that represents the following of either ‘forks’ in execution flow and/or a hop or a fan out across network or process boundaries.
ServiceNow is one of the leading providers of IT Operations Management (ITOM) solutions, with a broad range of packages, designed to scale with your business as it grows. However, it can be a complex process understanding which solutions will be the best investment for your IT Operations, now and in the future.
Many of us get sentimental about past projects we’ve worked on…for me it is a mobile dashboard that leveraged ML/AI to help a sales team make quicker decisions while in the field (nerdy, I know…but it was one of my first projects as a UX Designer when I was starting out my career, and I have many fond memories about this project). For many members of the team at Grafana Labs, that sentimental project is worldPing.
The year 2020 was a tough one and tested the grit and resilience of the human race. Organizations across the globe had to prioritize the safety of employees, customers, and associates. The rapid response to COVID-19 has enabled millions to work remotely because of advanced cloud computing technologies supplied through public cloud services like Amazon Web Services (AWS) and Microsoft Azure.
Kubernetes provides abstraction and simplicity with a declarative model to program complex deployments. However, this abstraction and simplicity create complexity when debugging microservices in this abstract layer. The following four vectors make it challenging to troubleshoot microservices.
In every home, there is a place that we store things that we no longer need or use. It’s something that once gave us joy, albeit at an initial cost, and for this reason we seem unable to throw it away even though we no longer have a use for it. The main culprit? Old tech gadgets. Whether it’s at my home, my parent’s house, or the family holiday house, there is always a drawer where old phones, cables, music players, and earphones are stored away and forgotten about.
To say that things have changed since March 2020 is so commonplace it’s becoming trite. Everybody knows that people have worked from home where possible. HR and IT functions have dovetailed as never before. The HR personnel are therefore likely to be working from home, but they have an additional pressure: they are supporting, and their managers are managing, teams they can’t see.