|
By Hariom Gupta
Hariom Gupta Follow 4 min read· 1 hour ago -- Listen Share Starting this journey was both exciting and fulfilling — and now, here I am at the finish line, having successfully completed the LFX Mentorship Program and reflecting on the experience through this blog. The past three months have been incredible — surpassing my expectations in so many ways.
|
By Yuri Shkuro
Yuri Shkuro· Follow Published in JaegerTracing · 6 min read· 1 day ago -- Listen Share Jaeger, the popular open-source distributed tracing platform, has had a successful 9 year history as being one of the first graduated projects in the Cloud Native Computing Foundation (CNCF). After over 60 releases, Jaeger is celebrating a major milestone with the release of Jaeger v2.
|
By Yuri Shkuro
Jaeger, the popular open-source distributed tracing system, is getting a major upgrade with the upcoming release of Jaeger v2. This new version is a new architecture for Jaeger backend components that utilizes OpenTelemetry Collector framework as the base and extends it with Jaeger’s unique features. It promises to bring significant improvements and changes, making Jaeger more flexible, extensible, and even better aligned with the OpenTelemetry project.
|
By Ha Anh Vu
ClickHouse database has been used as a remote storage server for Jaeger traces for quite some time, thanks to a gRPC storage plugin built by the community. Lately, we have decided to make ClickHouse one of the core storage backends for Jaeger, besides Cassandra and Elasticsearch. The first step for this integration was figuring out an optimal schema design. Also, since ClickHouse is designed for batch inserts, we also needed to consider how to support that in Jaeger.
|
By Yuri Shkuro
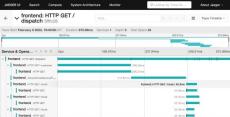
Jaeger’s HotROD demo has been around for a few years. It was written with OpenTracing-based instrumentation, including a couple of OSS libraries for HTTP and gRPC middleware, and used Jaeger’s native SDK for Go, jaeger-client-go. The latter was deprecated in 2022, so we had a choice to either convert all of the HotROD app’s instrumentation to OpenTelemetry, or try the OpenTracing-bridge, which is a required part of every OpenTelemetry API / SDK.
|
By Yuri Shkuro
TL;DR: proposal (and a survey) to deprecate native Jaeger exporters in OpenTelemetry SDKs in favor of OTLP exporters.
|
By Yuri Shkuro
The latest Jaeger v1.35 release introduced the ability to receive OpenTelemetry trace data via the OpenTelemetry Protocol (OTLP), which all OpenTelemetry SDKs are required to support. This is a follow-up to the previous announcement to retire Jaeger’s “classic” client libraries. With this new capability, it is no longer necessary to use the Jaeger exporters with the OpenTelemetry SDKs, or to run the OpenTelemetry Collector in front of the Jaeger backend.
|
By Team Aspecto
Written by @thetomzach @ Aspecto. In this guide, you’ll learn what Jaeger tracing is, what distributed tracing is, and how to set it up in your system. We’ll go over Jaeger’s UI and touch on advanced concepts such as sampling and deploying in production. You’ll leave this guide knowing how to create spans with OpenTelemetry and send them to Jaeger tracing for visualization. All that, from scratch.
|
By Yuri Shkuro
In distributed tracing, sampling is frequently used to reduce the number of traces that are collected and stored in the backend. This is often desirable because it is easy to produce more data than can be efficiently stored and queried. Sampling allows us to store only a subset of the total traces produced.
A couple of years ago, the OpenTelemetry project was founded by the merger of two similarly aimed projects: OpenTracing and OpenCensus. One of the goals of this new project was to create an initial version that would “just work” with existing applications instrumented using OpenTracing and OpenCensus.
This talk comes from practical experience of running a cloud-based SAAS under Kubernetes for the last two years. Prometheus is good for the big picture view of how things are running, while Jaeger acts like a microscope on the internal workings of your system.
|
By Estafet Consulting
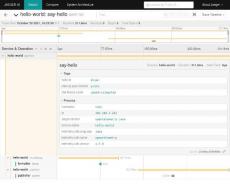
Shows how a microservices architecture can be instrumented to generate Opentracing events which are monitored and presented using Jaeger. The demo is based on one of our github projects - see estafet.com/github and download the source which runs on minishift.
|
By Estafet Consulting
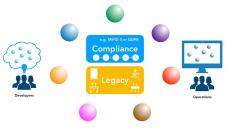
Opentracing gives us a standard for recording interactions across a distributed microservice architecture, whilst Jaeger is a monitoring tool that shows us the flow of events. It gives huge insight to both devs and ops teams, and is also a potentially cheaper way of demonstrating compliance with MiFID and GDPR.
Learn the basics of OpenTracing and Jaeger and why they are so awesome. Jason Newman, Chief Architect at Weave, presents on how Weave uses OpenTracing and Jaeger to diagnose issues on their micro-service architecture.
- May 2025 (1)
- November 2024 (1)
- July 2024 (1)
- September 2023 (1)
- February 2023 (1)
- November 2022 (1)
- May 2022 (1)
- February 2022 (1)
- January 2022 (1)
- October 2021 (1)
- February 2021 (1)
- November 2020 (1)
- October 2020 (2)
- August 2020 (3)
- May 2020 (2)
- April 2020 (1)
- March 2020 (1)
- February 2020 (3)
- January 2020 (1)
- October 2019 (1)
- September 2019 (1)
- July 2019 (2)
- May 2019 (3)
- April 2019 (1)
- March 2019 (1)
- January 2019 (1)
- May 2018 (1)
- November 2017 (3)
Open source, end-to-end distributed tracing. Monitor and troubleshoot transactions in complex distributed systems.
As on-the-ground microservice practitioners are quickly realizing, the majority of operational problems that arise when moving to a distributed architecture are ultimately grounded in two areas: networking and observability. It is simply an orders of magnitude larger problem to network and debug a set of intertwined distributed services versus a single monolithic application.
Problems that Jaeger addresses:
- Distributed transaction monitoring
- Performance and latency optimization
- Root cause analysis
- Service dependency analysis
- Distributed context propagation
We are a Cloud Native Computing Foundation hosted project.


