Operations | Monitoring | ITSM | DevOps | Cloud

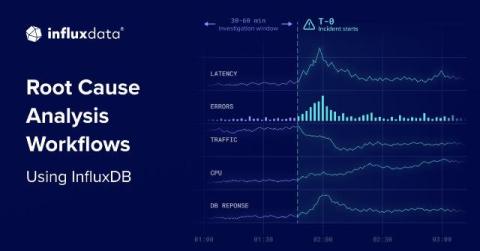
Root Cause Analysis Workflows Using InfluxDB

Summary When production incidents strike, distributed systems can mask issues under a collection of fragmented logs. But all your services share a universal metric: time. That’s good news, because root cause analysis (RCA) is inherently a time series problem. InfluxDB is your central telemetry hub, allowing you to reconstruct operational failures using a reliable, four-step workflow: Table of Contents It’s 2:00 AM, and your monitoring system fires a critical alert.

Modernize Your Data Historian with InfluxDB

In this video, Dev Advocate Cole Bowden walks you through where traditional data historians fail, and why a dedicated time series database like InfluxDB can streamline your operations. With an AI-powered demo showcasing an automative plant's data, you'll see the value of InfluxDB and where it can power insights that Data Historians can't handle on their own.

Q3 2026 Recap: Up to 4x Faster Single-Series Queries, Distributed Compaction, and Telegraf Controller High Availability

Q3 was a packed quarter, with releases across InfluxDB, Telegraf, and Amazon Timestream for InfluxDB that help deployments and fleets grow without slowing down. InfluxDB 3.11 brought performance improvements for heavier, more complex workloads to GA in InfluxDB 3 Enterprise. InfluxDB 3.12 followed with roughly 3x faster bulk imports, distributed compaction in beta, per-database schema enforcement, and generally available role-based access control.

Why Automotive Manufacturers Are Augmenting Data Historians, Not Replacing Them

Summary Automotive manufacturers face rising costs and scaling limits with per-tag-priced data historians as sensor counts and sampling rates grow. Instead of rip-and-replace, manufacturers are augmenting traditional data historians by routing new telemetry to InfluxDB (via Telegraf or Litmus or consolidating siloed historians, while the historian continues handling SCADA and regulatory data. Table of Contents.

Building an AI-Powered Time Series Dashboard for Data Center Ops

AI demand is pushing data centers to get bigger, denser, and more distributed, while the data that runs them still often sits in different systems, slowing down operations and hampering efficiency. By leveraging a time series database like InfluxDB to create a single, unified telemetry layer, you can simplify your data stack, comfortably handle the high volume of data, and solve problems faster and more efficiently, helping to minimize waste and maximize efficiency, saving time, electricity, equipment, and money.

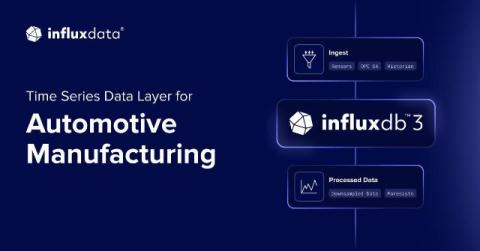
Building a Practical Time Series Data Layer for Automotive Manufacturing

Table of Contents Automotive manufacturing generates data at several operating cadences. Sensors and controllers emit measurements continuously. Equipment and line states change as events. Production and quality systems add context at the part, batch, shift, and plant level. Together, these records describe how a manufacturing process behaves over time.

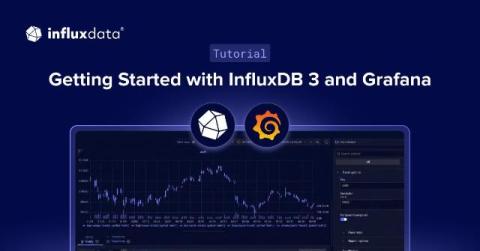
Getting Started with InfluxDB 3 and Grafana Tutorial

Summary This guide walks through an end-to-end Grafana and InfluxDB 3 integration using a realistic dataset you generate yourself. The tutorial covers getting data in, transforming it, connecting Grafana, and building real dashboards. Table of Contents InfluxDB and Grafana are the most common pairing in time series monitoring, and division of labor between them is simple.

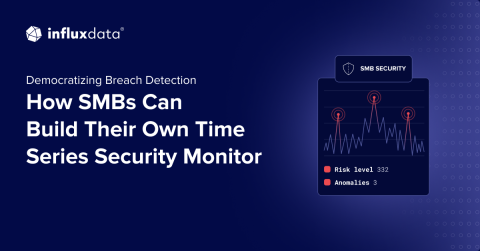
Democratizing Breach Detection: How SMBs Can Build Their Own Time Series Security Monitor

Summary Small and midsize businesses are often flying blind when it comes to security breach detection. An affordable way to address this issue without the complexity of SIEM is by modeling security events as time series data. This architecture takes audit logs from SaaS platforms and normalizes activities like logins, downloads, and token creation to establish behavior baselines that can be used to detect anomalies indicating security breaches. Table of Contents.