Enterprises are looking to capitalise on the new wave of small form-factor computing and navigate the shift to the edge. Device manufacturers across the world are racing to build embedded, connected devices that will deliver on the promise of the fourth industrial revolution. Many of them are looking to explore data-driven value-chain optimisations, predictive maintenance and or new digital customer experiences.
Teams are locked into a cycle of suffering characterized by the feeling that they are sprinting just to stay still. This morale and productivity-destroying state is caused by an inability to find time to save time. Our new research, The State of Availability Report 2022, discovered that teams know what they want to do—harness cloud and DevOps practices and tools to advance digital transformation—but something’s getting in the way.
Sleuth’s product team is pleased to announce an exciting new feature that provides early and actionable visibility into emerging work-in-progress risk! With this release, Sleuth provides customers even more actionable visibility into their engineering efficiency. It extends Sleuth's deploy-centric tracking capabilities upstream in the developer workflow to provide real-time visibility into in-flight work and its emerging risks. Here's how it works.
Components are reusable bits of code that, most of the time, work and function independently. If you want to be confident that components are working properly, you need to test them. Conveniently, Cypress.io has designed their testing framework to include component testing. This tutorial illustrates the differences between end-to-end (E2E) and component testing, and what to consider when using these methods. Then, you will learn how to use Cypress for component testing.
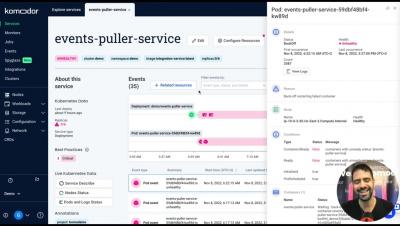
As a developer, it can become challenging to manage Kubernetes and develop applications simultaneously. That’s why we put together this guide to show you how the Kubernetes Dashboard can help developers overcome this problem and get an overview of the cluster and its workloads. From this, developers can focus more on application development while stressing less on cluster management.
Another release of the Netdata Monitoring solution is here!
Hybrid cloud is an increasingly popular strategy for organisations of every hue. According to a recent survey, 72% of respondents put their cloud strategy as being hybrid first. Hybrid cloud offers businesses the best of both worlds: the security, data control and reliability of the private cloud combined with the flexibility, elasticity, cost-effectiveness, and scalability of the public cloud.
We can completely eliminate software vulnerabilities caused by memory corruption by moving software away from C and C++. The National Security Agency (NSA) is urging developers to shift to memory safe languages – such as C#, Go, Java, Ruby, Rust, and Swift. Could 2023 be the year of memory safety?
Embrace is a mobile application monitoring solution that helps you track and troubleshoot mobile app performance by combining data analytics, real user monitoring, network performance monitoring, and hardware monitoring in a single platform. We’re pleased to partner with Embrace to offer an out-of-the-box Embrace Datadog app and software license in the Datadog Marketplace.
Many organizations face complex regulatory requirements when it comes to monitoring the health and performance of their service and application infrastructure. As part of our ongoing commitment to providing a comprehensive monitoring solution for all customers, we’re pleased to announce that Datadog has achieved TISAX Assessment Level 2 (AL2) certification.
While cloud solutions can give you greater flexibility as you scale your infrastructure, limited visibility into resource utilization makes provisioning the right amount of compute resources challenging. To ensure that every workload is fully supported, many organizations may opt to over-provision, which leads to overspending. Or, in an attempt to maximize cost savings, organizations may under-provision, leaving workloads unsupported and risking serious performance impacts.
Rancher, the open source container management platform, uses Fleet to enable its continuous deployment features. Fleet brings GitOps functionality to Rancher. Fleet in Rancher 2.7.0 can fetch Helm charts from OCI registries. Using OCI registries to store Helm charts is an increasingly popular storage method. It allows storing your charts in a registry alongside your container images. This unifies the storage options for charts and reduces friction. Using a chart in an OCI registry is fairly simple.
We are excited to announce that deploying Kubewarden in air gap environments has been simplified and documented! For that, you will need a private OCI registry accessible by your Kubernetes cluster. If you’re unfamiliar with Kubewarden, it’s a policy engine for Kubernetes. Its mission is to simplify the adoption of policy-as-code. Kubewarden policies are WebAssembly modules; therefore they can be stored inside an OCI-compliant registry as OCI artifacts.
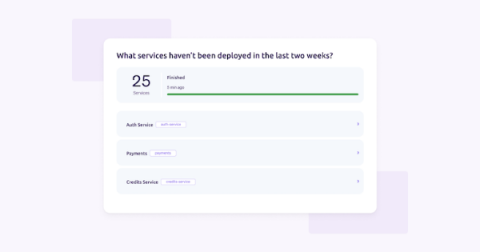
Whether you are a site reliability engineer, DevOps engineer, or application developer, you need visibility into the health and performance of every service you run or support. But in complex, dynamic environments, it can be difficult to ensure that all services are accounted for.
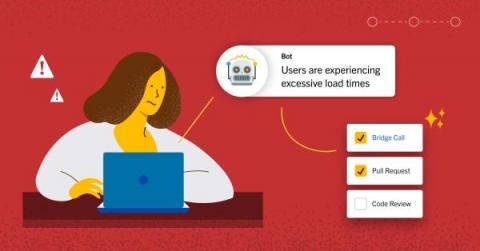
Today’s customers see availability as a given. What do they really want? Bigger, better technology with new features and faster platforms. But, according to our recently released Moogsoft State of Availability Report, teams burn their time, money and energy on incident management. In fact, engineers overwhelmingly report that incident management takes up most of their time.
For infrastructure administrators tasked with ensuring the reliable operation of their applications, the thought of a lurking cyberattack can be one to lose sleep over. An attack on your system and the services you provide could render your applications unresponsive, resulting in a security breach, or loss of data.
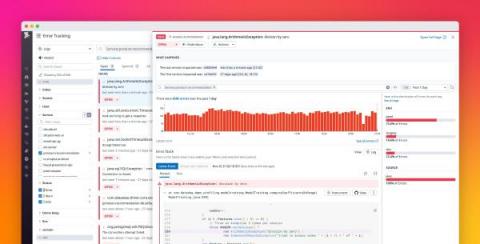
Reducing noise in your error logs is critical for quickly identifying bugs in your code and determining which to prioritize for remediation. To help you spot and investigate the issues causing error logs in your environments, we’re pleased to announce that Datadog Error Tracking is now available for Log Management in open beta.
Earlier this year, CircleCI added GitLab as the third version control system that we support, in addition to GitHub and Bitbucket. At CircleCI, it’s vital that we meet our users where they are, and many of our users are on GitLab. We were happy to make it possible for our users to build, test, and deploy via the GitLab platform.
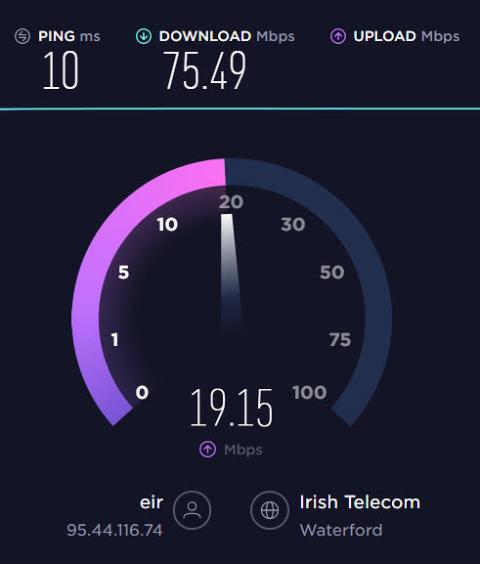
Find out how to monitor your Internet speed and quality and how well your ISP is performing.
When it comes to building RESTful APIs, PHP’s open source Laravel framework remains a top 5 backend framework for web development. Laravel also makes testing your API endpoints a breeze by providing an easy-to-use testing suite. In this post, we will build a token-based authentication API with Laravel, write tests for the endpoints, and automate the build and testing process with CircleCI.
Remote IT support software is an essential tool for supporting customers remotely from anywhere in the world. There are a number of factors that contribute to being able to choose the best solution to provide on-demand support. A good place to start is identifying your main purpose for the remote support solution. For instance, you can pinpoint if you need to remotely control an unattended device or support your customers who require privacy and guidance without directly controlling their devices.
SQL Server Monitoring has become an essential part of modern-day applications since a major chunk of these applications rely heavily on a database. It is therefore important to monitor your metrics and make the best out of your database services. SQL Server Monitoring offers plenty of metrics to choose from. We will be breaking down the five key categories that an SQL server provides for a comprehensive view of their functionality.
As Kubernetes becomes increasingly integrated across IT environments, organizations are growing more ambitious in how they use the technology, building established use cases like infrastructure management and microservices into new and ambitious fields like machine learning and edge computing. Is Kubernetes ready for this new era? What obstacles still lie in the way that risk slowing growth? Our Kubernetes State of Play for 2022 sought to answer these questions and more.
With advances in the field of IT, the amount of data needed to manage IT Operations has grown. In particular with more complex environments, such as the SaaS world, the amounts of data and raw data needed to manage operations have grown exponentially. Managing data manually has become a waste of professionals' skill sets, which could be better used in analyzing and applying the conclusions drawn from the raw data, and not dealing with basic issues that may arise.
We explain how to make the most of automation, orchestration, and Infrastructure as Code tools for your highest performing network yet.
In the analytics domain, fast and reliable storage is an important aspect for businesses to handle a large amount of data. There are different types of data storage including RDBMS, NoSQL, data lake, data warehouse, and graph database. Among these, the most widely used is RDBMS that powers various systems and applications of companies of all sizes. RDBMS is easy to use and straightforward to understand thanks to its table-based (or column-based) data format.
Earlier this year, StackState was named a Market Leader in the “2022 Research in Action (RIA) Vendor Selection Matrix (VSM) for Observability.” This is great recognition of the innovative path that we are on. We have focused on topology-powered observability, supported by our unique 4T® Data Model.
In a perfect world, technology stays on and runs flawlessly. But we all know this isn't the case. Like any organization, xMatters sometimes experiences unplanned incidents. What we can control is how we respond to them. To resolve incidents quickly, it's important to coordinate an organized response.
While conventional remote IT assistance software is super efficient for instant IT support, it can also come with data privacy and security concerns. So how do you create a balance between providing effective tech support and maintaining privacy and security? If you have customers in highly regulated industries such as healthcare, surveillance security, or industries that involve personal data or information this is an even more crucial question.
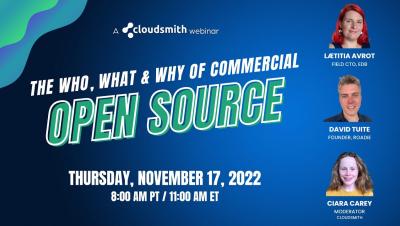
This article is based on conversations with Lætitia Avrot, Field CTO at EDB and David Tuite Founder of Roadie from our webinar on the Who What Where and Why of Commercial Open Source that you can watch here.
AI/ML is reinventing the reality of many industries, including retail. From brick-and-mortar stores to online marketplaces, retail companies are all increasing their investments in artificial intelligence, in order to gain a competitive advantage, better understand their customers and solve some of their long-lasting problems.
The Rancher Team are excited to announce the general availability of Rancher v2.7. Rancher v2.7 is a monumental milestone in the lifecycle of Rancher and introduces the ability to be a truly interoperable, extensible platform through the concept of extensions. The extensions now make it possible for users to build extensions on top of Rancher with complete autonomy.
Amazon CloudWatch provides Log Insights, a feature that can help you: CloudWatch Log Insights uses a proprietary query language with several basic commands. It provides sample queries for common AWS service log types, as well as query auto-completion. Learn more about CloudWatch Log Insights capabilities and how to use them.
GitLab is a complete DevOps platform that enables enterprises and organizations to deliver software to markets smoothly while ensuring high product quality. Software engineering practices use many testing techniques, from unit tests to integration tests. This article helps you understand software testing with unit and integration tests. It highlights the fundamental differences between unit and integration tests and demonstrates how to write integration tests for your applications.
As the tech industry goes green, how does your network stack up – and how can you make it greener?
JavaScript Immediately Invoked Function Expressions (IIFEs) are functions that are executed when they are initialized. An IIFE (pronounced “iffy”) can be initialized or defined to achieve a certain purpose. In this tutorial, you will learn about use cases for IIFEs and the benefits of using them over traditional functions. You will also write tests for your functions and integrate CI/CD for these tests.
So you have just installed the latest antivirus and turned on your shiny new firewall. Now your organisation is fully secure, right? The reality is that all the security products in the world will never be able to fully protect your data centre or your business from security threats. Because of the asymmetry between attackers and enterprises, cybersecurity is a problem that can never be solved and is never going away.
A friend of mine asked me how we build and publish our Visual Studio extension. His initial thought was that the process is manual and since the code is in a private repository, here's a quick walkthrough of building and publishing Visual Studio extensions with GitHub Actions.
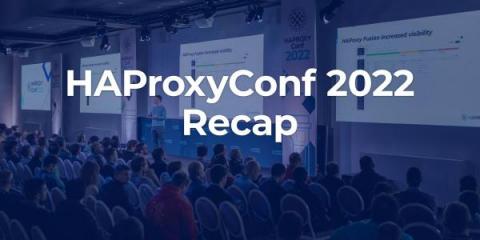
Earlier this month, I packed my bag and grabbed my lanyard to attend HAProxyConf in the beautiful city of Paris. I was far from alone: nearly 200 customers, colleagues, and community enthusiasts had the same idea. We overcame jetlag, stagefright, and introverted personality types for the joy of meeting and learning from some of the brightest minds in the industry. From load balancing to cybersecurity to endless cups of strong coffee: this is HAProxyConf 2022!
Are you curious about the difference between open-source Redis and Redis enterprise? Of course, Redis Enterprise is a hosted service that runs Redis db on behalf of its customers, while open-source Redis is available for anyone to use. However, there's also a key difference between open source and enterprise in how the clusters are implemented. In order to understand the difference, we need to know what Redis Clusters are.
s3gw is an S3-compatible service, focused on deployments in a Kubernetes environment backed by any PVC, including Longhorn (https://longhorn.io). Since its inception, the primary focus has been on Cloud Native deployments, however, the s3gw can be deployed in a myriad of scenarios, provided there is some form of storage attached.
Critics of open source software have long argued that giving everyone access to a project’s source code creates security issues. But in active projects with highly engaged communities, the opposite is actually true: Open source software helps organizations become more secure. That said, any piece of technology can be exploited.

Moogsoft pioneered AIOps, essentially inventing the market 10 years ago. It is worthwhile revisiting why we did that to understand where we are going. My background is as the founder and inventor of Micromuse Netcool, and the RiverSoft’s OpenRiver technology.
The pandemic has accelerated the trend toward remote working environments but it also pushed governance and security issues to the top of the priority list for IT departments within financial institutions. Employees, and developers in particular, need the technological agility to work remotely given the hybrid workplace model being adopted by the majority of organisations.
How can you judge Grafana vs. Chronograf and InfluxDB? Monitoring various systems is a crucial component of continuous maintenance. You can look at different parameters of the monitored system and take corresponding actions for certain conditions. For example, engineers can prevent server failure when they see the load on the server approaching its critical point. If the numbers of processed transactions (or registered users) exceed the expected level, you can celebrate your success.
A well-designed cloud architecture is essential to ensure that the underlying infrastructure stays operational, within budget, and compliant over time. These days, organizations are rapidly spreading their infrastructure across a broad, complex mesh of interconnected resources and services. It can be difficult to make high-level decisions about the design and management of these systems. This is why many organizations are now turning to cloud infrastructure modeling tools.
Pixellot’s automated sports production solutions revolutionize traditional video capture, production and distribution processes, enabling professional and amateur sports organizations to affordably cover and monetize their events. Pixellot’s patented technology streamlines the production workflow by deploying an unmanned multi-camera system in a single fixed rig (with additional angles as required), covering the entire field and delivering a stitched panoramic image.
Try to explain your network topology to a stranger in a bar and you’ll get a blank stare—the same look your CEO would give. Show that CEO a map, report or even your network monitoring dashboard, and recognition will creep across their face.
HG or HostedGraphite provides a complete infrastructure and application monitoring platform from a suite of open-source monitoring tools. Depending on the setup, you can choose Hosted Graphite as your data source and view all required metrics on beautiful Grafana dashboards in real time. Hosted Graphite offers a wide range of tools, add-ons, and plugins that make it possible to measure, analyze, and visualize large amounts of data about your applications with ease.
We are proud to share that Sunbird was recognized by CIO Insights as one of their 10 Most Innovative Data Center Companies to Watch. "We will present the leading data center companies in the world and their contribution to making the world more digital-friendly," said Richard Thomas, Editor, CIO Insights. "They are constantly innovating and disrupting the data center space with their ability to look at the future.
CircleCI notification orbs were built to deliver messages to the appropriate channels when a build is successful or when it fails. This helps everyone involved in a project stay up-to-date with the status of the latest build. In this tutorial, you will explore and implement notifications sent to a Slack channel and also sent via SMS. To accomplish this task, you will make use of the Slack and Twilio orbs from the CircleCI orb registry.
Monitoring any type of resource can be challenging. But Kubernetes monitoring is a special kind of challenge. Not only are there a variety of different Kubernetes layers and resource types to monitor, but collecting monitoring data from Kubernetes can be difficult if you use a managed Kubernetes service that limits your access to the underlying infrastructure. For all of these reasons, Kubernetes monitoring requires a different approach.
Today, large enterprises are using multiple cloud providers and technologies. Enterprises dealing with distributed loads on their on-prem infrastructure, private clouds, and public clouds need teams that are versed in writing different CLI commands and scripts in multiple languages and require specialists in these fields. Unfortunately, all of this bears a hidden cost since the company has to train its employees in multiple technology stacks to manage different infrastructures.
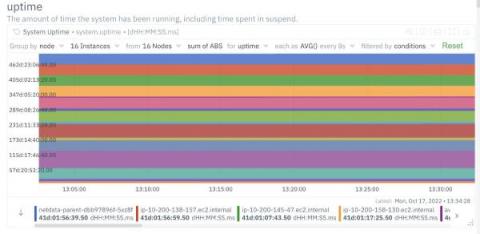
Monitoring the health and status of nodes and servers is a critical part of effective infrastructure monitoring.
FreeBSD is a high-quality, stable, and secure operating system used in a wide variety of applications, and we want to show you how monitor FreeBSD systems painlessly and effectively.
For the last few years, many development teams have replaced traditional data centers with cloud-hosted infrastructure. Cloud adoption continues to grow, and teams are updating applications to leverage cloud-based services. But for many organizations, adopting a single cloud provider to host all their applications and data can put their business at risk. To reduce these risks, some organizations are distributing resources across multiple cloud providers in a specifically designed way.
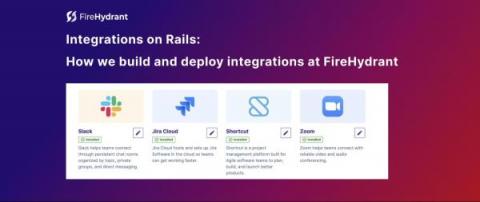
Implementing integrations without a mountain of technical debt can be challenging. But it doesn’t have to be all bugs, burn out, and outages when shipping integrations at a high volume. We’ve unlocked a pattern at FireHydrant to rapidly build and release integrations without swiping the technical debt credit card each time — and that gave us a fastlane to building premier integrations.
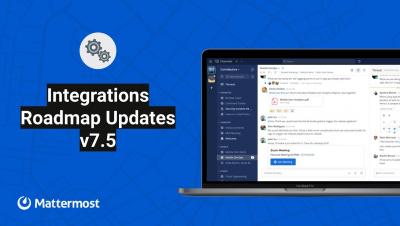
Mattermost v7.5 is generally available today. The following new features are included (see changelog for more details).
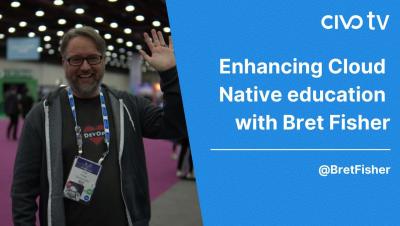
We spoke with two members from the SRE team, Alex Blyth and Zulhilmi Zainudin, to learn more about their role at Civo. Through this series, we aim to provide you with an overview of the different roles we have at Civo and what advice our team has. You can discover more about our team in our “day in the life of a Go Dev” and “day in the life of an Intern” blog.
Before I dive into the launch of Cycle’s latest feature (and it’s a big one!) I want to share some context about how we got here. Let’s rewind back to 2015: containers, at least in their modern form, had just begun to take the developer ecosystem by storm. At the same time, we at Cycle were watching everything unfold: from Docker’s meteoric rise to the first few releases of tools like Kubernetes, Rancher, and so on.
Most engineering teams are no strangers to key performance indicators (KPIs), those metrics tracking progress toward critical goals and targets. Ideally, tech leaders design KPIs to focus teams on what matters and prove their contribution to the company’s overall performance. Of course, KPI data should also uncover critical information that guides informed decision-making. For engineering teams tasked with managing the customer experience, KPIs often track availability.
Docker is a PaaS product, developed by Docker.Inc to containerize applications. It does so by combining app source code with OS libraries and dependencies required to run that code in any environment. Kubernetes is a similar tool developed by Google, which scales up this containerized application after deployment. While one works in building the containers the other essentially helps in scaling it up, then why so much buzz around these two?
Designing a production service environment around Apache Kafka that delivers low latency and zero-data loss at scale is non-trivial. Indeed, it’s the holy grail of messaging systems. In this blog post, I’ll outline some of the fundamental service design considerations that you’ll need to take into account in order to get your service architecture to measure up. Let’s start with the basics.
Are you trying to choose between Grafana and Splunk, but can't find enough information about their capabilities? In this blog, we highlight the details of why a user should select Grafana OR Splunk as part of their monitoring stack and what are the user benefits of each. Also, you can check out what it's like to make your own Grafana dashboard using our MetricFire free trial. Get onto the product in minutes and see if you prefer Grafana over Splunk.
In a data center, the power chain is the sequence of infrastructure equipment that distributes power from its source all the way to the IT devices. Most data centers use alternating current (AC) power, though telecommunications companies typically use direct current (DC) power. There are pros and cons to each, and they require different equipment.
Your software development team has an enormous number of tools available to them. Some older tools are being used in new ways, which has inspired the creation of more new tools to choose from. For example, JavaScript has grown from a language used to add interactivity on websites to a full-stack language for both frontend and backend needs. JavaScript has paved the way for Express, Nest.js, and many others.
Cloud 66 turned ten this year! While this is a big deal for us, I understand that it is not important to you. After all, who cares if a company turns 10, right? So, why am I writing about it, and why do I think you might also be interested in this? Since we started Cloud 66 in 2012, we and the world around us have changed significantly. We are no longer a scrappy startup with only big dreams to keep us going. Today, hundreds of customers rely on us daily for critical parts of their business.
IoT Device Management Guide The Internet of Things has been raising lots of discussions and debates (of course for the benefits it offers). According to IoT Analytics, the number of connected IoT devices crossed 12 billion in 2020, which was 2 billion more than the estimated devices. Recent trends indicate that this technological transformation will not just be restricted to random “things” but will be ubiquitous, or what few are calling the Internet of Everything.
15 November 2022: Canonical announced today the availability of new enterprise-grade Ubuntu images designed for next-gen Intel IoT platforms. Purpose-built for industrial environments and use cases, the latest Ubuntu images on Intel hardware deliver the performance, safety, and end-to-end security enterprises expect from the most widely used Operating System (OS) among professional developers with latest Intel technologies pre-enabled and available.
Mean time to resolution (MTTR) is a metric that transcends industry and technology. It’s a measure of how quickly, on average, support teams identify, act, and resolve IT issues and incidents. Because MTTR directly relates to service quality, maintaining a low MTTR is a critical goal for DevOps and SRE teams. These teams have a vested interest in resolving issues quickly because escalating incidents to higher levels of the support team increases response and resolution times.
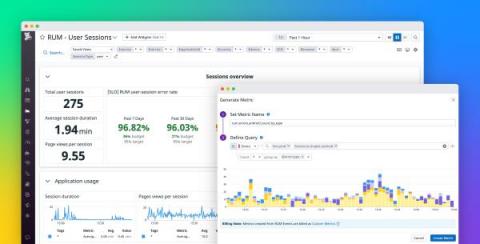
Datadog Real User Monitoring (RUM) provides end-to-end visibility into the user experience and performance of your browser and mobile applications. RUM allows you to capture and retain complete user sessions for 30 days. This means you can pinpoint bugs, prioritize issues, and determine fixes with data collected across an entire quarter.
In 2021, the Biden administration issued an executive order outlining that the government and private sector need to work together to combat cyberthreats and improve the nation’s collective cybersecurity stance. As cyberattacks become more common and more costly, the United States — like other nation-states — needs to do everything it can to prevent attacks and rapidly respond to them when they occur, which requires modernizing its approach to incident response.
The use of cloud computing by financial institutions has significantly increased in the last few years, a trend that was further accelerated by the COVID-19 pandemic. In the next few years, financial institutions will need to continuously balance the pressure to innovate quickly while managing risk and combating financial crime.
Data is becoming increasingly essential to businesses globally, allowing for insights to be gathered around critical processes and operations. Over time, the traditional systems put in place to hold our data have become unsuitable for modern-day needs due to the continuous growth of data. Edge computing has emerged to reshape the current computing environment and allow data to be processed closer to where it’s being generated.
Cloud costs can pile up quickly, and often behind the scenes. We explain how software-defined cloud interconnect (SDCI) can help your business rein in a swelling budget.
If you’re writing software today, then you likely use a CI/CD pipeline to build and test your code before deploying it to production. Having a fast and efficient build pipeline saves you development time, shortens feedback loops, and helps you ship features faster. Conversely, slow and unreliable build pipelines are full of lost productivity and sadness.
In this post, we'll learn all about the incident metric mean time to detect (MTTD). We'll see how to measure it and look at its relationship with other incident metrics like MTTR (mean time to recover). Both metrics give useful insights into your incident recovery ability.
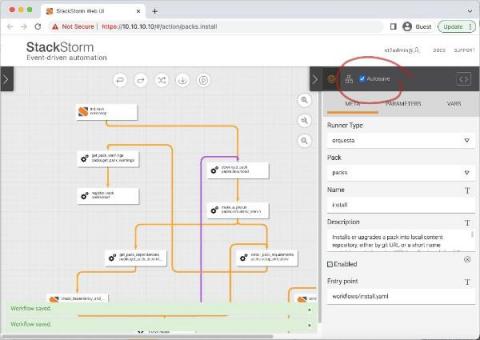
The StackStorm team is preparing the v3.8 release, and we'd like to highlight some new features and enhancements that are coming up in the Web UI.
You know what data centers* are, we’ve told you a lot about the on this blog. Today, however, it is time to check out a particular aspect such as the singleness of their architecture**. In addition to what role they play in the present and which one they will play in the future. * Physical facility that organizations use to host their information, applications, critical data… **There’s a good example of alliteration, great rhetorical figure. So let’s go!
Every day, businesses monitor system resources for performance, security, performance, and workflows. Otherwise, they jeopardize day-to-day operations when issues go unnoticed. Tableau presents itself as a data-driven monitoring tool that enhances data analysis of physical and virtual server environments. But just how good is it?
SolarWinds is a network and application monitoring solution, but primarily a network monitoring solution. Founded in 1999, the company has built an online community of 150,000 registered users. However, monitoring has come a long way since the early 2000s. How does SolarWinds stack up against MetricFire in terms of features and pricing? In this article, we break down the comparison into easily digestible, unbiased information to help you make an informed decision.
PU, memory use, latency, network bandwidth. These are just some of the monitoring metrics businesses analyze for security and performance. But successful data-driven organizations delve deeper than this. These companies probe millions of real-time metrics for unexpected insights and predict outcomes weeks, months, and years into the future. ELK helps them do this. It's a data analytics platform from open-source developer Elastic.
Properly testing a service’s APIs to ensure that it can handle production traffic presents many challenges for engineers—SREs need to guarantee the resiliency of their application, while developers must ensure that their features perform well at any given scale. Speedscale is a testing framework built for Kubernetes applications that enables you to load test with real-world production scenarios by replaying actual API traffic that your application has experienced.
Though organizations are projected to pump $4.4 trillion into IT spending this year, the supply of developer talent has struggled to keep pace, and many companies are having a hard time hiring workers. This is due to the fact that today’s top-performing developers understand their value and are increasingly asking for more money and better benefits when considering job offers.
Monitoring HTTP sessions offers a potentially powerful way to gain visibility into your web servers, but in practice, doing so can be complex and resource-intensive. Extended Berkeley Packet Filter (eBPF) technology allows you to overcome these challenges, giving you a simple and efficient way to process application-layer traffic for your troubleshooting needs.
Use Netdata to effectively monitor and troubleshoot the performance of NVMe (Non-Volatile Memory express) disks in your infrastructure. Preempt disk failures and take action to ensure your systems run without a glitch.
Development operations (DevOps) combines best practices, cultural transformation, and tools to improve your organization’s software development and delivery velocity. Teams can employ DevOps regardless of an organization’s size and continuously deliver new software features, updates, and patches to enhance software quality and customer experiences.
When it comes to visualization tools, there are various options, all designed for different kinds of data. Some of the most recognized among them include Grafana and Tableau. If you’re not sure which one to use, this article should give you a better idea of what kind of purpose each one has and which one will suit your needs best. One great way to find out what tool works best for you is to try it out! Try out Grafana in seconds on MetricFire's Hosted Grafana free trial.
Data-driven businesses need the latest monitoring metrics for a multi-dimensional perspective of their servers, networks, applications, and other infrastructure capabilities. Without the latest data, these organizations can't optimize security and performance protocols.
A lot of organizations are using Grafana to visualize information and get notified about events happening within their infrastructure or data. In this article, we will show how to create and configure Grafana Alert rules. To get started, log in to the MetricFire free trial, where you can send metrics and make Grafana dashboards right on our platform.
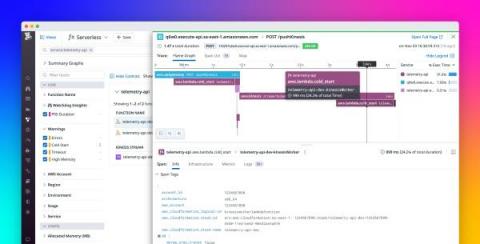
In 2021, we partnered with AWS to develop the Datadog Lambda extension which provides a simple, cost-effective way for teams to collect traces, logs, custom metrics, and enhanced metrics from Lambda functions and submit them to Datadog.
A single-line diagram (also known as an SLD or one-line diagram) is a simplified representation of an electrical system. Symbols and lines are used to represent the nodes and connections in the system, and electrical characteristics may be included as well. In a data center, a single-line diagram is used to visualize the power distribution system to improve planning and troubleshooting, ensure redundancy, and reduce potential outages.
How can you tell if your systems are reliable when under load? A common answer is to open your observability dashboards, wait for a high-traffic event (like Black Friday), and cross your fingers. While this approach is certainly effective, it's far from ideal. Without proactive reliability and load testing, we have no idea if a system will hold up to real-world usage patterns, which could mean a production outage at the worst possible time.
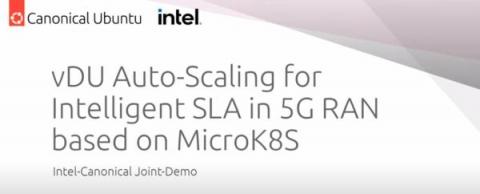
RAN has incrementally evolved with every generation of mobile telecommunications, thus enabling faster data transfers between user devices and core networks. The amount of data has increased more than ever with an increase in the number of interlinked devices. With existing network architectures, challenges lie in handling increasing workloads with the ability to process, analyse and transfer data faster. The 5G ecosystem requires virtual implementations of RAN.
Detroit, known by its nickname “Motor City'', is a bustling and beautiful city filled with dazzling architecture, food, history, and of course, people.This year, it was home to KubeCon 2022. The city is close to home for Jake and I, 45 minutes from where we started Cycle; it was wonderful seeing how the city has grown the last few years. The art deco style buildings loomed overhead, and the smell of freshly cooked food wafted through the downtown area just outside the venue.
The process of delivering mobile apps utilizing cloud technology is known as mobile cloud computing (MCC). Complex mobile apps today carry out activities including authentication, location-aware features and providing users with customized communication and content. As long as your device is online, mobile cloud computing enables you to store and access data anywhere. This makes it possible for data to be sent without difficulty anytime required.
It’s a fact of life: as the Kubernetes API evolves, it’s periodically reorganized or upgraded. This means some Kubernetes resources can be deprecated and later removed. We deserve to keep track of those deprecations and removals easily. For that, we have just released the new deprecated-api-versions policy for Kubewarden, our efficient Kubernetes policy engine that runs policies compiled to Wasm.
In this article, we present an overview of cluster monitoring using Rancher and Prometheus as well as provide some brief setup tutorials for both tools. We further introduce a metric visualization tool called Grafana that transforms your Prometheus time-series data into graphs and visualizations. MetricFire specializes in monitoring systems. You can use this product with minimal configuration to gain in-depth insight into your environment.
In this article, we are going to look at how to monitor Redis performance using Prometheus. This will allow Redis Administrators to centrally manage all of their Redis clusters without setting up any additional infrastructure for monitoring. To follow the steps in this blog, sign up for the MetricFire free trial, where you can use Graphite and Grafana directly on our platform.
Web servers are among the most important components in modern IT infrastructures. They host the websites, web services, and web applications that we use on a daily basis. Social networking, media streaming, software as a service (SaaS), and other activities wouldn’t be possible without the use of web servers. And with the advent of cloud computing and the movement of more services online, web servers and their monitoring are only becoming more important.
The Apache HTTP Server (Apache HTTPd) is one of the most popular open source web servers available. HTTPd was also the first project developed by the Apache Software foundation which now supports hundreds of well known projects including Kafka, Cassandra and Hadoop. Netdata has a public demo space where you can explore different monitoring use-cases. Check out the Apache demo room to explore and interact with the charts and metrics described here.
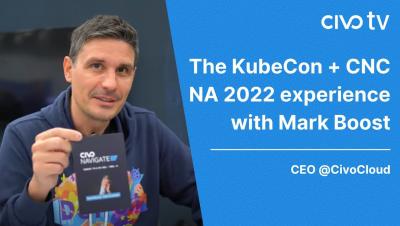
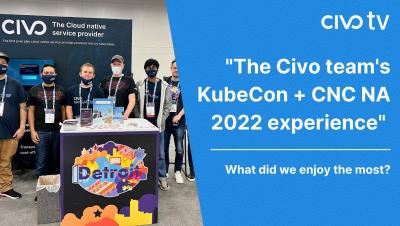
Throughout KubeCon + CloudNativeCon NA 2022, our team was able to speak to over 100 people from the cloud-native community to learn more about their thoughts and experience of the event. This blog will explore what the community thought was the hot topic of discussion at KubeCon + CNC NA 2022, which includes topics such as security, cost, and developer experience. Check out the full video below.
Engineering teams use a lot of single-domain monitoring tools. In fact, the average team manages and maintains 16 monitoring tools — and up to 40 — according to Moogsoft’s State of Availability Report. While IT leaders select and implement these tools to save teams time, our research finds they do quite the opposite. Engineers spend far and away more time on monitoring than they do on any other task — innovative, value-creating tasks included.
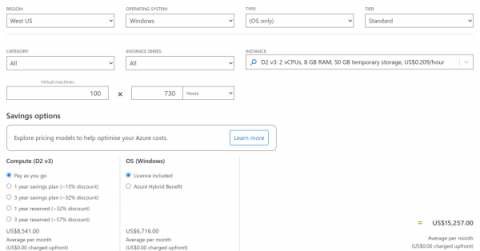
So, you’ve decided to use Azure as your primary cloud platform and want to calculate your infrastructure costs. You estimate them based on listed prices, and rest assured that your startup/project will meet its budget. And then, suddenly, at the end of the month, you receive an invoice from Azure for an amount two times higher than you originally expected.
Distributed denial of service (DDoS) attacks are an ongoing issue for communications service providers, putting critical systems at risk, undercutting service level agreements, and bringing unwanted headlines. In the first half of 2022 6 million of these attacks were reported. Some metrics of DDoS attacks in 1H2022 compared to 2H2021.
Most well established data teams have a clear remit and a well defined structured for what they work on and when: from the scope of their role (from engineer to analyst) to which part of the business they work with. At incident.io, we have a 2 person data team (soon to be 3) with both of us being Product Analysts.
A guide to set practical Service Level Objectives (SLOs) & Service Level Indicators (SLIs) for your Site Reliability Engineering practices.
Looking at the report that Gartner did in 2022 regarding top technology trends, AI engineering represents an important pillar in the near future. It is composed of three core technologies: DataOps, MLOps and DevOps.The discipline’s main purpose is to develop AI models that can quickly and continuously provide business value. For instance, models that enable cross-functional collaboration, automation, data analysis, and machine learning.
On 8 November 2022, at Open Source Experience Paris, Canonical announced that Charmed Kubeflow, Canonical’s enterprise-ready Kubeflow distribution, now integrates with MindSpore, a deep learning framework open-sourced by Huawei. Charmed Kubeflow is an end-to-end MLOps platform with optimised complex model training capabilities designed for use with Kubernetes.
These three top cloud providers are used daily by millions of users across the world – but what sets them apart? We take a magnifying glass to the features that matter.
For a successful business, you need to introduce an effective monitoring system covering all areas of your business and infrastructure - servers, databases, services, overall traffic, and even revenue collected. The users of this monitoring system can be system administrators, software engineers, information engineers, as well as all sorts of analysts.
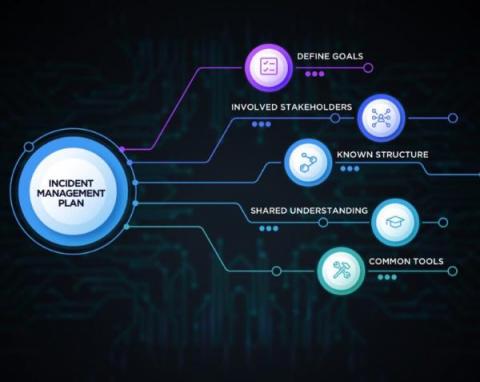
In this podcast, our panellists discuss the foundations that any team needs to put in place when designing their incident management process. Starting from the basics of defining what we really mean by an incident, to how to set your severity levels, roles and statuses, Chris and Pete share their tips for building solid foundations to run your incidents.
As a former incident responder and now as a responder advocate for FireHydrant, I’ve seen the “build vs. buy” debate play out many times. In fact, I even supported the tool that former employers used for managing incidents for years before they decided to buy (more on that in a future blog post).
History will look back on this period of the 21st century as a pioneering, resilient, and excitingly disruptive time. We’re deep into a dynamic era as the cloud, Artificial Intelligence (AI), IT automation, and digital transformation converge to drive challenges and dazzling opportunities. The sheer force and potential of AI—coupled with unprecedented security risks and ongoing infrastructure advances will shape enterprises for years to come.
At the start of October, Dinesh Majrekar, CTO, and Mark Boost, CEO at Civo spoke at KubeCrash, about application deployments of old, cloud-native processes of today and edge native deployments of the future. Watch their session below to learn about the challenges we are about to face with an edge-first architecture and what we can do today to be ready. We then took to Detroit for KubeCon + CNC NA 2022 where we hosted an array of talks, workshops, and events.
Both servers and software development use Linux. Today, Linux distributions are used by the vast majority of electronics and embedded systems. Worldwide, Linux servers make up about 90% of all internet servers. Additionally, the Linux kernel is used by around 80% of all smartphones. Today, every system in the world is linked via a network. Information exchange across systems requires network connectivity. Computer networking refers to communication over the internet as well as within a network.
Modern applications are a web of interdependent services. As applications grow in size and complexity, and as more engineering teams adopt service-based architectures like microservices, this web becomes deeper and denser. Eventually, keeping track of the interdependencies between services becomes a complex and time-consuming task in and of itself. In addition, if any of these dependencies fails, it can have cascading impacts on the rest of your services and on the application as a whole.
Docker is one of the most popular tools for containerization, and several tools have been developed by the open-source community to monitor what happens inside of Docker containers. This guide focuses on one tool specifically: cAdvisor.
Good incident management is critical to the successful running of any business. Get it wrong, and you risk damaging customer trust, brand reputation and, above all, your bottom line. In this article we’ll give you a 101 on incident management: what is it, why does it matter, and how can you do it well?
In technology, nothing is static. We need to be open to experimenting with new platforms and avoid getting locked into any one single entity or technological solution. With all the recent events, many people are looking for alternatives where they can post microblogging content like they did on Twitter. Mastodon has recently become significantly more popular due to its decentralised nature and the power of enabling different communities to define themselves.
Securing a Kubernetes cluster is far from a simple task. How do you know if you have correctly configured volumeMounts in your in-cluster containers? And what about all those workload resources, such as Deployments, Jobs, Pods, etc? Luckily, you can use Kubewarden, an efficient Kubernetes policy engine that runs policies compiled to Wasm. This means you can run powerful specifically-written policies, our reuse existing Rego policies for example.
The Serverless framework is an open-source framework written in Node.js that simplifies the development and deployment of AWS Lambda functions. It frees you from worrying about how to package and deploy the application to the cloud, so you can focus on your application logic. Serverless applications are distributed by design, so good code coverage is vital, and should include unit testing.
As you might be aware, each team has its own unique workflow based on the project type, size of the company, team preferences, and a number of other factors. The larger the team, the more difficult it is to keep things under control: disputes become more regular, delivery deadlines may postpone, priorities always change - the list may go on and on. Adapting Git is the first step in resolving these challenges, as it can be used in almost any workflow.
Software development and the DevOps lifecycle now requires continuous integration and delivery, also referred to as CI/CD. To help users automate the steps between a developer checking in code and releasing that code into production, open source CI/CD solutions are created.
Today we will look at monitoring Hashicorp’s Nomad platform using a combination of Prometheus and Grafana. But first, a quick recap of all 3 tools.
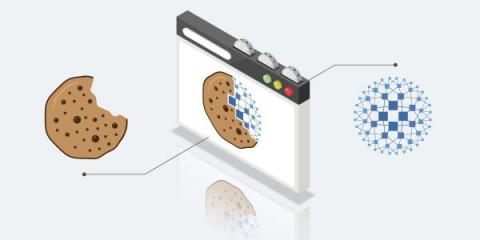
My colleague Baptiste previously published an article on how to protect cookies while offloading SSL. I recently encountered a customer who wanted to achieve a very similar goal but using a more recent HAProxy Enterprise version. This post will explain the best practices for how to secure your cookies using HAProxy Enterprise.
Welcome to the concluding blog of this mini-series on tapping into the fourth industrial revolution. In Part I, we introduced and assessed the current status in the IT and OT domains. In Part II, we discussed the automation pyramid of modern factories and the need to adopt a more holistic approach toward closing the divide.
Are you looking to build a Gatsby website with markdown? This post will take you through the Gatsby development process, from creating the project to deploying it in production on AWS. We will talk about the benefits of using Gatsby and show how to set up markdown, configure Gatsby, and build an article for your demo website.
Don’t forget, it’s the hardware that makes the cloud The main issues we see with clients and cloud implementations are that it can be very difficult for them to get a clear idea of what it is they are buying and how well it will perform. While the consumption and billing models are clear, it can still be hard to know how much you will pay each month. But what is hard is predicting exactly what the level of performance you will get. Some of this is inevitable.
Your release management process is one of the most critical processes in your organization’s toolkit. An excellent release management process can accelerate software release workflows, allowing your team to deliver software consistently and predictably and ensuring that your customers have an optimal brand experience. But release processes can have weaknesses that slow your team down and can even introduce risk to every release.
Google Kubernetes Engine (GKE) is a managed Kubernetes service that enables users to deploy and orchestrate containerized applications on Google’s infrastructure. Datadog’s GKE integration, when paired with our Kubernetes integration, has always provided deep visibility into the health and performance of your clusters at the node, pod, container, and application levels.
The health management APIs in Netdata allows teams to eliminate unnecessary alerting during scheduled maintenance, testing, auto scaling events, and instance reboots. For all SREs, it is absolutely crucial to filter out expected events during maintenance windows and quickly pinpoint critical issues in your infrastructure. Every minute is crucial while dealing with troubleshooting issues and any distractions that may hijack the troubleshooting process should be subdued.
Kubecon 2022 just concluded with plenty of exciting announcements, including our new open-source project, Helm-Dashboard, but we’ve got some more news to share on top of that.
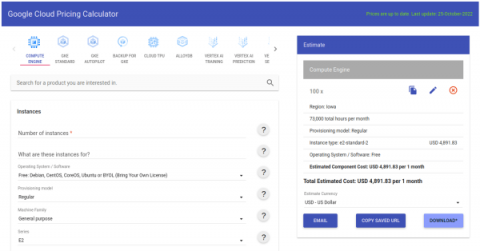
If you’re embarking on a new project and evaluating public clouds, the cost involved will be one of your main considerations. You might decide to use Google Cloud Platform (GCP) as your primary cloud platform. If so, you’ll want to estimate costs based on listed prices. But it might surprise you to find a higher bill than you originally expected.
Business organizations that want to save money and be competitive take into consideration the time costs associated with investments in new technologies. Will the efficiency gains translate to a rapid return on investment? Will users embrace the change and be more productive? Or will those investments be a hassle to employees and result in time-wasting workarounds and a fallback to inefficient, manual processes?
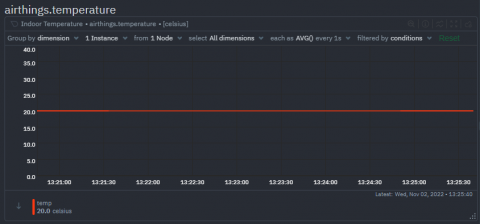
Monitoring indoor air quality with Airthings and Netdata. Understanding and measuring common contaminants and pollutants reduces your risk of air quality health concerns.
We eat lots of our own dog food at MetricFire, monitoring our services with a dedicated cluster running the same software. This has worked out really well for us over the years: as our own customer, we quickly spot issues in our various ingestion, storage, and rendering services. It also drives the service status transparency our customers love. Our customers include large multinational coffee brewers, game companies, and other data science/SaaS companies.
An incident can take many forms. It can look like a small issue that locks a few customers out of their accounts or a huge catastrophe that brings down your entire product for a full day. How you respond to the incident should vary based on the impact of the incident. And that’s where severity comes into play. Defined severity levels are crucial to any good incident management program.
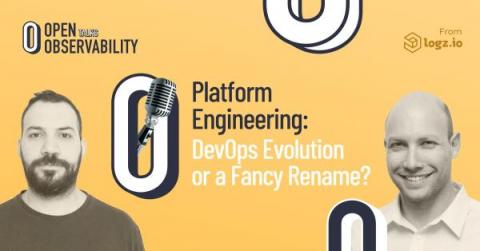
Everyone’s talking about Platform Engineering these days. Even Gartner recently featured it in its Hype Cycle for Software Engineering 2022. But what is Platform Engineering really about? Is it the next stage in the evolution of DevOps? Is it just a fancy rebrand for DevOps or SRE? As a veteran of the PaaS (Platform as a Service) discipline about a decade ago, and a DevOps enthusiast at present, I decided to delve into this topic, peel off the hype, and see what it’s about in practice.
IT admins face pressure from all sides. Besides tracking and securing data across devices, they must also manage a changing inventory of physical and digital assets while adhering to an executive directive to make technology an enabler for growth. Software deployment can be a particularly daunting task. Deploying software through an automated solution is just a click of a button, but what are the don’ts to keep in mind?
Cyber Essentials is a UK government backed scheme, developed by the National Cyber Security Centre. Since its inception the scheme has become the benchmark for IT security, helping organizations to deploy technical controls to guard against the common types of cyber-attacks and improve data security.
Most software companies rely on DevOps at some scale to aid their software development and deployment processes. DevOps has recently seen a major increase in popularity due to the advent of cloud-based tools and automation possibilities. DevOps can help you completely forget the woes of deploying software and focus better on building better apps and providing a holistic experience for your end user. However, just like other things in tech, DevOps is not perfect.
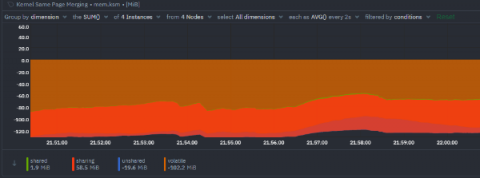
Monitoring KSM (Kernel Same-page Merging) performance at deduping memory shared across VMs.
The events over the past two and a half years have radically changed the world. Digital transformation initiatives went from being a priority to an urgent imperative. Enterprises that had not already migrated data to the cloud rushed to do so during the pandemic, and others accelerated their on-premise-to-cloud shifts. Hybrid and multi-cloud environments become the new reality for many organizations who want to get the most out of their on-premises and cloud investments.
Are you interested in learning how to monitor Nginx? In this post, we'll show you all about how Nginx works and how you can use Hosted Graphite to monitor it. First, we'll read what Nginx monitoring is all about and how it can together work with Prometheus. Nginx, pronounced like “engine-ex”, is an open-source web server that, since its initial success as a web server, is now also used as a reverse proxy, HTTP cache, and load balancer.
Businesses need a new, more flexible solution to make digital transformation far easier, says Daniel Blackwell, Product Manager – Networks & Security, Pulsant Digital transformation can provide businesses with a more flexible approach to infrastructure that simplifies the delivery of services and applications. However, this journey to digital transformation can introduce its own complexities that require a new way of thinking.
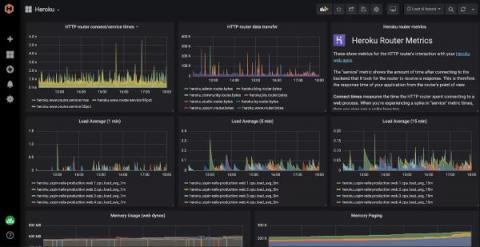
Application monitoring plays a critical role in the success of your digital products. As you monitor various performance metrics such as usage of CPU, memory, network traffic, and more, you can swiftly take pre-emptive actions before things develop into a larger problem. In spite of the importance of monitoring, the task can become challenging when your infrastructure exists across multiple cloud platforms including AWS and Heroku.
This is the third blog from a series focusing on how public clouds meet telecommunication operators’ business demands. In the previous two blogs, we talked about how Amazon Web Services (AWS) and Google Cloud Platform have enabled telcos to run critical workloads on public clouds. In this last part of our series, you’ll hear about Microsoft Azure cloud and why it’s a trusted platform for the telecommunication industry to host their workloads.
Welcome to the November 2022 edition of Open Source Matters where we cover the latest news in open source technology. I’m your host, Ben Lloyd Pearson, let’s dive in.
OpsRamp’s Operating System Patch Management module is a flexible, yet powerful capability provided to all OpsRamp platform customers or licensed separately. With our SaaS-based OS Patching solution for Windows and Linux endpoints, you can automate the entire patch management process from identification of missing OS patches to the process of patch installation.