Operations | Monitoring | ITSM | DevOps | Cloud

From Answers to Assets: Open 360 AI Chat Can Now Create Your Alerts and Dashboards

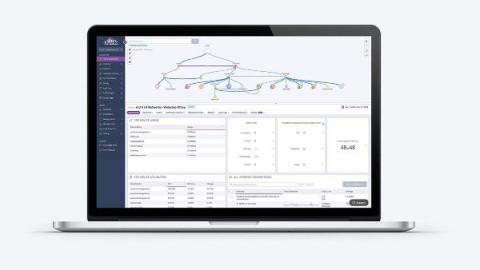
Open 360 AI chat can now do more than investigate and explain. With new Logz.io API skills, the agent can create and manage Open 360 and Cloud SIEM objects, such as alerts and dashboards, directly from the conversation. Find an error pattern worth watching? Ask the agent to create the alert. Need a view of a service you just investigated? Ask for the dashboard. The insight and the follow-through now happen in the same place.

How Amazon Bots Are Changing the Race for Sold-Out Products

Customers may have only a few moments to purchase a popular item when it comes back in stock on Amazon. Constantly refreshing product pages can be exhausting, and even spotting a restock does not mean you will have enough time to complete the order. Automation offers a more practical approach. With an Amazon bot, shoppers can monitor specific products, receive availability alerts, and respond faster without spending the entire day checking Amazon manually.

Grafana Campfire - Assistant powered Dynamic dashboards - (Grafana Community Call - August 2026)

Many times, it feels like you're maintaining multiple versions of the same dashboard (with a slight modification), *OR* simply spending more time writing queries rather than actually looking at the actual data? In this Campfire community call, we're taking a deep dive into two things that are reshaping how Grafana dashboards get built: Dynamic Dashboards and the Grafana AI Assistant and showing you how to combine them to go from a blank canvas to a reusable, production-ready dashboard in minutes.

Trace an AI SRE Agent: AURA Docker Quickstart with Phoenix and OTel

You get an answer from the agent and no way to check how it got there. The route it took is recorded, and so is the reason it gave for taking it. AURA emits OpenTelemetry spans, and the Docker quickstart wires them straight into Phoenix. Four services come up together: AURA Web Server as the persistent agent harness, LibreChat as a browser interface for chatting with the agent, Phoenix to receive the spans, and MongoDB to store stateful data for LibreChat. The Compose file arrives pre-configured to point AURA at Phoenix and to enable content recording for the local demo.

The role of AI in website monitoring : How AI is rewriting the rules of website monitoring

A peak sale season, missed transaction or availability issues, spiking customer tickets, and unhappy customers. Well, you know the trope. A few years ago, this was just part of doing business online. Today, it’s a problem you can avoid, thanks to artificial intelligence. We’ve quietly reached an important turning point in website monitoring. For most of the internet’s history, monitoring meant setting thresholds: set a number, wait for it to be crossed, get an alert, and fix the issue.

Monitor dependencies now available in the v3 API

Monitor dependencies are now available through the StatusGator v3 API. The new endpoint lets you programmatically retrieve the relationships and dependencies associated with a monitor, giving your integrations and internal tools more context about the services each monitor relies on. Dependencies are already available in the StatusGator UI for Website, Ping, and Custom monitors, while StatusGator automatically identifies relationships for many Service monitors.

Migrating from Patch Manager Plus On-Premises to Cloud: A practical evaluation guide

Ever heard of Murphy's Law of IT Administration? It states that the server hosting your security tools will go down at the exact moment a critical vulnerability is making headlines everywhere. Whether it's a sudden power shutdown, a database hiccup, or a local network failure, losing access to your central management tools right when you need them most is every IT team's worst nightmare.

Recurring Office Hours with the AI SRE Agent Team Behind AURA

Building an agent and not sure how to approach something? Bring it. AURA office hours are recurring working sessions with the people who build it. The team has been talking to people trying out AURA and hearing the same good questions come up more than once. Office hours are the answer to that: a standing slot on a schedule, rather than one conversation at a time. The format is deliberately loose. Nobody is arriving with thirty slides to spend an hour talking at you. The session goes wherever the questions go.

Control trace volume with OpenTelemetry tail-based sampling

OpenTelemetry (OTel) tail-based sampling helps teams control trace volume by retaining errors, slow requests, and other traces worth investigating while dropping lower-value traffic. In distributed systems, a single request can fan out across many services, each emitting spans. That volume adds up quickly. Some applications produce millions of traces per hour, while large clusters generate more than 10 billion spans per day.

How Network Documentation Software Keeps Network Diagrams Current

When did anyone last open your network diagram and trust what it showed? A diagram drawn in a static drawing tool is accurate on the day it is saved. One quarter, two circuit upgrades and a hardware refresh later, it describes a network that no longer exists. Nothing warns you that this has happened. The file still opens, still prints, and still gets attached to change requests, which is what makes it risky during an incident.

Storage Monitoring Tools and the KPIs Behind Each Failure Domain

When an application slows down, how long does it take to confirm whether storage caused it? The answer depends entirely on whether anything is collecting from the array itself. The server dashboard reports healthy CPU and memory, the network graphs look clean, and the array holding the data says nothing at all. Storage failures announce themselves late.

Why AI Agent Orchestration Needs Runtime Context Between Agents

Every multi-agent system depends on one agent handing its output to the next, and nothing in the architecture confirms that the handoff carried what it should have. Orchestration adds a failure surface that single-agent architecture doesn’t have: a point between every two agents where one has to trust that the other passed along everything it needed, unverified.

How to scale Alloy as a central telemetry gateway: capacity planning, load testing, and production lessons

Running Alloy as a single-instance sidecar is simple. Running it as a centralized gateway that absorbs the full telemetry stream of an enterprise platform—tens of millions of active series, terabytes of logs per day, and tens of thousands of trace spans per second—is a different challenge altogether. To get it right, you need deliberate capacity planning, honest load testing, and a monitoring setup that doesn't rely on the very thing you're testing.

Automate Your Entire Incident Response with Skylar Automation

See how Skylar Automation transforms incident response by orchestrating workflows across the tools your teams already use. In this demo, watch Skylar Automation respond to a critical service degradation by automatically creating a ServiceNow incident, paging the on-call engineer in PagerDuty, notifying the Microsoft Teams operations channel, and keeping updates synchronized across platforms. With Skylar Automation, teams can.

When to Use Grafana Assistant vs. MCP vs. gcx: Part 3

When should you use gcx? If Grafana Assistant is the brain and Grafana MCP is the easy hand, gcx is the power hand. Built for AI agents working in the terminal, gcx gives them deep access across Grafana Cloud—so they can pull telemetry, verify code, automate workflows, and access places MCP doesn’t. Coding agents? gcx. Need the full Grafana Cloud surface? gcx. Automating in CI/CD? gcx. Here’s where it fits, and when to use it — explained by Nicole van der Hoeven.

Internet Performance Monitoring: From Visibility to Control with LogicMonitor

Internet performance monitoring (IPM) gives IT leaders, operations teams, and network engineers visibility into the ISPs, carriers, and SaaS services their business depends on but doesn't control. In this LogicMonitor and Catchpoint webinar, Callum Brown (presales, EMEA, LogicMonitor) and Brandon Dunlap (solution engineering, Catchpoint, a LogicMonitor company) show how to operationalize IPM, moving from visibility to control.

MSP Observability: Proactive Monitoring to Autonomous IT with SCC Digital

SCC replaced fragmented tooling, including Nagios, with unified observability the whole team can use. The session covers proactive monitoring, SLA protection, and serving more customers without adding headcount per account. It's made for MSP leaders exploring AIOps for MSPs and observability for MSPs.

GitHub outage on August 17, 2026: seven hours of Unicorn errors and Copilot failures

GitHub was hit by a major global outage on August 17, 2026 that began with its infamous “Unicorn” error page and ended with a long tail of Copilot failures, lasting about seven and a half hours in total. StatusGator sent an Early Warning Signal at 13:35 UTC, five minutes before GitHub confirmed the incident on its status page at 13:40 UTC. User reports kept flowing until 20:12 UTC, well after the main site had recovered, because Copilot stayed broken for hours.
Sponsored Post

Connecting Ticketing Systems to Microsoft SCOM

As enterprises continue to modernize their IT operations, integrating Microsoft System Center Operations Manager (SCOM) with ticketing and IT service management (ITSM) platforms has become essential for reducing alert noise, improving incident response, and streamlining operations. This whitepaper provides a comprehensive overview of available integration options, categorized by complexity and supported features. It also highlights common challenges, best practices, and strategic recommendations for selecting and maintaining an effective integration architecture.

How to add Software Catalog metadata at scale with Terraform | Datadog Tips & Tricks

Adding metadata to Software Catalog entities manually is a tedious process that doesn’t scale as your service count grows. This video shows you how to automate that work with Terraform so you can add shared metadata across existing Software Catalog entities at scale.

MCP Won't Replace Your Monitoring Tool

MCP is generating a lot of hype nowadays (but then again, almost anything that emerges in AI seems to attract hype). The anticipation around it is similar to the level of excitement that would break out if Apple were to finally introduce USB-C to iPhones. To be fair, though, some of that hype is warranted, considering the fact that MCP provides a standardized approach to connecting agents with third-party tools, which significantly simplifies this type of integration (hence the USB-C analogy).

Teneo Managed DEX: How to Resolve Microsoft Teams Issues Faster

See how Teneo Managed DEX helps IT teams identify and resolve Microsoft Teams issues faster, often before they become another service desk ticket. In this Managed DEX example, Teneo shows how Digital Employee Experience (DEX) monitoring and automated remediation can help detect a Microsoft Teams problem, take action and get the employee back to work faster. Teneo Managed DEX helps organizations.

CAASM in Action: Continuous Cyber Asset Management with Teneo & ThreatAware

See how Teneo’s CAASM solution, powered by ThreatAware, helps security teams continuously manage and monitor their cyber asset landscape. In this short demo, discover how ThreatAware makes it easier to create focused asset views, identify areas that need attention, and schedule reports to keep teams informed, helping turn cyber asset visibility into ongoing action. Teneo and ThreatAware bring your security data together to help you uncover gaps, improve cyber hygiene, and reduce risk across your attack surface.

AI Norms & Values, Part 1 of 3: How We Do Business at Honeycomb

It's been almost exactly one year since we issued our AI mandate here at Honeycomb, and we've been doing some reflection. When we issued our mandate, it's not like we hadn't been using AI. We were the first in the industry to bake a feature powered by AI into our product, way back in May of 2024. Many of us had been experimenting and using these tools in our spare time. But we believe that software is the killer app for AI.

Autonomous IT and the Five Forces Reshaping IT in 2026

Autonomous IT is the focus of this LogicMonitor fireside chat with CMO Brooke Cunningham and CPO Garth Fort, built for enterprise IT leaders, IT operations, and observability and AIOps teams. Brooke and Garth break down the 2026 Observability and AI Outlook for IT Leaders report, based on a survey of 100+ VP-level IT leaders who own observability budgets across North America, EMEA, and Asia Pacific.

Location Management in Skylar One

Location Management in Skylar One gives IT teams a centralized way to create, maintain, and organize location data, building the foundation for trusted geographic visibility across distributed environments. In this walkthrough, Brian Harding, Director of Product Management at ScienceLogic, demonstrates how to create and manage locations in Skylar One. See how teams can define locations, associate them with the right organizations, and use accurate latitude and longitude data to establish the geographic context needed for devices, services, and Geographic Maps.

Geographic Maps in Skylar One

Geographic Maps in Skylar One give IT teams a faster, more intuitive way to understand infrastructure and service health across distributed environments. In this walkthrough, Brian Harding, Director of Product Management at ScienceLogic, demonstrates how to create and configure a Geographic Map in Skylar One. See how to create locations, align devices and services, use filters to control what appears on a map, and visualize infrastructure health based on real-world locations.

Grafana 13.2 release: easier ways to query and explore your data

Grafana 13.2 is here, bringing more improvements to help you and your team explore your data and get to insights faster. Download Grafana 13.2 In this post, we’ll highlight the latest updates to saved queries, a feature that lets teams share, discover, and reuse queries to get to trusted answers faster and help new teammates get up to speed. We’ll also explore how the new View panel sidebar makes exploring busy panels a breeze.

Why AI Agent Architecture Needs a Runtime Context Layer

Every AI agent architecture diagram shows the same five layers: perception, memory, reasoning, action, and feedback. Each layer assumes the one before it worked correctly, and none of them can confirm that once the agent runs against live production data. Runtime context is the sixth layer most designs leave out, and it’s the one that decides whether any of the other five can be trusted.

Why AURA Scratchpad Is Rad: Bound the AI SRE Agent Context Window

A big tool result does not have to be a big context cost. AURA moves it to disk and hands the model a pointer plus the tools to navigate what is there. A large MCP tool result can consume or overflow an agent's context window, and on a third-party server you do not control how much comes back. Scratchpad breaks the link between how big a tool result is and how much context it costs: the full output goes to disk, and only the slice the model asks for ever enters the window. Errors always pass through inline, so the model can react to them.

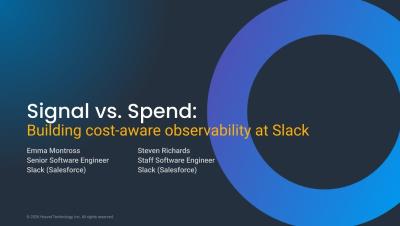
Signal vs. Spend: Building Cost-Aware Observability at Slack - O11yCon 2026

It started with a single log line taking up a massive amount of volume: 500 million emissions per hour. Pulling that thread led Emma and Steven into Slack's broader logging pipeline: 311 billion logs per day at 4.4M/sec peak, with no volume limits, no per-service attribution, and no feedback to the teams generating the noise.

GitHub Copilot Monitoring & Observability with OpenTelemetry

Learn how to implement end to end monitoring and observability for GitHub Copilot Chat using OpenTelemetry and SigNoz. In this video, we walk through enabling the OpenTelemetry exporter built into the Copilot Chat extension in VS Code, collecting a trace for every agent turn, and visualizing everything in SigNoz to gain real time visibility into model calls, tool executions, token usage, prompt cache savings, latency, and failures. Copilot Chat ships its own OTLP exporter, so there is no instrumentation library to install and no collector to run.

7 lessons for IT leaders on using observability to monitor AI applications

What it takes to prove AI value with LLM observability Over six months, the Elastic IT team ran internal AI applications that returned $2.5 million in operational time to the business.1 A conversational support assistant moved us from zero digital resolution, where anything complex became a ticket, to 30% of support interactions closing without one.

Knowledge Graph as context for LLMs: demonstrating decisive RCA and faster production performance

On the product team here at Grafana Labs, we consider AI agents our users, too. That’s why we set out to test how well agents can debug incidents across the full stack, and how much better they perform with Grafana Cloud’s Knowledge Graph vs. using raw telemetry alone. Our early results are promising. In one real incident we replayed 16 times each way, an agent with Knowledge Graph context found the correct root cause 15 times, compared with just once using raw telemetry alone.

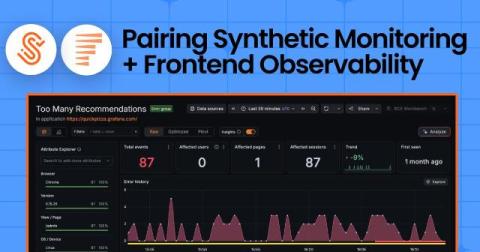
From failed check to real user impact: Pairing Synthetic Monitoring and Frontend Observability in Grafana Cloud

Say you get a support escalation about a page in the app that won’t load. But when you pull up your synthetic checks, they're all green: 100% uptime, probes are passing. Something's not adding up, but which one do you trust? If you’ve run Grafana Cloud Synthetic Monitoring, you’ve been on both sides of this. Sometimes it's the ticket: real users hit a wall on the path but your checks pass cleanly. Other times, it’s the inverse.

Meet the official UptimeRobot CLI.

Managing monitors has meant one of two things: the dashboard, or writing your own API calls. There is now a third. The official UptimeRobot CLI is live on npm, and it drives every monitor, incident, and status page in your account from the shell you already have open. It is free, open source under Apache 2.0, and works on every plan including the free one.

A Guide to Downsampling Time Series Data with InfluxDB 3

Summary Downsampling turns high-frequency time series data into lower-resolution summaries. In InfluxDB 3, you can calculate those summaries by querying with SQL or materialize them on a schedule with the Python Processing Engine. Table of Contents This tutorial demonstrates both approaches using the InfluxDB 3 Processing Engine’s built-in bird tracking simulator plugin. You will generate telemetry, aggregate it into 10-second windows, and validate the result with SQL.

Grok Build Observability with OpenTelemetry

Learn how to implement end to end observability and monitoring for Grok Build, xAI's terminal coding agent, using OpenTelemetry and SigNoz. In this video, we walk through turning on Grok Build's native OpenTelemetry exporter, collecting metrics and structured session events, and visualizing everything in SigNoz to gain real time visibility into token usage, sessions and turns, tool calls and their outcomes, error categories, and startup latency. Grok Build ships its own exporter, so instrumenting it is a matter of configuration, with no library to install and no collector to run.

Multi-Agent Orchestration for SRE: AURA Runs a Model per Specialist

Give one agent every tool and every incident is a question of trust. This one hands each job to a worker that can only reach what that job needs. One AURA configuration defines a coordinator and three specialist workers. Qdrant stores the runbooks, Prometheus measures workload health, and Kubernetes provides inspection and remediation, and each of the three is wired to one worker.

When to Use Grafana Assistant vs. MCP vs. GCX: Part 2

When should you reach for Grafana MCP? It’s one of the two “hands” in Grafana’s AI toolkit — and the easy one at that. MCP lets you bring Grafana into the tools you already use, like ChatGPT, Claude, or Cursor, without changing your workflow. No terminal? MCP. Want to stick with your favorite AI tool? MCP. Want easy tool discovery out of the box? MCP. Here’s where it fits, and when to use it — explained by Nicole van der Hoeven.

Reactive vs. Proactive Pest Management: Which Approach Reduces Operational Overhead and Costs

Operations and IT leaders who read this site spend their days thinking about uptime, monitoring dashboards, and the cost of unplanned downtime. Pest management rarely shows up on that radar, yet the underlying logic is identical: a system left unmonitored eventually fails at the worst possible moment, and the cleanup always costs more than the prevention would have.

From retrieval to agents: 5 takeaways on production architecture for AI agents

How context engineering creates production-ready agentic AI What if the AI strategy you spent the past year building is already being measured by a completely different set of rules? I recently joined Amy Machado, senior research manager at IDC and Jim Malone, senior contributing editor at CIO Marketing Services, for a webinar where we explored how buyer expectations, architectural requirements, and evaluation criteria are shifting as enterprises move from search-driven experiences to agentic AI.

Starlette Is Adding Native OpenTelemetry Tracing. Here's What That Means for Your APM.

If you run Starlette or FastAPI in production with an APM tool, you should keep an eye on PR. It adds native OpenTelemetry HTTP server spans directly into the framework. No external instrumentor, no monkeypatching. Just spans emitted from the router itself. At Scout Monitoring, we instrument Starlette and FastAPI through our Python agent. A change like this touches how every APM tool in the Python ecosystem works with these frameworks, ours included.

How to Monitor Docker Containers You Cannot Rebuild or Redeploy

How long would it take you to get one new line of code into the container running your payment service? In a lot of organizations, the answer runs to weeks, because the change has to clear a build owner, a test cycle, and a release window that nobody wants to open early. That timeline is why so much monitoring advice fails on contact. Most of it opens by telling you to add a library, rebuild the image, and push a new version. If you could do that this afternoon, you would have done it already.

How we teach LLMs to write BadgerQL

We just added two new AI features to our app: natural-language translation for Error search and Insights queries. Honeybadger has two query languages: Error search speaks a simple token syntax in the spirit of Solr or a basic Elasticsearch query, while Insights runs on BadgerQL (BQL), our own language for digging into your event data, designed to feel familiar to CloudWatch Insights and Splunk users. Both are powerful, but sometimes you just want something that works without having to open up the docs.

Making Machine Data Easier to Onboard, Prepare and Trust with AI-Powered Data Management

Every investigation, detection, dashboard, and AI-assisted workflow depends on one thing: data that teams can trust. But as environments grow more distributed, the data behind those experiences gets harder to manage. New applications, cloud services, security tools, infrastructure, and network devices constantly generate machine data, and each new source can introduce new formats, missing fields, inconsistent mappings, and pipeline changes that require expert attention.

Olly says Hi: Scheduled tasks now report to Slack and email

An agent that only speaks when spoken to is a tool you have to remember to use. Olly has run on a schedule for a while now, working a saved prompt hourly, daily, weekly, or monthly and writing its findings into a chat with its own run history. Those scheduled tasks are now wired into the Coralogix Notification Center, so Olly delivers that output itself, allowing Olly to reach out to Slack or email, out of the box.

Why You Shouldn't Vibe Code Your Monitoring Tool

Vibe coding made building software feel almost too accessible. You describe what you want, an AI assistant scaffolds it, and a few hours later, something is running. So, it was only a matter of time before developers started asking the obvious question: why should I pay for a monitoring tool when I can just build my own? In all fairness, the DIY instinct is a healthy one. But monitoring is one of the last corners you’d want to cut.

Two ways to measure the cumulative impact of experiments

Mature experimentation programs eventually have to report the cumulative impact of their shipped changes. The request might come as an ROI story for leadership, a revenue update for finance, or a gut check on the quarter’s progress. The tempting shortcut is to sum the observed lift from each winning experiment and report the total. That naive sum almost always overstates the truth because of a statistical artifact called the winner’s curse.

Centralize human and agentic work with Datadog Work Management

Teams often track operational work across spreadsheets, Slack threads, Jira tickets, and whatever system generated the original alert or signal. This fragmentation makes it difficult to maintain a consistent record of what needs attention, who or what is addressing the issue, and what has already happened. As AI agents take on more responsibility for investigations, triage, and code changes, the number of handoffs grows, making ownership, status, and history even harder to preserve.

Full-Pipeline Blueprints Are Here: Source, Processors, and Destination in One Click

Blueprints launched as processor bundles, and that solved the repetitive middle of the problem. But the middle was never the whole job. You still had to know which source type to add, which parameters mattered, how to batch for your backend, and how to route it all together. That changes now. The first two cover the two requests we hear most.

How eBPF Observability Monitors Docker Containers Without a Rebuild

How many containers are running in your production environment right now that nobody can see inside? A vendored service, a compiled binary, an application whose build pipeline left with the developer who wrote it: each one runs, serves traffic, and reports nothing. Instrumenting those workloads means a code change, a rebuild, and a redeploy, and on these containers none of the three are available.

Splunk Pricing in 2026: Full Cost Breakdown (and How to Cut It)

Splunk charges you in one of two ways: by how much data you send it each day, or by how much compute your searches and dashboards use. Security teams pay for both the platform and Splunk Enterprise Security, the app that turns Splunk into a SIEM, which is priced separately on top. This guide breaks down every part of a 2026 Splunk bill, works through a real, sourced pricing example, and lays out the ways to bring the number down, including the one lever many teams overlook.

SEO isn't just a marketing KPI anymore. It's a security one.

On this episode of Masters of Data, we sat down with Patrick Kobly, who runs security for a boutique MSSP serving fintech, crypto, and gaming clients, to dig into how phishing has evolved past the obvious tells. Kobly walks through how attackers spin up reverse proxies behind Cloudflare, route through residential IPs to dodge reputation-based blocking, and can take a fake domain from registration to full attack in under five hours. The conversation turns into an unexpected case for treating SEO as a security discipline, since search rank and AI-generated results are now part of the attack surface too.

Trace AWS Lambda durable functions with Datadog

AWS Lambda durable functions let you build long-running, multi-step workflows for use cases such as payment processing, order fulfillment, and AI workflows with human approval. A single durable execution can pause for a wait or callback, retry failed work, and resume in a fresh Lambda invocation without losing its state. The strong resilience provided by durable executions, however, creates an observability challenge because each invocation produces its own telemetry data.

Network Monitoring for 1,000+ Devices at Scale

A network monitoring platform can handle more than 1,000 devices, but the device total is only the starting point. A workable design must keep polling cycles on time, preserve visibility during failures, control notification volume, support the devices you own, and recover cleanly when the monitoring system itself has a problem. Crossing 1,000 monitored devices changes the job.

Getting started with Microsoft Purview dashboards

Microsoft Purview is an enterprise-scale platform for managing data governance across your whole cloud estate. It is not just about ensuring the integrity of data stored in SQL databases — it spans the whole spectrum of data storage including blob storage, document databases, email and AI frameworks. It has an extensive list of features for organising and monitoring your enterprise data. This includes.

From alert to answer: a hands-on investigation with trace analysis in Mezmo

Authored by Sven Delmas, VP of Research at Mezmo I wanted to know what Mezmo's new trace features feel like with real telemetry behind them, so I built the smallest honest rig I could: the OpenTelemetry demo application running in a local Kubernetes-in-Docker cluster on my machine, one collector, and one deliberately simple Mezmo pipeline.

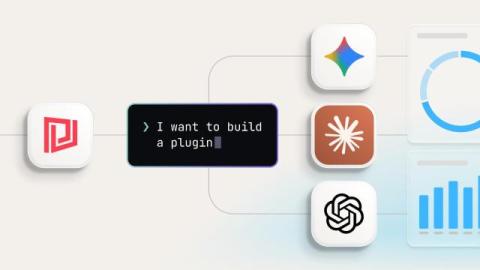
Introducing the AI toolkit - build a SquaredUp plugin from a single prompt

When we introduced the Low Code Plugin (LCP) framework in February, the premise was simple: if a system has an API, you should be able to build a plugin for it — quickly, with minimal code, and in a way you can share with the community. The "AI-ready" part was deliberate. The framework was designed to work naturally with AI assistants, so the path from idea to working integration would be as short as possible. That design decision is now paying off.

7 Data Integrity Practices Vlaximux Limited Recommends for Platforms Managing High Message Volumes

The assumption that integrity problems are primarily a storage or architecture problem is one of the most expensive misconceptions in platform operations. Vlaximux Limited addresses this directly. Storage and architecture matter - but the majority of integrity failures at high message volumes are operational failures: inconsistent write patterns, missing validation logic, race conditions that only surface under load, and monitoring gaps that allow silent data corruption to compound over weeks before it is detected.

Best Azure monitoring tools: Compare the leading solutions

Microsoft Azure has become one of the most widely adopted cloud platforms for running business applications, databases, containers, analytics workloads, and enterprise services. Modern Azure environments now extend far beyond virtual machines, encompassing services such as Azure Kubernetes Service (AKS), Azure SQL Database, Azure Functions, storage accounts, networking services, and serverless applications.

Incident IQ outage announcements are now dismissible

We’ve made a small improvement to our Incident IQ integration: users can now dismiss the outage announcement bar. When the outage announcement bar is enabled, Incident IQ can automatically display an alert at the top of your portal whenever a monitored service experiences an outage. With this update, you can add a close button so users can dismiss the announcement once they’ve seen it.

Proofpoint outage on August 14, 2026: DNS failure disrupts email worldwide

A DNS failure at Proofpoint broke email delivery for organizations around the world on August 14, 2026. Records for pphosted.com stopped resolving, so inbound and outbound mail routed through Proofpoint bounced or stalled for nearly four hours. StatusGator flagged the incident with an Early Warning Signal at 12:48 UTC, about an hour before Proofpoint acknowledged it publicly on its status page at 13:50 UTC. Here is what happened, who it hit, and how some teams kept mail moving.

What's New in Digital Experience Monitoring with Grafana Cloud

Grafana Digital Experience Monitoring (DEM) brings Frontend Observability and Synthetic Monitoring together, so teams can go from symptom to root cause without bouncing between tools. In this video, Bukola, Senior Developer Advocate at Grafana Labs, demos two of the newest DEM features. Session Replay and the integration between Synthetic Monitoring and Frontend Observability.

Visual playback of the user journey: Introducing Session Replay in Grafana Cloud Frontend Observability

Grafana Cloud Frontend Observability helps engineering teams quantify the end user experience by bringing metrics, logs, traces, and user session context to client-side web applications. Teams can monitor application health and performance over time, triage errors, and correlate frontend signals with backend telemetry to investigate issues across the stack.

How a Citrix Monitoring Tool Helps Optimize Virtual Desktop Performance

A trader waits 50 seconds for a Citrix session to load while the market moves. A clinician steps away from a patient because the virtual desktop froze mid-record. A call-center agent watches keystrokes lag every customer question. None of these people file a detailed bug report. They contact the helpdesk, reporting that “Citrix is slow,” and lose minutes of productive time, multiplied across thousands of users every day.

Site24x7 APM business transactions explained

Learn how to set up and monitor Business Transactions using Site24x7's APM Insight in this step-by-step tutorial. We walk through configuring APM Business Transaction Rules, defining transaction criteria (like HTTP method and URL patterns), and analyzing key performance metrics such as response time, throughput, Apdex score, request count, and exception rate. Whether you're troubleshooting slow application performance or setting up proactive monitoring for your business-critical transactions, this video shows you exactly how to get actionable insights from your APM dashboard.

Top Kubernetes Monitoring Tools Compared: Which Solution is Best for Enterprise Environments?

Modern enterprises rely heavily on Kubernetes to orchestrate containerized applications at scale. However, as Kubernetes environments grow in complexity, maintaining visibility into application performance, cluster health, and infrastructure dependencies becomes increasingly challenging. Choosing the right Kubernetes monitoring tools is essential for ensuring application availability, optimizing resources, and delivering consistent user experiences.

Introducing Obkio's Severity Summary Widget: See Network Events at a Glance

Obkio’s new Severity Summary widget is built to answer one question fast: “How healthy was my network overall, across every session I'm tracking?” Instead of opening session after session to check each one individually, you get a single combined view showing how much time your network spent in each severity level.

Microlesson: Using Mobot for Log Analysis

This video demonstrates how to use Mobot to investigate issues, interpret its findings, and identify recommended next steps. Follow along as Mobot responds to a prompt by understanding your intent, gathering relevant data, performing multi-step analysis, reasoning across data sources, surfacing insights, and recommending next steps.

Run an AI SRE Agent Entirely Inside AWS with Bedrock and S3: AURA

An on-call question returns the threshold and the escalation owner from your own runbooks, and the answer comes back without a call to anyone outside. AURA runs against Bedrock as its model provider, using Claude Sonnet 5 served by AWS in the same region. Authentication is the normal AWS credential chain: a profile on a laptop, an IAM role in EKS.

Debug AI agents wherever they run, from Slack bots to code review with Sentry's Agent Tracing

Agent Tracing shows the full execution path of an AI agent: the model call, every tool invocation and its arguments, token counts, cost, and the span where it broke. Same traces and spans you already use, with agent-specific attributes on top. Serge walks through three apps — a Next.js e-commerce agent using the AI SDK with a failing tool call, a Slack bot built with Eve that orders lunch, and a code review agent built with Flue over MCP.

A Practical Guide to Core Web Vitals Optimization for Better UX and Faster Conversions

When a page starts losing customers, how long does it take to find out which one? The evidence lives in your visitors' browsers, and standard infrastructure tooling measures servers instead. A speed test run from an office machine answers a different question entirely. Pages that clear every internal check can still turn away a quarter of the people who reach them.

10 Best Session Replay Software & Tools for 2026

Some frontend bugs never get fixed because nobody can prove they happened. The user cannot describe what they clicked, and the error log shows nothing. The best session replay software closes that gap by rebuilding the visit itself. If you want the mechanics first, our guide to what session replay is covers how the recording is built and played back. Choosing between the tools is the harder part, because three very different kinds of product now sell the same feature.

Workspace now reads your tickets and automates the fix

IT teams don’t need another place to look for problems. They need a faster way to understand what is happening, decide what to do next, and act before disruption spreads. That has always been the promise of Workspace. It gives IT teams a conversational way to investigate issues, surface insights from Nexthink data, and understand what needs attention across the digital workplace. Now, Workspace is entering its next phase.

Escalation Protocol: Criteria, Levels and Path Template

An escalation protocol is the written rule set that says when an incident moves from the person holding it to the next level, who that next level is, how they get contacted and how long they have to respond. It sits underneath the escalation policy (the why) and above the contact matrix (the who), and it is the document the on-call engineer actually reads at 3 AM.

The August 13, 2026 Namecheap Outage

Namecheap took more than 5,000 servers offline on August 13, 2026 after cooling systems failed at RadiusDC's Phoenix datacenter, and brought services back in stages over roughly 28 and a half hours. The shutdown was deliberate, intended to protect hardware from overheating. It reached most of the product line - hosting, EasyWP, Private Email, DNS management, URL redirect management and the support helpdesk - while DNS zone resolution was unaffected.

ICMP Port Number: Why Ping Has No Port and What to Open

ICMP has no port number. It is an IP-layer protocol, number 1 in the IP header, that sits beside TCP and UDP rather than on top of them, so ping does not use a port and there is no "ping port" to open. When a firewall form asks for one, select the ICMP protocol and the echo request type instead. This post covers where ICMP sits in the stack, which types and codes you will actually meet, how to allow it through Linux, Windows and cloud firewalls, and when a ping check is the wrong check.

More control for Digital Signage integrations

We’ve made a small but useful update to our Digital Signage integrations in StatusGator. You can now configure Allowed IP addresses for your digital signage integrations. This lets you restrict access to specific public IP addresses – for example, the network used by screens in your office, operations center, or other shared space. Simply add one or more IP addresses when configuring the integration, and StatusGator will limit access accordingly.

Extending Cloud ALM for ERP Operational Success

SAP customers are navigating a period of significant change. Of course, there’s the transition to Cloud ERP and the scheduled end of standard support options for ECC in 2027 – these are well known. Basis professionals will be familiar with changes in support for Solution Manager and its components including monitoring and change management. Landscape Management has been formally discontinued after 2027. The natural assumption is Cloud ALM fills the gap.

Grafana Pyroscope: Call Tree, Heat Map, & Adaptive Profiles (August 2026 Community Call)

We will look at some new features: Call Tree, Heat Map, & Adaptive Profiles Can't comment in the chat? You may need to create a channel. Join us live for an introduction to flame graphs. We’ll cover what they are, how to read them, and how to use them to find performance bottlenecks in your applications. Bring your questions! Grafana Cloud is the easiest way to get started with Grafana dashboards, metrics, logs, traces, and profiles. Our forever-free tier includes access to 10k metrics, 50GB logs, 50GB traces and more.

Top 10 Digital Experience Monitoring Tools in 2026

Server dashboards can look healthy while users wait. Only 51% of the 1,000 most popular mobile sites pass Core Web Vitals, according to the HTTP Archive's 2025 Web Almanac. Closing that gap is the job of digital experience monitoring tools. Some watch customers on your website and mobile apps, others watch staff on laptops and virtual desktops, and a third watches the network in between. Pick the wrong type and you lose a review cycle.

Better context, smarter testing: How to give your AI coding agent direct access to k6 docs

As testing workflows become more AI-assisted, fast access to accurate documentation matters more than ever. Whether you're writing a new load test, troubleshooting an issue, or having an AI agent generate a script for you, you need reliable guidance that keeps pace with the way you work. But most documentation still lives in a browser. Every time you or your agent needs to verify an API or look up a best practice, you're forced to leave your terminal or editor and interrupt your workflow.

10 Best Real User Monitoring Tools Compared for 2026

Most IT teams learn their application feels slow when a customer complains. Server metrics never measure what a person on a phone waits for. The best real user monitoring tools close that gap by collecting timings from your users' browsers. Choosing one got harder this year, because the measurement standard moved. In this blog, we compare the best tools for real user monitoring, including their pros, cons, and key features. By the end you will know which one fits your stack.

Data pipeline monitoring 101: Tracking health and performance across the data stack

Data pipelines are systems for moving and processing data. They are made up of concatenated services and data stores that programmatically ingest data from upstream sources; filter, transform, enrich, and route that data; and deliver it to downstream consumers.

Builder in the loop: what production agents were missing before AURA

Builder in the loop is a Mezmo interview series with the engineers, product leaders, and operators shaping AURA. Each installment looks past the product layer to explore the decisions, tradeoffs, and lessons involved in building agents for real production work. This installment features Mike Shearer, the engineer who built AURA and, until recently, its only developer. AI agents are easy to believe in when the task is small.

What an AI SRE agent actually finds when you point it at a broken Kubernetes cluster

‍ Most of the AI features that shipped into observability tools this year summarize alerts. You get a paragraph that restates the dashboard you were already looking at, and the agent never reads the cluster itself, because giving it cluster access is a security conversation nobody wanted to start. This walkthrough starts it.

What is going wrong with AI coding? Live Laugh Logs ep. 4

Welcome to Episode 4 of Live Laugh Logs, the podcast from the Coralogix Developer Relations team. This week, Chris Cooney joins Annie to share five key DevOps skills that have become even more important in the age of agentic code development, and gives you five key actions you can do today to start levelling up these skills. Subscribe to our channel for more insights into observability and AI.

How KPIs lose their meaning and what to do about it

Once you've published more than a handful of KPIs, you eventually need a way to summarize them. A total cost. An overall health status. An organization-wide SLA. Something that lets you answer the big questions without opening ten different dashboards. Summarizing those into a handful of KPIs usually feels straightforward. You add things together, average them, or collapse several statuses into one. The dashboard becomes easier to read, and nothing looks obviously wrong.

SigNoz Cloud Dashboard Schema Is Now Built for AI Agents

A quick walkthrough of SigNoz Cloud's new dashboard schema, redesigned to make dashboard operations by AI agents faster, more reliable, and lighter on tokens. AI agents are increasingly creating and editing observability dashboards. We redesigned the SigNoz Cloud dashboard data model with a structured, strictly validated schema so agents can work against defined fields and paths instead of inferring the dashboard structure.

The Three Pillars of Observability: Traces, and Two Things My Agents Never Look At - O11yCon 2026

'The runbook lost. The trace is the documentation now.' In his O11yCon 2026 closing keynote, Corey Quinn of Duckbill Group makes the case that when your primary reader is an, not a person, are the only pillar built to survive.

Message Broker Compliance: HIPAA Security Rule, PCI-DSS & SOC 2 for Apache ActiveMQ

A healthcare technology company routes patient appointment notifications through ActiveMQ. A payment processing firm uses ActiveMQ to bridge its order management system to its payment gateway. A SaaS provider includes ActiveMQ in the architecture scope for its annual SOC 2 Type II audit.

Why Your Internet Is Slow: Is It Your Network, ISP, or Your Machine?

Someone on your team says "the Internet is slow." Twenty minutes later, IT finds out the Internet was never the problem. Maybe it was a laptop with a full RAM disk. Maybe it was an ISP outage two towns over that had nothing to do with your office. Misdiagnosing slow Internet wastes time. It sends you down the wrong fix path, like rebooting a router when the real issue is sitting on someone's desktop.

We Redesigned the SigNoz Trace View for Million-Span Traces

A quick walkthrough of SigNoz Cloud's new trace detail view, with a flame graph that renders 100,000 spans in a single load. AI and agent workloads are producing traces with much higher span counts. We rebuilt the trace detail view in SigNoz Cloud to make investigating large traces faster. Here's what's new.

How I Support Humans in the AI Era

When our company pushed everyone to start using AI tools, I thought about what it would mean for my team. As a remote company, we are already challenged by the lack of organic human connection. Every connection is planned and takes effort, and now, AI adds another layer. People now spend part of their day collaborating with a tool rather than with a person, which can take away from the time we spend learning from each other.

Data Center: More or Less | SolarWinds TechPod

In this episode, Sean and Crystal explore the complex and rapidly evolving landscape of AI, data center impacts, regulation challenges, and societal implications. They discuss the urgency of establishing standards and the lessons from historical industrial revolutions to navigate AI's future responsibly.

No Custom Adapter: AI SRE Agent AURA Debugs Product Catalog in Dash0

The platform shows you which service is failing and which paths it touches, and stops there. Point AURA at the same telemetry and the cause comes back too. Dash0 shows the product catalog service in a failed state across the selected window, with errors on the path from the frontend service.

Kubernetes AI SRE Agent Finds a Crash Loop Nobody Asked About: AURA

You ask for a routine health check and expect a clean baseline. What came back was a pod that had restarted 788 times, unrelated to the question. AURA is connected to a Kubernetes cluster and to Prometheus through read-only MCP servers, running as one coordinator with two specialized workers. The prompt is one sentence: check the health of the cluster, and confirm whether all the pods are running. What comes back is not a baseline. AURA names the state as CrashLoopBackOff and attaches the restart count to it.

Cavalry or cattle? Let the machine decide

Long before dashboards and decibel-loud alerts, there were watchtowers. Every kingdom worth its salt had them, men perched on hills, lighting fires to signal the moment they spotted something suspicious on the horizon. It was, in its time, a fine system. The trouble was that watchmen, being human, occasionally mistook a herd of cattle for an invading army, or a dust storm for smoke, and lit their fires anyway.

Top tips: Small digital habits that save you hours every week

Top tips is a weekly column where we highlight what's trending in the tech world and list practical ways to explore these trends. This week, we're looking at something we rarely think about until the end of the day: the tiny digital habits that quietly eat away at our time. Have you finished a workday feeling busy but strangely unaccomplished? You started with the best intentions.

A Rust Client for InfluxDB 3

Summary A new async Rust client for InfluxDB. Built for the edge gateways, embedded systems, and high-throughput ingest pipelines where Rust already runs. Table of Contents Time series data shows up wherever the physical world meets software. A satellite constellation streams altitude, power, and thermal telemetry from every spacecraft on every pass. A factory floor running on Industry 4.0 principles instruments every line, every motor, every batch.

Agent Mode Engaged! Enchaining Agentic Operations with Splunk AI Assistant 2.0

In this session, we will introduce your new "digital teammate"—the supercharged Splunk AI Assistant. We’ll demonstrate how the new Agent Mode provides the context, reasoning, and recommendations necessary to reduce your mean time to resolution (MTTR) from hours to minutes.

CCPA Compliance for IT Teams: How to Handle Data Subject Requests on Time

How many privacy requests is your organization working on right now, and how many of them are still inside their legal deadline? The answer usually lives in several places at once. Shared mailboxes hold some, web forms hold others, and legal keeps a tracker of its own. That scattering is the problem. A CCPA request carries a hard statutory deadline and a documentation duty behind it, yet privacy work is the one regulated workload in most organizations that never entered the service management system.

What Is Session Replay? How It Works, What It Records, and When It's Legal

A customer reports that checkout failed twice before they gave up, then stops replying to the support thread. What do you actually have to work with? A timestamp, a browser string, and a description written by someone who was not looking at the console. Session replay answers the question that ticket cannot. It rebuilds that single visit in the browser and plays it back step by step, so the click that failed, the field that rejected input, and the script error that fired alongside it appear in sequence.

Redirection Fraud

You may be familiar with web card skimming, where a fraudster replaces the payment iframe on an ecommerce site with a fake version designed to intercept payment details or divert a transaction. However, there’s another variation that, while not new, is something we encounter far less often. It was highlighted this week during a call from an ecommerce vendor: redirection fraud. In this scenario, the attack starts much earlier in the customer journey.

How to Investigate a Production Incident Using an AI Agent (AppSignal MCP)

An incident has hit your product. I've been there: you're context-switching between hosting, CI/CD, codebase, AppSignal for monitoring, and whatever else your product depends on to minimize downtime and potential losses. You're trying to piece everything together, but it takes a lot of time, and that's something you don't have. AI agents connected to your tooling and your monitoring data via MCP free up that time for you.

Introducing Coralogix Product Analytics

Coralogix Real User Monitoring has spent years collecting full-fidelity user sessions: every session and event processed in stream, without sampling and without prior indexing, at rest in cloud object storage you own. Today that data does a second job. Product Analytics brings heatmaps, funnels, and pathways to the RUM sessions you already send, with no second SDK to install. One dataset now answers what your users did and why it happened.

A comprehensive guide to Fly.io logging

Deployment is not the end of shipping your application. From time to time, you will get errors that you will need to attend to. Without a good method of catching errors or logs in general, you could end up with uncaught issues that might cost you valuable customers in the process. In this article, you will learn how to catch logs for an application deployed on Fly.io. You will learn how Fly.io logging works, then learn ways to handle logs natively on the platform.

AI Incident Response: Edwin AI in Slack Finds Root Cause Fast

AI incident response just got faster. Watch how LogicMonitor Edwin AI brings investigation, root cause analysis, and action directly into Slack for ITOps, SRE, DevOps, NOC, and incident response teams. When an incident hits, responders juggle monitoring tools, ITSM systems, dashboards, and documentation to find what they need. Edwin AI brings that context into Slack, so your team can investigate, decide, and act in one place.

Boost Productivity with SPL2: The Next-Gen Language for Splunk

Tech Talk features a live demonstration of the new SPL2 Search Mode and explores how to leverage SPL2 modules and apps to streamline your investigations. Whether you are building custom solutions or investigating security threats, learn how to turbocharge your use cases with a flexible language that supercharges our original SPL.

Grafana Tempo: Trace diff & span pruning (August 2026 Community Call)

We will look at some new features: trace diff and span pruning Can't comment in the chat? You may need to create a channel. Join us live for an introduction to flame graphs. We’ll cover what they are, how to read them, and how to use them to find performance bottlenecks in your applications. Bring your questions! Grafana Cloud is the easiest way to get started with Grafana dashboards, metrics, logs, traces, and profiles. Our forever-free tier includes access to 10k metrics, 50GB logs, 50GB traces and more.

From Log Line to Merged Fix: AI SRE Agent AURA with GitHub MCP

Knowing why it broke is not the same as having it repaired. Point the agent at the repos behind the service and the change comes back as a pull request. A Govee integration crash-loops under Home Assistant because the container cannot write to a directory it does not own. That much was already established: the previous homelab video stopped at the root cause on purpose, so the next pass could improve the agent's configuration first.

Migrating from Nagios XI to WhatsUp Gold: A Practical Step-by-Step Guide

Monitoring platforms rarely become complex overnight. In many Nagios XI environments, complexity builds gradually through years of useful customizations, custom plugins, one-off fixes, and undocumented operational knowledge. Each addition may have solved a real problem at the time, but over the years the result can become difficult to maintain, explain, and hand over to new administrators.

Stop Guessing Where the Network Broke

Modern IT teams invest heavily in monitoring infrastructure, applications, servers, and network devices. Yet when users report that a critical cloud service is slow or a branch office loses connectivity, one question often remains difficult to answer: where is the problem actually occurring? Is the issue inside your network? Is it your ISP? Has a routing change introduced excessive latency? Did an upstream provider experience an outage?

OpenTelemetry at the edge: Observability for IoT fleets with Bindplane and Dynatrace

By the time an IoT device shows up in an incident review, it has usually already done its damage. Not the dashboard-gap kind. These devices are load bearing. They sit in the control path of substations, haul trucks, pump stations and cold rooms, so when they go blind the blast radius gets measured in tripped relays, spoiled stock, and unplanned outages rather than in missing datapoints.

Automated agent triage with Agent Tracing and Claude Routines

Every morning, before anyone on the team has looked at a dashboard, a Claude Routine has already read around 800 of the previous night’s conversations from Seer, Sentry’s AI agent for triaging and fixing errors. It flags the ones that look broken, and files tickets for anything new. By the time we sit down with coffee, the triage is mostly done.

How volumetric sampling makes the most of your trace budget in Grafana Cloud

Tracing is one of the richest observability signals, but it's also noisy and susceptible to data bloat. In a busy system, the vast majority of traces describe the same healthy, fast, successful request over and over, so most organizations downsample their traces to cut costs. But that approach has consequences, since the sampling strategy you choose determines whether you get a faithful picture of your whole system, or just a smaller, blurrier copy of your busiest endpoints.

Why a Thermal Camera Rated for Hundreds of Meters Might Alert You at Twenty

Most teams buy thermal on two numbers. Resolution and NETD go into the comparison spreadsheet, the lowest NETD wins, and the purchase order goes out. Then the camera gets installed and the alerts do not arrive when anyone expected. Nothing is faulty. The spec sheet was accurate and the deployment still disappointed, because the numbers on it were answering a different question from the one you were asking.

10,000+ services and counting: the biggest monitoring catalog anywhere

StatusGator now monitors more than 10,000 services. Cloud platforms, AI tools, payment providers, communication apps, developer infrastructure, school software, business SaaS: if your team depends on it, there is a good chance we are already checking its status page. We started in 2015 with a few hundred providers and one idea, that nobody should have to keep multiple vendor status pages bookmarked to find out why the office suddenly cannot log in.

The Most Important Improvements Are Often the Ones You Never See

When organizations evaluate software platforms, attention naturally gravitates toward visible outcomes. New capabilities, expanded functionality, improved user experiences, and innovative technologies often dominate conversations about platform value. These improvements are important because they directly influence how teams interact with technology and how organizations achieve business objectives.

August 2026 product update: hosted MCP and more

Your MCP client doesn’t need your whole API key just to look up an error anymore. Honeybadger's hosted MCP server now supports OAuth. You can approve it through your browser, scope your permissions, revoke your permissions, and rest easy knowing that our tokens auto-refresh and don’t sit around in a config. Keep reading to see how it works and get a quick recap of everything else that shipped this cycle.

Observability's Sixth Sense: Grounding Anomaly Detection in Reality

Summary: Machine learning-based anomaly detection improves observability by learning normal system behavior instead of relying only on static thresholds. This article explains how vmanomaly, its MCP server, purpose-built skills, and an LLM-powered UI copilot help engineers explore telemetry, investigate anomalies, build MetricsQL queries, select suitable models, apply business constraints, and validate configurations through natural language.

Monitors now support the HTTP QUERY method.

If your API answers on QUERY, you can now point a monitor straight at it. QUERY joins HEAD, GET, POST, PUT, PATCH, DELETE, and OPTIONS in the HTTP method list for HTTP, keyword, and API monitors. You can find it under the “Advanced settings” when editing or adding your monitor. QUERY became a standard in June 2026 as RFC 10008. It’s safe, idempotent, and it carries a request body.

Set a monthly budget on every Olly API Key

FinOps spent a decade making cloud spend predictable, and teams now point the same discipline at a workload that behaves nothing like a virtual machine. In the FinOps Foundation’s State of FinOps 2026 survey, drawn from 1,192 practitioners representing more than $83 billion in annual cloud spend, 98% now manage AI spend, up from 31% two years earlier. The main driver for this was agents.

Introducing the new Coralogix Metrics Engine

Coralogix has spent years building metrics infrastructure that handles high cardinality and high dimensionality without flinching, with governance, usage visibility, and cost optimization built into the platform, and recognized industry delivery to show for it. Today that infrastructure takes its biggest step yet. We have rebuilt the metrics engine from the ground up, with a new pricing model, a set of new capabilities, and a tripled fair usage allowance to enjoy them in.

Argo CD Deployment Failed: AI SRE Agent AURA Finds and Fixes It

A deployment fails validation and the sync stops. Argo CD hands the report to AURA, which finds the wrong version, fixes it, and re-runs the sync. Normally, a failed sync means a person opens the application, reads the hook logs, and works out which value is wrong. Here, the sync fail hook sends AURA a short failure report and an incident ID over the agent-to-agent protocol, then exits. It does not say how to investigate or what to change.

What Is GDPR Compliance? Requirements and How to Meet Them

Most teams can describe their GDPR obligations. Far fewer can produce the records that prove they met them. That gap is where GDPR compliance gets hard. The regulation reads as legal text, so it usually gets treated as legal work. About a third of it lands on the IT team instead: records of what you process, security controls that have to hold up, and deadlines measured in hours. Nobody asks for that evidence on a quiet week.

Cloud Incident Management: Process, Tools, and Practices

How do you resolve an outage your organization has no authority to fix? A managed database drops into read-only mode and stops accepting writes. There's no host to reach, no configuration file to edit, and no restart command available to your engineers. Cloud incident management begins at that boundary, where the response depends on a support channel and a provider status page. Plenty of what you already know still applies here.

Build and Launch AI Agents from Your Splunk Workflows

Introducing the Splunk Agent Launchpad! Let’s face it—your team is busy. Between managing alerts, digging through investigations, and constant context-switching, it’s hard to stay ahead of the noise. What if you could turn your existing operational knowledge into custom AI agents that do the heavy lifting for you? And the best part? No coding required. Watch this exclusive look at the Splunk Agent Launchpad. We’re showing you how to build, deploy, and manage AI agents that help you investigate, enrich, summarize, and act—all without leaving the Splunk environment you already know and trust.

Icinga Director: Targeted Health Checks and Sync Rule/Import Source Deletes from CLI

Icinga Director’s CLI commands have supported import sources and sync rules for a long time, which includes listing, checking and running them. Before Icinga Director v1.11.6 two things you couldn’t do from the CLI, though, were narrowing a health check down to a single object, or deleting an import source or sync rule without opening the web UI. I’ll walk through both, using examples.

How to build a resilient incident management workflow using ilert

Your payment API suddenly returns 503 errors. Within seconds, your infrastructure monitors, application checks, and dependency monitors begin generating their own alerts. And while the dashboards keep flashing, the clock is still running. Your customers are waiting, internal teams are asking for updates, and engineers are trying to separate the real problem from the noise before the situation gets worse.

Monitor outages with StatusGator MCP and Claude

When a service your organization depends on stops working, you need to know whether the problem is internal or caused by a third-party provider. Connecting StatusGator to Claude gives you a faster way to find out. You can ask Claude what is down, investigate provider incidents, review affected components, and analyze historical uptime using data from your StatusGator account.

Platform engineering is not just a developer trend, but a practice ITOps should be paying attention to

Riya has managed IT operations at a mid-sized FinTech company for six years. She knows the infrastructure inside out: Every server, monitoring alert, and compliance requirement is owned by her team. So when Riya heard the engineering lead mention their new internal developer platform in a quarterly review, she assumed her team would be looped in eventually. This did not happen. Three months later, Riya's team was called in to investigate an outage.

Investigate account-level churn risk with Product Analytics account segments

An account can show signs of disengagement long before a renewal conversation begins. Users may stop returning to a core workflow, stall during onboarding, or skip a newly released feature. Product teams often see these signals only at the user level, while annual recurring revenue (ARR), plan, renewal date, and ownership data remain in a customer relationship management (CRM) system or data warehouse.

Third-Party Patch Management: How Application Patching Works and Where It Breaks

Most patch programs are built around the operating system. The vendor calendar is predictable and the tooling is mature. That is the smaller half of the job. Most of the software on a typical endpoint comes from somewhere else. Third-party patch management covers that half, and most teams run it with far less structure. The gap is easy to miss in day-to-day reporting. Windows Update finishes on a laptop, and the machine reports as patched. That report covers the operating system and nothing else.

What is Port Mirroring and How does a SPAN Port Work?

Your dashboard shows every interface green, the counters look clean, and the application owner still insists the network is dropping their transactions. Where do you look next? Availability data tells you a link is up. It cannot tell you what crossed that link or how long the server took to answer. Only the packets carry that, and port mirroring is how most engineers get a copy without cutting into a live cable.

How to visualize workflows and business processes in Grafana: Introducing the Graphviz panel

Here's a scenario that will likely sound familiar: You’re building an executive overview dashboard that you would put on a wall-mounted screen so the whole room can see how the business is doing at a glance. It’s for a Shopify online store, and displays a mix of business and application signals, including latency panels, error-rate panels, and a big stat panel for revenue-per-week. It looked great. But something is missing.

Resolve Now Fixes Your Errors, Not Just Diagnoses Them

Your error monitoring tool found a bug. Now what? For most teams, the answer is the same thing it has been for years: copy the stack trace, find the file, read the code, build a mental model of what went wrong, write the fix, write or update a test, push, and wait for CI. That process hasn’t changed much since error tracking became a category. The tools got better at telling you something broke. They never got better at fixing it.

Open Source vs. Commercial Apache ActiveMQ Support

The finance team sees the "Apache License 2.0" on the ActiveMQ download page and concludes the software is free. The engineering team knows the broker requires configuration, monitoring, tuning, CVE patching, and incident response. All of those things cost engineering time, whether or not a license fee appears on the invoice.

What's new in Sentry Logs: The summer 2026 roundup

We got a little behind on updating our changeLOG, so we’re dumping it all into this bLOG post instead. Think of it as one giant, retroactive changelog entry or, if you want to be dramatic about it, one massive prompt injection straight into your feed. Either way: here’s everything that shipped for Sentry Logs this summer. Would you rather listen to the team talk about what they built? Check out this video where Kyle and Josh talk about the latest updates on Logs.

Your Render Migration Checklist: How to Verify Everything Is Working

Migrating your app to a new service can be scary. Render makes the deployment side easy, but a green deploy doesn’t mean everything is working. Silent failures are often the most dangerous kind. They go unnoticed until a customer calls to report a broken webhook or you realize the queue depth has been climbing since the cutover and nobody has caught it yet. The migrations that explode on deploy are not the ones you should fear. It’s those that look fine for three days.

Best SSL Certificate Monitoring Tools in 2026 [26 Analyzed]

The best SSL certificate monitoring tools are Hyperping (certificate checks inside a full uptime, on-call and status page workflow), TrackSSL (dedicated certificate inventory and change alerts), Xitoring (deepest published TLS analysis at the lowest price), UptimeRobot (largest free tier), Better Stack (certificate checks alongside logs, traces and incident response) and Oh Dear (whole-site health for agencies). I analyzed 26 tools and narrowed the list to these six.

AI SRE Agent Debugs a Lambda Timeout with the AWS MCP Server: AURA

A scheduled Lambda quietly stops completing and nothing pages you. AURA finds the function, reads its logs, and comes back with a three-second timeout. The usual path is opening the console, tracking down the right log group, and reading CloudWatch by hand. Here AURA connects to AWS through the MCP proxy AWS publishes, run locally with uvx against an AWS CLI that is already configured, so there are no new credentials to issue.

The Great Telemetry Debate: Why AI-Ready Operations Require a True Data Fabric

If you are leading technology strategy today, you face consequential choices about how to manage your enterprise telemetry. Your decisions determine not only where logs, metrics, traces, and events are stored, but also who controls how operational data is collected, shaped, governed, and put to work in an optimal way for the security, observability, analytics, and AI systems that power your business.

Solving bugs with elmah.io and Claude Code - a real-life example

I spend most of my day in Claude Code these days. Most of my development processes changed after having access to my own personal assistant. In this post, I'll show you a real-life example of how bug fixes are often done on elmah.io now. I hope it will inspire someone to optimize their workflow and get even more out of their elmah.io subscription.

What's new in VictoriaMetrics Anomaly Detection (Q2 2026)

Summary: The Q2 2026 development cycle moved VictoriaMetrics Anomaly Detection toward one simpler, continuously adapting workflow. The main addition is Temporal Envelope, an online model that handles trend, multiple calendar patterns, holidays, persistent changes, forecasts, and optional multivariate context without retaining the full fit history.

DevOps Cost of Ignoring Bad Bots on Your Infrastructure

A traffic spike used to mean good news. Now, it's just as likely to mean a scraper found your pricing page or a credential-stuffing script started hammering your login endpoint at 3 a.m. Most teams treat this as a security problem and hand it off accordingly. That's a mistake, because by the time it reaches security, it has already cost engineering time, compute budget, and a fair amount of sleep.

How to Reduce Data Costs with OpenTelemetry and Bindplane

Originally written by Paul Stefanski, updated by Dylan Myers. Data costs fill a large column in many organizations' accounting sheets. Data pipeline setup and management is a significant time sink for DevOps, IT, and SRE. Setting up telemetry pipelines to reduce unwanted data often takes even more time, which could better be spent creating value rather than reducing costs. This post will show you how to quickly set up your data pipeline to filter unnecessary telemetry data.

Instrument serverless apps with agentic onboarding

Serverless platforms like AWS Lambda, Google Cloud Run, and Azure Container Apps let teams run applications without managing infrastructure. However, getting full visibility into those workloads has traditionally required a lot of manual setup. A single team may deploy serverless applications across multiple clouds by using tools such as Terraform, AWS SAM, AWS CDK, and the Serverless Framework. Each of these platforms, runtimes, and deployment tools requires its own instrumentation steps.

AI Model Drift: How to Keep Models Reliable

AI model drift is when an AI system's performance and accuracy degrades over time because the data, user behavior, or business environment has changed since the model was trained or evaluated. Even if latency, uptime, and infrastructure metrics remain healthy, model quality can quietly decline, leading to less accurate predictions, inconsistent responses, and reduced user trust.

WiFi Monitoring 101: What It Is and Why Remote Teams Need It

For years, IT teams had a fairly contained job: keep the office network running. Every device, router, and switch that mattered was inside a building they controlled. That job doesn't exist anymore. Remote and hybrid work moved the "network" into hundreds of living rooms, home offices, and coffee shops, none of which IT can see, configure, or troubleshoot directly. So when a help desk ticket comes in saying "the app is slow" or "my calls keep dropping," IT is left guessing. Is it the company's network?

The Factory Floor's Digital Blind Spot: Hidden IT Risk in Manufacturing

Manufacturing organizations have spent years strengthening the systems, processes, and supply chains that keep production moving. Yet some of the disruption affecting operations begins in places that are much harder to see. A slow engineering workstation, inconsistent access to a production application, a login delay at shift change, or a device that needs repeated intervention may not look like a plant-wide outage, but each one can add friction to work that is already tightly sequenced.

What Is Cybersecurity Compliance? Frameworks and Requirements

Most IT teams are asked to meet more than one security framework at once. Almost nobody gets more budget or more people to do it. That is the real shape of cybersecurity compliance. A sales deal needs SOC 2, a hospital contract drags in HIPAA, and card payments put PCI DSS on top of both. Each one arrives with its own auditor, its own vocabulary, and a deadline somebody set without asking you. So the same controls get built three times over.

What is Network Intelligence? A Guide for IT Teams

"This is the third slowdown at the regional offices this quarter. What is actually causing it, and what will it cost us to stop?" Questions phrased like that come from a business head rather than an engineer, and a dashboard screenshot will not answer them. Most network operations groups can produce evidence that something happened. Producing an explanation of why it happened, in language a finance director will accept, takes hours of manual correlation across separate consoles.

Scheduled Autonomous AI SRE Agent as a Kubernetes Guardian: AURA

Some agent work should pause for a person. This is the other case: a health check every two minutes, one bounded action, and a result nobody approved. Each scheduled run starts the normal AURA image in one-shot mode: check one workload, act if something is wrong, write the result to the job log, and exit. Overlapping runs are forbidden.

How Technology Is Changing Accountability Inside Modern Companies

A missing approval, deleted message or unexplained payment once left investigators relying heavily on memory and conflicting accounts. Inside modern companies, the same event may now leave timestamps, access logs, version histories, automated alerts and a record of who was expected to act.

Google SecOps (Chronicle) Pricing in 2026: Full Cost Breakdown and How to Cut It

Google SecOps, formerly Chronicle, is sold in three packages priced on ingestion volume, and Google publishes no list prices for any of them. Every quote is built around your data volume, retention needs, and package tier, which makes budgeting hard without a sales conversation. This guide breaks down how the pricing model actually works, what ends up on a real bill. It also covers how to reduce that bill before data reaches the platform. Prefer to jump straight to the numbers?

The August 6, 2026 GitHub Actions Outage: Queued Jobs, Throttled Webhooks, Impact Lasting 10 Hours

On August 6, 2026, GitHub opened an incident for degraded Actions performance at 15:22 UTC. Within about twenty minutes, Actions availability was listed as degraded, workflow runs were failing to start or failing partway through, and the Actions REST API was returning errors. Pages was pulled into the same incident shortly afterwards. The status page marked Actions and Pages as mitigated at 00:05 UTC on August 7, and closed the incident at 02:04 UTC.

Best Synthetic Monitoring Tools for Citrix, Web Apps & Digital Workspaces

Employee productivity and customer satisfaction depend on the consistent performance of digital workspaces, virtual desktops, web applications, and SaaS platforms. While reactive monitoring identifies issues after users experience them, synthetic monitoring tools enable organizations to detect and resolve performance problems before business operations are affected.

Homelab AI SRE Agent: AURA Debugs Container Permissions in Docker

A root cause is not a fix. AURA keeps working the problem, taking what you find on the host and coming back with the user ID mismatch behind the failure. What follows a root cause is normally manual: check the mount, compare ownership on the host against the user inside the container, and get it wrong at least once before it lands.

10 Best MySQL Monitoring Tools Compared for 2026

Your monitoring console probably covers the switches, the hosts, the VMs and the application traces. The database tier is the gap. It tends to live in a separate tab. Somebody opens that tab once the incident bridge has already started. That gap got more expensive this year. On 21 April 2026, Oracle moved MySQL 8.0 to Sustaining Support. The version most production estates still run no longer gets new fixes. Good MySQL monitoring tools close the gap.

Safer Pipeline Changes, Flexible Deployment, and More

August 5, 2026 The latest VirtualMetric DataStream release focuses on how pipeline changes move from idea to deployment, safely and without slowing teams down. Version 2.1 puts a deliberate step between building a pipeline and shipping it to production, along with new deployment options for Directors and multi-tenant ingestion for teams managing data across many customers. Here’s what’s new.

What Is sFlow? A Guide to Sampled Flow Monitoring

What do you do when the switch carrying most of your traffic is the one device that cannot tell you what is on it? On high-speed core and data centre links, full flow export pushes device CPU past a comfortable line, so the export gets switched off and the busiest segment quietly becomes the least visible one. sFlow was built for that exact situation.

Paste a Slack Bug Report into an AI SRE Agent: AURA Finds the Cause

A coworker says checkout is broken and nothing else. That is the whole prompt. AURA reads the live logs and comes back with the payment service. Normally a message like this is the start of guessing at a service and opening dashboards until something looks wrong. Here it is the entire input: no service named, no error string, no time range.

Infrastructure Monitoring Tools Enterprise IT Teams Should Evaluate in 2026

As enterprise IT environments become increasingly distributed, monitoring infrastructure performance is more challenging than ever. Organizations must manage on-premises systems, cloud services, virtualized environments, databases, networks, containers, and digital workspaces from a unified operational framework. This growing complexity has elevated the importance of modern infrastructure monitoring tools that provide end-to-end visibility, proactive alerting, and intelligent diagnostics.

Don't Leave the Door Open - Keep Your Third-Party Plugins Updated

Yesterday (5 August), the WooCommerce team urged store owners to immediately update the WooCommerce Stripe Gateway following the discovery of a critical security vulnerability in the Stripe for WooCommerce plugin. This is the second urgent security update in less than 30 days, with the previous advisory issued on 14 July. It serves as another reminder that cyber threats evolve quickly, and delaying updates can leave your online store exposed. The lesson isn’t limited to WooCommerce.

Building trusted agentic AI in financial services: From data to autonomous action

As financial institutions move from AI experimentation to autonomous operations, trusted context, governance, and observability become the foundation for enterprise-scale Agentic AI. Artificial intelligence in financial services is entering a new era. Historically, financial services companies have focused on deploying generative AI to improve productivity, enhance customer experiences, accelerate software development, and streamline operations.

8 Best Vulnerability Management Tools for Scanning, Prioritizing and Patching

A vulnerability scanner will hand you more work in one afternoon than the service desk can clear in a quarter. Thousands of findings arrive ranked by severity, every one of them technically actionable. Fixing them takes weeks, and in most organizations the backlog grows faster than it clears. That gap is what this guide is about. Every tool here scans reliably, scores findings sensibly and reports clearly.

How the Vulnerability Management Lifecycle Runs from Discovery to Verified Fix

Who in your organization can say, without opening three separate systems, whether last month's critical findings are actually closed? A deployment record answers half of that. The other half needs a rescan, and the rescan often never happens. The vulnerability management lifecycle is that question written down as a repeatable process. It runs from knowing what you own through to proving a fix landed, and it restarts the moment it closes.

Free Open Source AI Agent for SRE and More: Why We Give AURA Away

Wondering what the catch is on a free, vendor-backed agent? There is not one in the license. AURA stays Apache 2, fully capable, and free to run. If you are weighing an open source tool with a company behind it, the first question is what the catch is. You have seen the project that turns out to be open core, or that is quietly hindered in one key way. This is Mezmo's answer for AURA.

Open Source AI Agent for SRE: Why AURA Is Free

The most common question since we started 31 Days of AURA: how do you plan to make money? The short answer is the control plane, not the agent. Mezmo sells an enterprise-grade control plane for running large numbers of agents across large environments, where coordinating across environments, governance, access control, and the efficiency of preprocessing MCP data start to matter. If a hundred people run AURA and three or four of them need that, the model works. The more people running AI agents in production, the bigger the market for the tooling underneath them.

Install an AI SRE Agent in Kubernetes with AURA and Helm

AURA does not have to live on your laptop. Install it into the cluster with Helm and it is still there the next time something breaks. AURA is a fully open source AI agent built specifically for SRE work. Rather than one general assistant, you configure workers: separate agent roles, each scoped to a job like inspecting the cluster.

How we built an automated debugging workflow at Sentry

AI is going to generate a lot of code from here on out, and a lot of bugs along with it. You already know this. We’ve talked about it before. The bigger challenge is making sure you don’t spend all your time fixing the broken code your agents write. You’re going to need a system that makes it easier to fix those issues for you and fortunately, there are a lot of solutions out there for building automated workflows.

How to Monitor Internet Uptime

Your ISP tells you your connection is up 99.9% of the time. Your users tell you the MS Teams video calls keep freezing. Both can be true at once, and that gap is exactly why you need to monitor Internet uptime yourself instead of taking your provider's word for it. This article covers what Internet uptime actually means, how to calculate it, what a good internet uptime SLA looks like, and how to monitor internet uptime with your own data so you're not stuck relying on your ISP's version of events.

Find, analyze, and collaborate on user sessions in Datadog Session Replay

Teams supporting user-facing applications rely on session replays to understand user friction. But resolving an issue or improving the user experience takes more than watching a replay. Engineers, product managers, and designers first need to find the right sessions to investigate, then quickly learn what happened at the key moments. Once they’ve investigated a replay, they need to share what they found across product, design, support, and engineering so that the right teams can act.

An Agent Is Only as Good as the Baseline It Reasons Against

Every vendor in networking has an agent story right now. The useful question for an operations leader is which of those agents can plan, act, and verify against a trustworthy model of the network, and which are assistants that retrieve and suggest, then leave the decision to a person. The direction of travel is settled.

The Future of Enterprise Messaging: What 2026-2030 Holds

Enterprise messaging is not a solved problem sitting still. The last five years have reshaped the technology landscape in ways that are still working their way through enterprise architecture decisions: Kafka's dominance in event streaming, the rise of cloud-native managed messaging (Amazon MQ, Azure Service Bus, Confluent Cloud), the democratization of the Kafka protocol across competing implementations, and now the early emergence of agentic AI as a new category of messaging consumer.

What Is an SAP System? A Plain-English Explanation

An SAP system is an installed instance of SAP’s business software that runs an organization’s core processes, like finance, supply chain, and HR, on a single, shared database. If you’re new to a company that runs on SAP, this guide explains what that actually means: what the software does, what an SAP system is made of, and why companies talk about DEV, QAS, and PRD like they’re three different things. They are.

SAP Cloud Connector: Essential for Ground-to-Cloud and AI Operations

When SAP unveiled the Business AI Platform at Sapphire 2026, it folded BTP, Business Data Cloud, and Business AI into a single governed environment. BTP didn’t disappear but became essential architecture underneath SAP’s agentic AI direction. A big part of the repositioning included cloud and AI enablement of existing systems, data and enterprise context: the cloud half of every hybrid SAP estate just got more capable and more strategic, and SAP Cloud Connector plays a central role.
Sponsored Post

The key to secure transmission: TLS in the Raygun ecosystem

As our lives increasingly move online and data becomes the lifeblood of business, secure data transmission is imperative. From personal conversations to financial transactions, from healthcare records to sensitive business data, nearly everything we do online requires trust that our data is protected. And if you've ever made an HTTPS request, TLS is behind it, providing that trust.
Monitor your Amazon Bedrock workloads with Applications Manager

Organizations are increasingly integrating GenAI capabilities into their applications to deliver richer, more contextual user experiences—from AI-powered customer support and enterprise search to content generation, virtual assistants, and automated workflows. To build and scale these GenAI-powered experiences, they are turning to platforms such as Amazon Bedrock, which provides access to foundation models that developers can integrate into their applications.

BGP monitoring: Fixing the blind spot in your digital experience monitoring stack

Without Border Gateway Protocol (BGP) monitoring, your digital experience monitoring (DEM) stack can't detect the route hijacks, leaks, or instability that prevent users from reaching your applications. Most DEM stacks miss this entirely, and that gap is where some of the most damaging, hardest-to-diagnose outages happen.

From Claude Code to Production: A Monitoring Checklist for Python Developers

Python is the native language of AI-assisted development. Models are really good at writing it, and a lot of people are now shipping it without ever having written much Python themselves. The whole thing is really simple. You prompt an app, Claude Code or Cursor produces a working Flask or FastAPI backend, and you’re live in a few hours. However, there’s still a big difference between “it works on my machine” and “it works in production”.

Keyword Monitoring: Check Content, Not Just Uptime

Updated August 05, 2026 Keyword monitoring checks that a specific string is still present in a page or API response on every run, instead of trusting the HTTP status code. It catches the failures that uptime checks sleep through: a deploy that renders an empty template, a CMS entry someone unpublished, a checkout page serving "Something went wrong" with a perfectly healthy 200. In Hyperping, the simple version is a text body assertion on an HTTP monitor and takes about ten seconds to set up.

Integrating Icinga and Prometheus

Guest post by Markus Opolka, Senior Consultant at NETWAYS. Originally published on the NETWAYS blog as “Icinga und Prometheus integrieren” and “Alertmanager-Icinga-Bridge – Ein Signalilo Fork”, combined and adapted for the Icinga blog with permission. Icinga and Prometheus are both great monitoring solutions, however, their focus is different. In this article, we look at how to integrate both monitoring systems and utilize the strengths of both tools.

This Month in Datadog - July 2026

In July’s episode of This Month in Datadog, Ruxanda Lueck joins Jeremy for a conversation about how you can confidently evaluate and release features that contain AI-generated code. She also discusses her career trajectory from containers to AI, how agentic workflows impact trust during feature development, and the challenges of testing nondeterministic agent behavior.

Open 360 AI's chat is now powered by OrionIQ

OrionIQ’s agentic investigation is now built into Logz.io Open 360 AI. Ask a question and OrionIQ investigates across your telemetry, shows its work as it goes, links every finding back to the exact query behind it, and tells you how much to trust the answer. Today we’re bringing OrionIQ Chat into Open 360 AI. This is the first OrionIQ product to ship inside the Logz.io platform, and it’s the same agent that powers the standalone OrionIQ app, now available right where you already work.

What are the Key Features and Evaluation Criteria for Vulnerability Assessment Tools?

How many findings from your last vulnerability scan have been verified as fixed? For most IT functions, the scan report is easy to produce, and the proof of closure takes far longer to assemble. That difference tends to surface at the worst possible moment, usually an audit or a post-incident review. Vulnerability assessment tools are meant to end that uncertainty. They inspect systems, match what they find against public vulnerability databases, and rank each weakness by how dangerous it is.

What Is SOC 2 Compliance? Requirements, Controls, and Evidence

Your largest prospect has asked for your SOC 2 report. The deal sits still until you produce one. Most teams handle the first half of SOC 2 compliance fine. They control access. They run backups. They put changes through approval before anything ships. The second half is what stops them, and that half is proof. Your policy says access gets reviewed every quarter. The auditor wants the dated review, the signature on it, and the same record from eight months ago.

Introducing AI BubbleUp

BubbleUp has always been the fastest way to figure out what a group of outliers have in common. Draw a box around a band of slow traces, a cluster of errors, or any set of events you're interested in, and BubbleUp compares that selection to the baseline across every dimension you've sent us. It's how Honeycomb users find the "unknown unknowns" that dashboards can’t show you.

Why Staying Current Makes Modernization Easier

Most organizations don’t experience modernization as a single initiative. It unfolds over months and years, through a series of decisions made as technology shifts, business needs change, and operational demands grow. Teams adopt new capabilities, automate manual work, sharpen visibility, and strengthen security. These efforts look independent, but they share one requirement: a platform foundation that can keep up with continuous change.

Your OTel spans, our errors: A Sentry love story in one trace

You can already send OTel traces to Sentry. Point your OTLP exporter at Sentry’s endpoint, set environment variables, and your spans show up in the trace explorer. Our OTLP setup guide and “You Don’t Need to Pick One” walk you through that. But those spans are islands. You get a trace waterfall in Sentry, sure.

Enterprise AI isn't broken; your data is broken

A friend who runs data engineering at a mid-sized logistics company once showed me something that made me laugh, and then made me a little sad. Her team spent four months building a chatbot that was supposed to answer simple questions like "how many shipments are delayed in the Chennai warehouse right now." The bot worked beautifully in the demo. Then someone asked it a real question, and it confidently returned a number that was off by almost a factor of ten. Not because the model was dumb.
Sponsored Post

Building a Modern Cloud Outage Response Workflow in Slack and Microsoft Teams

On May 7 and 8, 2026, a thermal event in a single AWS data center hall knocked out power to EC2 instances and EBS volumes in a single Availability Zone in us-east-1. Within hours, more than 150 cloud services went down, including Coinbase, Reddit, HubSpot, and Atlassian's suite of tools, Jira, Confluence, and Trello among them. For teams without a structured cloud outage response workflow, the next several hours looked familiar: Slack DMs asking "is it down for you too?", tab-switching between status pages, and incident commanders repeating the same update in three different channels.

From Vision to Value: New Splunk Platform Innovations Supporting Cisco Data Fabric Are Generally Available

At.conf25, we announced our vision for Cisco Data Fabric, an architecture designed to help organizations unlock the value of machine data, fuel AI with trusted context, and support more intelligent and resilient operations. Today, that vision has become reality. Key Splunk Platform innovations including Machine Data Lake, Catalog, and Agent Launchpad, together with expanded Federated Search and Data Management capabilities, are now generally available.

Building an AI Observability Agent: Lessons from the Trenches - Stripe at O11yCon 2026

Stripe shares lessons from building an incident investigation agent, from context-window blowups to why the final 5% still needs a human. In this O11yCon 2026 talk, they dig into what it takes to go from 'it works' to 'it works reliably,' including how pointing agents at like Honeycomb's speeds up on-call investigations.

Signal vs. Spend: Building Cost-Aware Observability at Slack - O11yCon 2026

It started with a single log line taking up a massive amount of volume: 500 million emissions per hour. Pulling that thread led Emma and Steven into Slack's broader logging pipeline: 311 billion logs per day at 4.4M/sec peak, with no volume limits, no per-service attribution, and no feedback to the teams generating the noise.

Where Historians Fall Short for Physical AI

Summary Physical AI—machines and industrial systems that sense conditions, reason, and act in the real world—needs two things from operational data: detailed history for training, and real-time telemetry for inference. Traditional data historians weren’t built for either at the speed Physical AI requires. Four gaps result: limited real-time access, compression that strips model-relevant signal, IT/OT fragmentation, and site-by-site architectures.

How SigNoz MCP Helped MSI Find 20 Unnecessary Operations

Taylor Mattison explains how SigNoz MCP helped surface wasted work inside MSI's sales-order workflow. Warning checks were firing on user actions that had nothing to do with any warning they could raise. By comparing telemetry across the workflow, Taylor could point to unnecessary operations that were wasting API calls, database time, and server capacity. This clip is part of our MSI customer story on using SigNoz MCP with Claude to debug slow sales orders across the stack.

AMA Recap: More Answers From the Observability Engineering Authors

Last week, we sat down with the authors of Observability Engineering for a live AMA. We ended up getting so many questions (pre-submitted and live) that we couldn't get through them all. Charity, Liz, George, and Austin kindly stuck around afterward to answer more, ranging from low-hanging observability fruits and telemetry to AI and what software engineers can do that Claude can't. Missed the live session? Watch it on demand now.

The Margin Leak Business Services Firms Can't Bill Away

Business services firms are built on people’s time, judgment, and credibility. When a consultant loses half an hour before a client workshop, a legal team is stuck waiting for a document system, or a service delivery group has to move conversations elsewhere because collaboration tools are unreliable, it may not register as a major IT event. It still changes the economics of the work, because skilled time is being spent compensating for the environment instead of serving the client.

Azure Virtual Desktop Monitoring: Challenges, Metrics & Best Monitoring Solutions

Azure Virtual Desktop (AVD) is rapidly growing in popularity as modern way to deliver virtual desktops and apps to users, with Azure providing the infrastructure as alternative to on-prem VDI environments. As organizations expand their use of AVD in Azure, monitoring becomes critical.

Vulnerability Assessment and Penetration Testing: Differences, Cadence, and Cost

What do you say when an auditor asks for evidence that your security controls hold, and all you can produce is a scan report from last month? A scan lists weaknesses. It says nothing about whether an attacker could chain three of them together and reach the customer database. Vulnerability assessment and penetration testing answer two different questions about the same environment. The first asks what is exposed right now. The second asks what someone with intent and skill could do with that exposure.

What Is the MITRE ATT&CK Framework? A Guide for IT Ops Teams

Most IT operations teams cannot say how much of the MITRE ATT&CK framework they already cover. The framework gets explained in the language of threat hunting and red teams. The parts that belong to infrastructure work are easy to miss. And then, coverage questions get answered with a guess. The mismatch costs time on both sides. Security asks for a coverage answer that ops has no clean way to produce. Yet the controls that stop a large share of those techniques already sit with your team.

Best Server Monitoring Tools for 2026

Server monitoring is still one of the most important disciplines in IT operations because servers remain central to application performance. That is why server monitoring tools remain essential for maintaining infrastructure health, ensuring application availability, and delivering consistent user experiences across modern IT environments.

What Is a Vulnerability Scan? How It Works and What the Results Mean

How many machines in your environment are running software with a publicly documented security flaw right now? That figure comes from an asset inventory, and asset records age quickly once they are written. The gap is rarely about tooling budgets. Software inventory across a few hundred endpoints shifts every week, while the published catalogue of flaws in that software grows every single day. Manual inspection loses that race inside the first month.

What Is Network Latency? Causes, How to Measure It, and Ways to Reduce It

Slow application complaints are among the hardest tickets in IT to close. The network gets blamed first; the dashboard shows nothing wrong, and the ticket bounces between teams for a week. Network latency sits at the centre of that argument more often than any other metric. Most dashboards report latency as a single average, and that average hides the slow requests people actually notice. A path can average 30 ms and still drop a call every ten minutes.

Spend More Time Talking to Humans

A few months ago, I noticed something happening. I would spend all day working with LLMs—prompting them, reviewing their work, and correcting them—and when I wasn’t working on my own code, I was reviewing LLM-generated code. By the end of the day, I was exhausted. This was a very unusual thing for me: I’ve been a software developer at startups for 30 years, and while sometimes I might have gotten stressed out, I had never been exhausted by the actual act of writing code.

Site24x7 Free Training Day 2: Infrastructure monitoring, custom plugins, cloud cost management

This session covers everything you need to know about infrastructure monitoring, starting from agent-based server monitoring to database monitoring, container monitoring (Docker & Kubernetes), multi-cloud monitoring (AWS, Azure, GCP, OCI), IT automation, custom plugins, and ManageEngine CloudSpend for cloud cost management. If you're looking to master full-stack infrastructure observability, this hands-on walkthrough shows you exactly how to set up and use each Site24x7 module inside the live console.

Progress WhatsUp Gold Recognized as a SPARK Matrix Leader in Network Observability

We’re proud to share that the Progress WhatsUp Gold solution has been recognized as a Leader in the QKS Group SPARK Matrix: Network Observability report, ahead of other vendors such as SolarWinds, Paessler PRTG and LogicMonitor to name a few. The recognition highlights the WhatsUp Gold network monitoring capabilities that help organizations gain deeper visibility into complex network environments while delivering impactful benefits for customers.

How to install Kubernetes using OpenShift's CLI | Site24x7

Running Kubernetes on Red Hat OpenShift adds powerful enterprise capabilities—but also introduces operator-driven workloads, stricter RBAC and SCC policies, and platform-specific complexity. In this video, learn how Site24x7 enables platform-aware monitoring for OpenShift environments, helping DevOps and platform teams gain complete visibility without blind spots.

DEX Data Is Too Valuable to Limit to IT

For many organizations, digital employee experience (DEX) is still viewed as an IT project. It measures endpoint health, identifies performance issues, and helps service desks resolve incidents faster. While that’s useful, it’s also far too small a vision. In order to get the greatest return from DEX, organizations have to stop treating it as exclusively an engineering capability and started treating it as an equally powerful intelligence capability.

Product leaders talk safer, faster releases and deeper analysis with Bits | This Month in Datadog

In July’s This Month in Datadog, Jeremy is joined by Datadog product leaders for in-depth conversations about how Bits enables you to confidently evaluate and release features containing AI-generated code, and use natural language to ask, understand, and act across Datadog.

Essential Tech Upgrades To Boost Your Airbnb Bookings

If you run an Airbnb, you're probably always looking for ways to boost your bookings and make your rental more lucrative. Unfortunately, a successful Airbnb requires more than fresh linens and a prime location. Most travelers expect a seamless, modern experience from the moment they book, and they need to be able to check in quickly without having to worry about keys or other arrangements. What can you do to improve guest satisfaction in a single cozy studio or a portfolio of luxury vacation rentals? Here's everything you need to know.

Why Managed IT Solutions Are Critical for Protecting Sensitive Business Data

Every business, big or small, stores lots of sensitive information about their customers, finances, and day-to-day operations. Because businesses use an increasing number of digital tools to handle everything they do, there's a much higher chance that all this private info could be exposed, lost, or stolen.

JavaScript Error Monitoring: 12 Best Practices to Cut Noise & Ship Fixes Faster

Most of what shows up in a JavaScript error tracker isn't a bug you need to fix; it's noise. Third-party scripts, browser extensions, and edge-case devices flood the feed, and the errors actually hurting your users get lost in it. This guide covers 12 production-tested practices for setting up JavaScript error monitoring that surfaces real, user-impacting bugs, not console spam, plus the error types you'll run into most often and how to configure alerting so your team stops getting paged for noise.