
Operations | Monitoring | ITSM | DevOps | Cloud

Go, Logs and the Engineering Behind VictoriaLogs Performance

What actually makes a logging system fast? That was the question behind Tech Talk. And if you were expecting the answer to be a collection of clever Go optimizations, Jesús Espino, Principal Engineer at VictoriaMetrics, made an important point pretty early in our conversation: A huge part of VictoriaLogs’ performance comes from architecture and data structures. The micro-optimizations come later. Now that gave my Tech Talk partner in crime, Mathias Palmersheim, and me plenty to dig into.


The Grafana AI SDK for Go: a shared foundation for building AI applications

Starting an experiment with an LLM has never been easier. Keeping a growing collection of those experiments consistent is another matter. Earlier this year, as more teams began exploring AI features here at Grafana Labs, we repeatedly encountered the same pattern: a new experiment would start, move quickly, and build its own client for whichever model provider it needed. The next experiment would do the same, with a slightly different abstraction for streaming, tools, errors, or provider configuration.

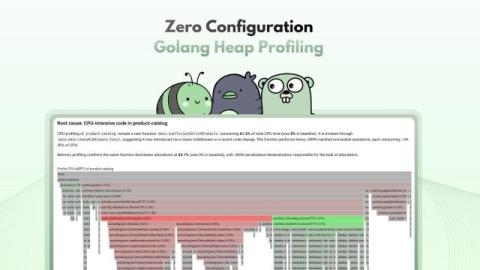
Zero-config Go heap profiling

Coroot's node-agent already collects CPU profiles for any process on the node using eBPF, with zero integration from the application side. For Java, we dynamically inject async-profiler into the JVM to get memory and lock profiles. But Go processes were still a blind spot for non-CPU profiling unless the app exposed a pprof endpoint and the cluster-agent scraped it. We wanted the same zero-config experience for Go heap profiles. This post is about how we got there.

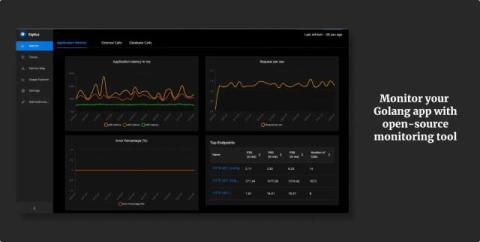
Golang Monitoring Guide - Traces, Logs, APM and Go Runtime Metrics

Golang (Go) applications are known for their high performance, concurrency model, and efficient resource use, making Go an easy choice for building modern distributed systems. But just because your Go application is built for speed doesn't mean it's running perfectly in production. When things go wrong, just checking if your service is "UP" isn't enough.

The Silent Leak: How One Line of Go Drained Memory Across Thousands of Goroutines

This technical deep-dive reveals how Harness engineers discovered and fixed a critical Go memory leak where reassigning context variables in worker loops created invisible chains that prevented garbage collection across thousands of goroutines, ultimately consuming gigabytes of memory in their CI/CD delegate service.