Operations | Monitoring | ITSM | DevOps | Cloud

Identity Management and BTP: An Unexpected Requirement

Ask an SAP Basis or security team how they control access to their ERP, and you’ll get a confident answer. User master records, PFCG roles, firefighter IDs, separation of duties policies, and an audit someone reviews regularly. Decades of audit findings have hardened those controls. Ask the same team who can deploy code to their BTP subaccounts, and the answer is far from so confident.

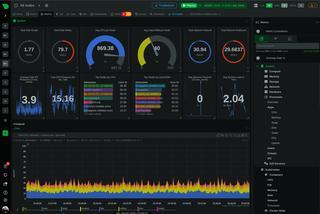
Grafana 13.3 release: manage variables across dashboards, share findings with Notebooks, a UI refresh, and more

Grafana 13.3 is here, bringing more consistency and control to how you work across Grafana. Cross-dashboard variables help you manage shared dashboard controls from one place, while Notebooks let you capture and share findings from across Grafana in a single, editable document. You'll also get a first look at Grafana's biggest visual refresh since Grafana 7, along with new ways to guide and refine dashboards built with Grafana Assistant.

Connecting Cloudflare and Honeybadger with OpenTelemetry

Honeybadger Insights is pretty great. It's even greater when you connect it to Cloudflare and start shipping logs directly from Cloudflare Workers to Insights. If you're already using Cloudflare to distribute your applications, it's easy to set up. Cloudflare Workers logs capture what your application is doing at the edge: console.log() output, uncaught exceptions, and system-generated logs for each request.

Measuring soft navigation web vitals

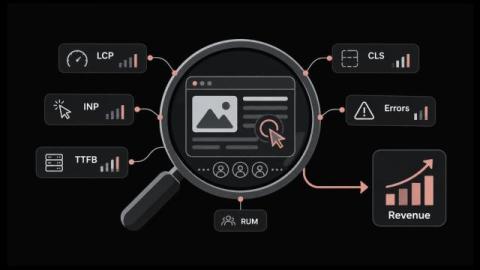
If we were to reduce web performance into a single term, it would be “web vitals”. Web vitals are a universal signal that every developer can measure, and more importantly, optimize for. They describe many facets of the user experience when it comes to performance, but they were limited to specific types of navigations. Capturing web vitals for your apps has been largely about users landing on your site from somewhere else. We measured that experience and you optimized for it.

FortiGate, PAN-OS and Zscaler dashboards: get firewall logs into the fields they read

FortiGate, PAN-OS and Zscaler now each have a six-dashboard pack in the Dashboard Library, live on every Logs stack. If your firewall logs already arrive as parsed module fields, the Library pre-selects the matching pack. If they don't, it won't, even when the firewall has been sending syslog for years. This post is about that gap: which parsed fields each pack reads, the Filebeat module settings that produce them, and the API checks that tell you whether the dashboards will fill before you install them.

Detect when your AI agent copies a self-replicating prompt injection

In September 2026, OpenAI reported finding self-replicating prompt injections. These attacks hide instructions in content an AI agent retrieves, directing it to take unauthorized actions and copy those instructions into emails, files, or messages. Copied instructions can then expose other agents or later sessions to the same attack, giving it the potential to spread like a computer worm.

Datadog named a Leader in the Forrester Wave: AIOps Platforms, Q4 2026

Datadog has been named a Leader in The Forrester Wave: AIOps Platforms, Q4 2026. We believe this placement reflects Datadog’s commitment to transforming observability into autonomous operations with a single integrated platform where AI agents detect, investigate, and remediate production issues, while engineers stay in control. Close dialog.

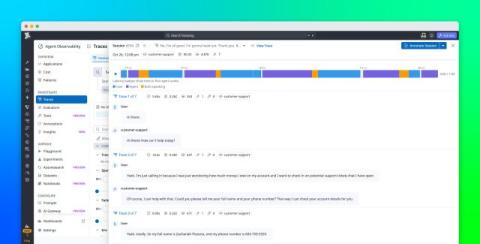
Trace voice agents with Datadog Agent Observability

A voice agent can return the right words and still deliver a poor experience. It might leave a caller in silence, speak over them, or stop midway through a response. A transcript may look correct even when the audio the user heard was delayed, incomplete, or different from the text on screen. These problems are difficult to diagnose from text traces alone. Voice conversations also involve more than a single request and response.

Network Optimization Guide With 10 Top Ways to Cut Slowdowns and Downtime

Why does everything crawl at peak hour, even though every switch looks fine? Calls break up and file copies stall. Then the tickets arrive, each one some version of "the network is slow." It's rarely one broken device. A WAN link maxes out for an hour with voice packets queued behind a backup job. Last week's config change hasn't been linked to any of it yet. Network optimization sorts this out one measured step at a time, starting with performance monitoring.

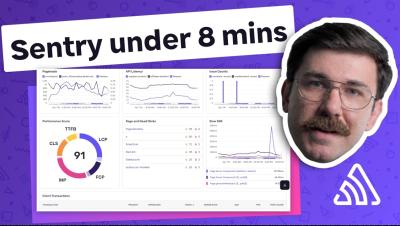
Sentry under 8 mins

If you've never used Sentry, this is the short version. In under eight minutes, we walk through what it does, what it captures, and where to go next. Sentry is an application monitoring platform. It collects errors, logs, timings, and replays, and ties them together with tracing, so you can go from "something broke" to the line of code that broke it without opening six tabs. Here's what we cover: On data: out of the box, Sentry scrubs things like passwords, tokens, and credit card numbers. You decide what else gets collected, and you can choose US or EU storage.

Default to serverless for AI agents, then let production data decide what moves

Serverless should be the first execution model teams evaluate for AI agent workloads. Many agents spend much of their lifetime waiting, and always-on compute forces teams to pay for every idle minute. In a study of more than 35,000 production coding-agent sessions, the median session ran LLM or tool calls for only 20% of its lifetime. The rest of the time, it sat idle between steps, with its sandbox still allocated.

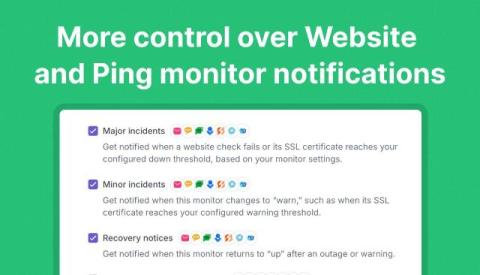
More control over Website and Ping monitor notifications

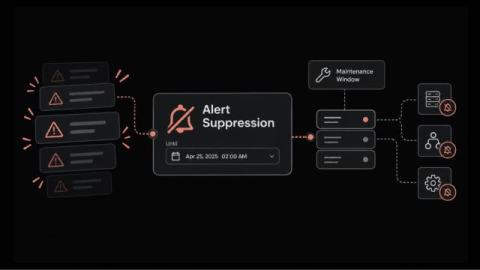
You can now choose which status changes trigger alerts for Website and Ping monitors, bringing the same notification control previously available only for Service monitors. Keep recovery notifications on, focus on downtime, or include SSL warnings for your websites. Adjust each monitor to receive the alerts that matter to you.
Featured Post

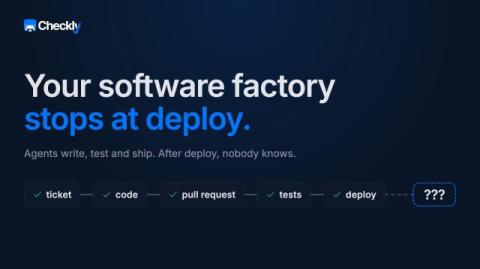
We've Never Shipped Code This Fast. Understanding It Hasn't Kept Up.

Ask anyone where dev ends and ops begins and they'll struggle to draw the line. That's the point of the last decade of DevOps: the two disciplines merged so completely that the boundary stopped mattering. But ask where building ends and understanding begins, and everyone answers instantly. Right after deploy.

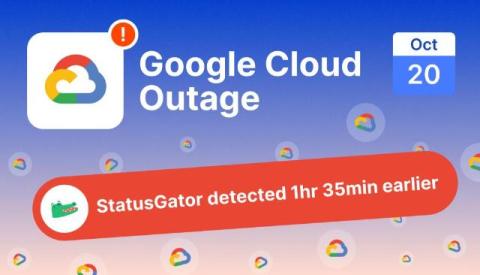
Google Cloud outage on October 20, 2026: a europe-west2 power event and 171 possibly affected services

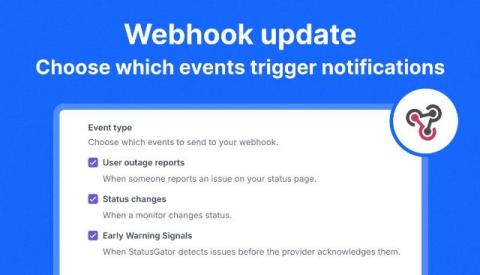
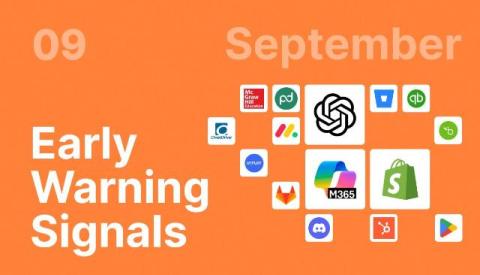
A power event in Google’s europe-west2-b (London) zone triggered a wide Google Cloud outage on October 20, 2026, taking down dozens of services including Cloud SQL, BigQuery, Compute Engine, and Kubernetes for customers across the UK and beyond. StatusGator sent an Early Warning Signal at 07:02 UTC, 1 hour and 35 minutes before Google Cloud publicly acknowledged the incident at 08:37 UTC. The ripple effect was wide: StatusGator tracked 171 other services showing signs of impact during the outage.

Why AI-Generated code still needs tests

AI has made life easier for us developers. Dozens of AI tools are getting more advanced every day, shortening and speeding up the development cycle. Converting an idea into a concrete MVP is faster than ever before. Intelligent models turn your ideas into a working project with just a few prompts. End users or product owners can see the application, use the beta version, and give feedback on the spot.

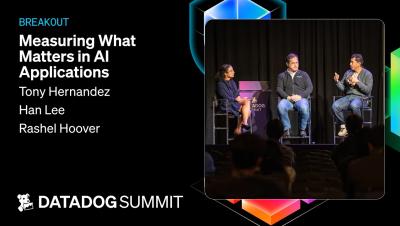
Measuring What Matters in AI Applications

AI has become incredibly sophisticated and changed the way we build and power applications. But it has also introduced volatile complexity that challenges how we ensure reliability and protect user experiences. Join our panel of experts as they discuss the realities of building AI-powered applications. They’ll talk about how testing has evolved, share insights into how they do evals and experiments, and offer advice on how to get better visibility into how your AI is performing.

The Deconstructed Database at Datadog

As Datadog scaled to handle over a hundred trillion daily events, our engineering teams built their own custom query engines to keep things fast. While this helped teams move quickly, it also created silos that made it tough to analyze data across different products. To keep growing and support AI, we had to find a way to bring these engines together using open standards without slowing anyone down or risking reliability.

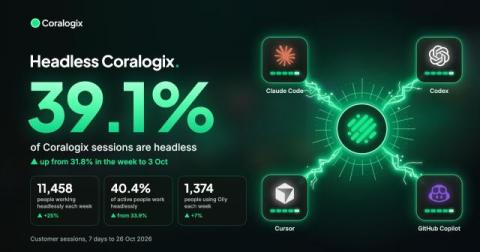
39% of Coralogix sessions are now headless

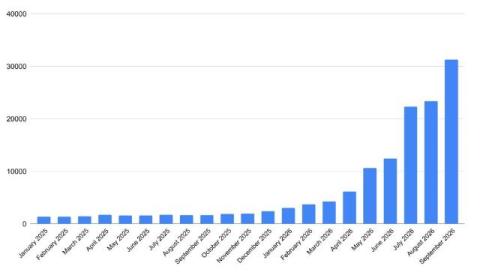
We set out to understand how customers were using Coralogix from outside the web app. Olly answers questions about a system in plain language. Coding agents query logs, examine traces, read metrics and configure the platform through the Coralogix CLI and MCP server. We wanted to see how much of this was becoming part of everyday work. In the week of 20–26 October, 39% of Coralogix sessions included Olly, the CLI or MCP.

Meet the new Explore: every question, one place

From the first alert to the root cause, without leaving the page. TL;DR: Investigating an incident is a series of quick questions, each one leading to the next. Until now, Explore made you stop between questions to translate them into syntax, switch modes or rebuild a chart. The new Explore lets you go straight from one question to the next: one workspace, any dataset, any team, any way you like to ask. Here’s what that looks like on a real night on call.

Match monitoring depth to workload needs with Infrastructure Basic

A back-office server that runs out of disk space can interrupt an important internal workflow. A process that stops on a staging host can delay development. Although workloads like these might not require application-level instrumentation, teams still need to know when the hosts that support them require attention. Without a monitoring solution tailored to these requirements, teams have to apply more monitoring than the workload needs, maintain a separate tool, or accept a gap in visibility.

Elastic is a Strong Performer in The Forrester Wave for AIOps Platforms, Q4 2026

Open architecture, explainable AI, and full context Elastic was named a Strong Performer in The Forrester Wave: AIOps Platforms, Q4 2026, which evaluated 10 providers across 24 criteria. Forrester gave Elastic the highest possible scores in five criteria: algorithmic trust and explainability, observability as code (OaC) and GitOps alignment, AI stack and semantic observability, sovereign deployment and data isolation, and pricing flexibility and transparency.

The Hard Part of Incident Remediation Is Knowing When to Act

A critical application slows overnight. Monitoring identifies an unhealthy component, and an engineer finds a familiar remedy: restart a service. The command takes seconds. Determining whether the restart will restore the application or disrupt another dependency takes far longer. That is the real challenge in enterprise incident remediation. Most IT teams already know how to automate a task.

Demystifying NODE

Having spent significant time working with the Network Observability Deployment Engine (NODE), I can confidently say that modernizing network observability does not have to feel like black magic. NODE simplifies how we deploy, scale, and manage complex network observability environments. Whether you're working with Kubernetes for the first time or streamlining an enterprise monitoring stack, NODE brings structure and clarity to the setup process. At its core, NODE relies on two main building blocks.

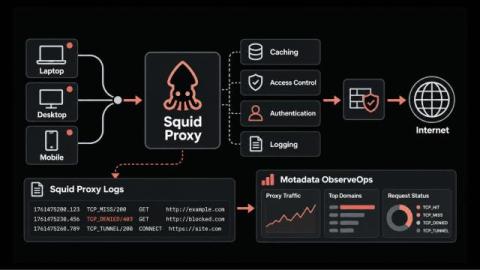
What Is Squid Proxy and How to Keep It Fast, Secure and Observable

How long does it take your service desk to rule the proxy in or out when a user says a site won't load? The proxy carries every outbound web request in most companies, and it still tends to be checked last. So service desks guess, even though the proxy has already logged what happened to that request. For a lot of those companies, the proxy is Squid. It has cached pages and enforced web policy for close to three decades, and it logs every request it touches.

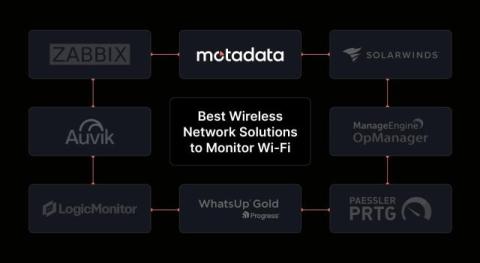
8 Best Wireless Network Solutions to Monitor Wi-Fi in 2026

If your Wi-Fi keeps slowing down or dropping connections, checking whether your access points are online won't tell you much. You need to know what's causing the problem, whether it's weak signal strength, overloaded access points, or too many connected devices. Wireless network monitoring tools help you track these issues, monitor access point health, and spot problems before they affect more users.

Dashboard Library: why some dashboards arrive ticked and others don't

Open the Dashboard Library on a Logs stack that already receives Nginx logs and a few cards come up ticked with a green Data detected badge. Others in the same pack sit there unticked. That isn't random. Before it shows you anything, the Library checks what your stack actually holds and pre-selects only the dashboards it expects to fill.

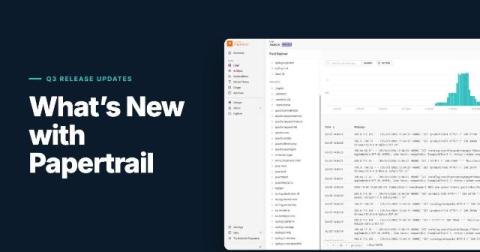
What's new in Papertrail: Q3 2026

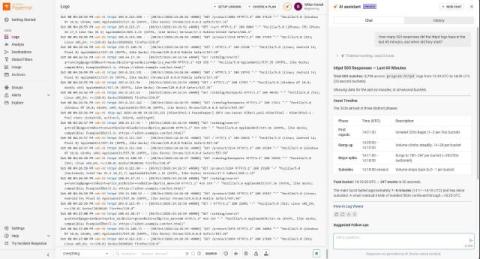
Q3 was a big quarter for Papertrail. You can now ask questions about your logs in plain English, explore structured logs by field, inspect any single log event in detail, and archive to your own S3 bucket with a setup that keeps you in control of access. We also shipped a round of smaller improvements that make sending logs and searching them faster and smoother. Here is a quick overview. The two Preview features have their own deep-dive articles, linked below.

Evaluate AI models for observability: o11y-bench joins Fireworks' Specialized Intelligence Index and reaches v1.1

When evaluating AI models for observability, generating a plausible query or explanation isn't enough. Teams need to know whether an agent's conclusions are supported by telemetry, whether its changes to dashboards actually work, and whether it can deliver reliable results consistently. This is why we built o11y-bench, Grafana Labs' open benchmark for evaluating AI models on observability and SRE tasks. And today, we're excited to share two updates.

Five things you can do with Sentry's Agent Tracing

AI-powered apps are hard to debug without observability. From one run to another, AI produces different results, goes down different paths, and you’re none the wiser as to why it’s happening. Agent Tracing bridges the gap between prompt, tool calls and final output, all within the context of your app. If things break (it always does at some point, we know from experience), you get everything in one complete trace.

Application Metric or Log? Which should you use?

Sentry offers both "Application Metrics" and "Logs", but both can seem pretty similar. Both logs and metrics are just a collection of attributes attached to a name in your code. Both can be counted, visualized, or alerted on. Both are not sampled by default. So how do you know which to choose? In this video, we'll briefly go over a few examples of when to use logs and when to use metrics. TLDR; Logs are designed for debugging and may be temporary or likely to change when problems arise. Metrics on the other hand are stable, purposely placed events used to track user behaviors.
Sponsored Post

The SAP Automation Advantage: What High-Performing SAP Teams Have in Common

Every Basis team has a list. The tasks nobody schedules because they get done by hand, by a Basis miracle worker who knows the sequence. System refresh. Parameter settings across multiple production systems. The cloud invoice with a number nobody can explain. The teams with a short list of manual tasks got there with automation. What separates them isn't enthusiasm for automation as a concept. It's automation covering every system they're responsible for, including the ones without a server login.

Working from home in the AI era: Advantages, disadvantages, and the way forward

Remote work has changed more than where we work. It has reshaped how teams collaborate, how organizations manage performance, and how employees balance professional and personal responsibilities. Now, AI is adding another dimension to this transformation. From AI assistants that summarize meetings to automation tools that handle repetitive tasks, technology is making remote work more efficient in several ways.

How a beagle-shaped AI agent ships code to madewithvuejs.com

This is a guest post from Armin Ulrich, a fullstack developer, and founder of placid.app. He also created the MadeWith* network where he shares his projects and allows other developers to share theirs. Two people and one beagle run the project showcase madewithvuejs.com. The beagle is actually an AI agent that we have added to our workflows, but we’re very fond of her by now. Milly is part of the team, scouting for content, building features and sniffing for bugs.

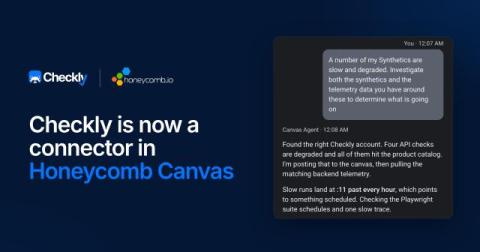
Checkly Is Now a Connector in Honeycomb Canvas

Honeycomb recently launched Canvas connectors, with Checkly serving among its first group of integration partners. With the Honeycomb Canvas connector for Checkly, the Canvas Agent can bring your synthetic monitoring into an investigation to help determine which checks are failing, from which locations, since when, and what Rocky AI identified as the likely root cause.

Resque 3.2 Closes a CSRF Gap in resque-web: What Changes When You Upgrade

Resque 3.2.0 shipped on October 16 with a single change, listed under Security: resque-web now rejects state-changing requests that come from another site. Until this release, resque-web had no cross-site request forgery (CSRF) protection at all. A page on any other site could submit a form to your dashboard and clear your failed jobs or delete a queue, as long as the browser it ran in could reach resque-web and was logged in to it. The fix is small and most teams can upgrade without touching anything.

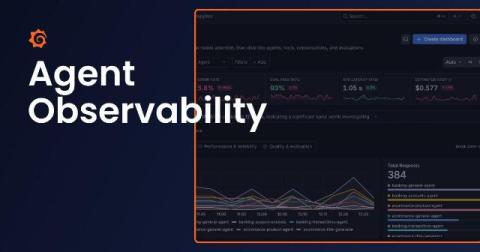
Agent Observability FAQ: Understand the value of monitoring, evaluating, and improving your AI agents

Agents have quickly become part of the tech landscape as organizations embrace AI across their businesses. But embracing agents also means embracing the monitoring best practices that have long been part of engineers' workflows: tracking performance, catching errors, and responding to incidents But it doesn't stop there. Agents also introduce new challenges.

Finding Why Payments Fail with VictoriaLogs Drilldown

Grafana’s Logs Drilldown is a point-and-click way to investigate logs without writing queries. Drilldown lets you break the logs down by service, label, pattern, or any other field, and narrow the selection one click at a time until the problem is in view. It’s a powerful tool, but it only works with Loki. So we built the same experience into the VictoriaLogs data source. We’re happy to announce that the VictoriaLogs data source for Grafana now ships with Drilldown integration.

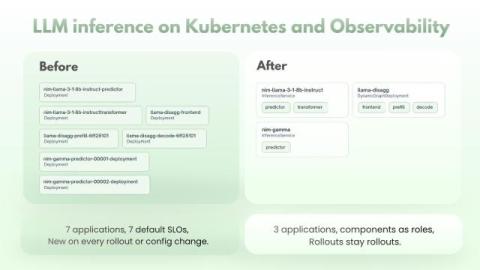
LLM inference on Kubernetes and observability

Running an LLM on Kubernetes is rarely just a Deployment with vLLM in it anymore. A whole layer of frameworks and operators has grown up for it: KServe, NVIDIA Dynamo, Ray Serve, Kthena, llm-d. Each one adds its own custom resource that describes a model deployment, with routing, autoscaling and the split of a model across pods built in, and each one turns that resource into ordinary Kubernetes objects in its own way.

Optimize Database Performance in Rails and ActiveRecord (Rails 8.1)

To optimize database performance in Ruby on Rails, fix N+1 queries with includes, preload, or eager_load; index the columns your WHERE and JOIN clauses filter on; load only the columns you use with select and pluck; batch large reads and writes with find_each and insert_all; and move to read replicas or sharding only once query-level fixes run out.

What Network Infrastructure Management Involves and How It Keeps Every Site Running

Why does the help desk still hear about network problems before the network engineers do, even with every router and switch under monitoring? In most cases the alert does its job, and the hours go into what comes after it. Tracking down who last touched the config takes time, and so does checking the switch's vendor support and how close that branch link is to capacity. Networks also no longer behave like a single system.

Nexthink Named a Leader in Forrester Wave DEXM Solutions 2026

Dear Nexthink community, Nexthink has been named a Leader in the 2026 Forrester Wave for Digital Employee Experience Management Solutions. I am incredibly proud to share this recognition with our customers, partners, and every Nexthinker whose commitment and ambition have brought us here. As a founder, this recognition is particularly meaningful.

Setting up Syslog in your Papertrail trial? Here's what to send your admin

Sending server logs to Papertrail over Syslog takes one setup command, and running it needs admin access: sudo on Linux, or Administrator rights on Windows. If you started a free trial but don’t have that access here are instructions to get your logs flowing. Copy your setup command, send it to a teammate who has admin access using one of the ready-made messages below, and your logs can be streaming in Papertrail within minutes of them running the script. This post walks you through those steps.

Monitoring Modernization: 6 Lessons for IT Leaders

Monitoring modernization doesn’t have to begin with a rip-and-replace project. For many IT teams, it starts with a specific need: better visibility, stronger historical context, more useful alerting, or capabilities their current tools simply don’t provide. From there, modernization can happen in stages.

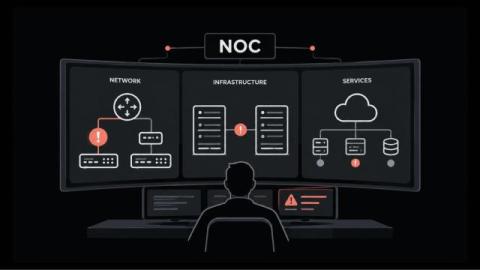
NOC Monitoring: What a Network Operations Center Tracks and How

NOC monitoring decides how fast a network problem turns into a fix. If your NOC watches the wrong layers, it misses the fault. If it alerts on everything, the real fault gets buried. According to Uptime Institute's Annual Outage Analysis 2026, 57% of operators said their most recent major outage cost more than $100,000. Most teams already collect plenty of data through network monitoring. The hard part is turning that data into a short queue of alerts that the right person acts on.

Monitor Oracle AI Database across clouds with Datadog

Organizations can use Oracle AI Database@AWS, Oracle AI Database@Azure, and Oracle AI Database@Google Cloud to run Oracle databases co-located with the cloud applications they support rather than managing the databases on premises. However, running applications in a cloud provider’s environment while hosting databases on Oracle Cloud Infrastructure (OCI) can lead to visibility gaps. When application performance degrades, identifying the source of the problem can be difficult.

Best practices for scaling A/B testing with experiment protocols

Running one A/B test well is manageable. Scaling A/B testing to hundreds of experiments across dozens of teams is harder, because teams may make different decisions about metrics, randomization, rollout, and analysis. Experiment protocols in Datadog Experiments turn an approved methodology into a reusable configuration, giving experiments of the same type a consistent starting point. In this post, you’ll learn how to.

Apache ActiveMQ CVE-2023-46604: DripDropper Exploit Explained

When a CVSS 10.0 vulnerability is published, the expectation is that affected software gets patched within days. When it involves an open-source broker that processes business-critical transactions in enterprise environments, the expectation is that the security teams responsible for those brokers treat it as an emergency. “The attacks exploit a maximum-severity security flaw in Apache.

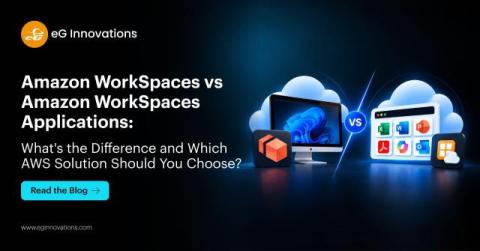
Amazon WorkSpaces vs Amazon WorkSpaces Applications: What's the Difference and Which AWS Solution Should You Choose?

If you’re researching AWS desktop virtualization and application delivery services, it is likely that you have come across Amazon WorkSpaces and Amazon WorkSpaces Applications. While the names sound similar, these two AWS services address different requirements. Amazon WorkSpaces provides a complete cloud desktop, while Amazon WorkSpaces Applications focuses on securely delivering individual applications through AWS-managed application streaming.

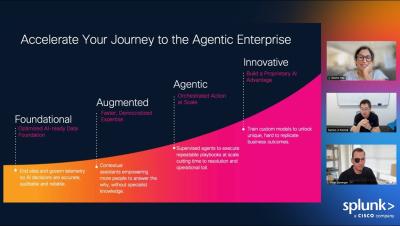
Welcome Keynote: Powering the Rise of the Agentic EnterpriseRise of the Agentic Enterprise

Join Jeetu Patel, Head of Product at Cisco, and Kamal Hathi, GM at Splunk, alongside a special guest, to see how organizations transform security, observability, and operations with AI workflows that are proven at scale. Discover how Splunk and Cisco bring unified visibility, trusted AI, and intelligent automation to help organizations.

Product Keynote: The Platform for Your Agentic Enterprise

The future of operations is predictive, unified, and AI-powered. Dive into how Splunk and Cisco help organizations unlock cross-domain insights at massive scale, provide intelligent context across security and observability, and build trust in AI with end-to-end visibility. Hear directly from product leaders on the latest innovations shaping agentic enterprises.

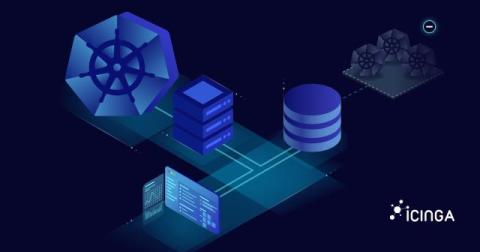
Removing decommissioned clusters from Icinga for Kubernetes

Clusters get retired. A test cluster is torn down, a workload moves to a new environment, a provider contract ends. Icinga for Kubernetes does not know about any of that. Since v0.3.0, several clusters can write into one shared database, and Icinga for Kubernetes Web shows them side by side. But stopping or uninstalling the daemon for a cluster leaves all of its data in place.

The October 20, 2026 Google Cloud europe-west2 Outage

Multiple Google Cloud services in europe-west2 (London) experienced service disruptions, elevated error rates, API timeouts and processing latency on October 20, 2026, according to Google's incident page. Google's preliminary incident report records the start at 23:00 US/Pacific on October 19, 2026 (06:00 UTC on October 20) and the end at 05:10 US/Pacific on October 20 (12:10 UTC) - 6 hours 10 minutes.

Grafana Campfire - What's New in Table & Text Panel - (Grafana Community Call - Oct 2026)

Join us for a Grafana Campfire on the New Text and Table panels. See how the redesigned Text editor lets you write and preview side by side, and how Handlebars templates, value mappings, thresholds and Mermaid diagrams turn your query results into rich, data-driven content. Then we’ll look at Table’s new ad hoc interactions (hide, filter and group, right in the table) and a first look at how Table works with Grafana Assistant.

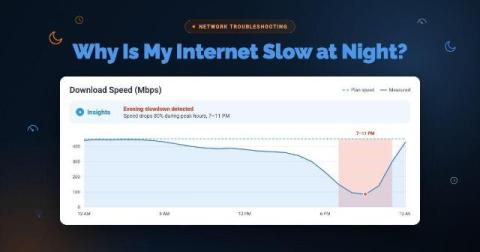
Why Is My Internet Slow at Night? 6 Causes and Fixes

Your connection holds up all day. Then, in the evening, video calls start to stutter, pages take longer to load, and file uploads slow to a crawl. By the next morning, everything is back to normal, so any test you run during the day comes back clean. For a business, that pattern shows up in a few ways. A remote employee can’t get through an evening call. A branch office’s nightly backup never finishes.

Powering Warp Factories with Sentry

Recently Warp introduced some new cloud software factories for setting up bespoke workflows and agents within your organization. The best part is that you can integrate Sentry directly into these factories. Whether you want to create an automated debugging workflow leveraging Sentry context or capture agent metrics for evals and performance data, Warp and Sentry have got it covered.

What's New in Scout: October 2026

October was about making Scout’s data easier for AI tools to use and easier for your team to trust. Scout is now in Claude’s connector directory, the MCP server got leaner and more careful about what it returns, and Scout Trails opened its beta. Anomaly Detection also became easier to read and better at catching short spikes. Here’s what shipped in October.

Meet Loom

When something breaks on a large network, the alerts arrive from every direction. Routers, firewalls, cloud gateways, and applications each report their own symptoms. The evidence that explains the incident is scattered across anomalies, configuration changes, topology, and past incidents, and an engineer has to piece it together by hand. Loom is the correlation and root cause agent in Selector Foundry, the agentic NetOps platform built on Selector’s existing AIOps and Observability platform.

Create Custom Visualizations | Introducing Grafana Pages | New from Grafana AI

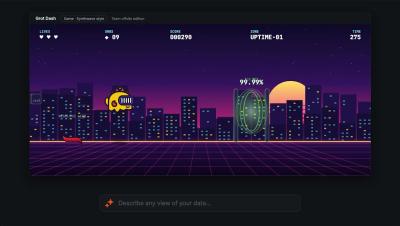
Grafana Pages is now in public preview in Grafana Cloud. Tell Assistant what you want it to see , and Pages builds it: a custom visualization, an app, a slide deck, or even a game. Pages are for the moments a dashboard can’t cover, like walking leadership through a launch, starting your day with a view of the services you own, or turning an incident into a story everyone can follow.

Optimize AI costs with Agent Observability

AI agent costs accumulate along more dimensions than a model-call count. Spend is a product of both which models you call and how the agent is architected: how many turns the loop runs, how many tools it invokes, how much retrieved context it carries, and how much of that context is re-sent on every turn. Provider bills tell you how much you spent, but they’re keyed to API keys and models instead of the applications and workflow steps that generated the calls.

How to Patch PHP2Shell Across Every Server and Prove Each Fix to Auditors

When a critical flaw surfaces in the language behind a large share of your web applications, how quickly can your organization name every server that runs it? PHP2Shell puts that question in front of every IT leader who runs PHP. The answer decides how long the business stays exposed. Here's the short version. PHP2Shell covers two flaws in the PHP engine, and either one lets an attacker run code on a web server with no login at all.

VMware Monitoring: Why Opslogix continues to be the right choice for you

In December 2021 we wrote VMware Monitoring: Why Opslogix is the right choice for you. At the time, vSphere 7 was new, Kubernetes was coming to vSphere, and the Log4j vulnerability was in the news. A lot has changed since then. vSphere 9 and SCOM 2025 are here, ransomware gangs now target ESXi hosts directly, and many organizations are reconsidering how they monitor their VMware estate.

Should you use a log or a metric?

Since Sentry added Logs and Application Metrics, there are now two ways to record that something happened in your app, and they can look pretty similar: Sentry.logger.info("user.signup") versus Sentry.metrics.count("user.signup"). Both store attributes, both include shared context automatically, and both can be filtered, grouped, and counted. So when you’re instrumenting your code, which one do you reach for?

What Four Leadership Circles Revealed About Operationalizing DEX

Earlier this year, I spent time with technology leaders across four major cities – San Diego, Boston, London and Dallas, as part of four Leadership Circles. Taken together, the conversations reinforced how far digital employee experience has matured for many organizations. The focus has shifted from understanding why DEX matters to exploring what it takes to operationalize its success. San Diego focused on the changing role of IT and the strategic case for DEXOps.

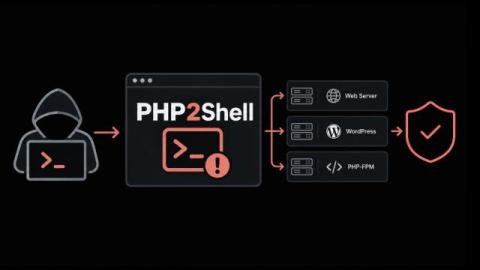
PHP2Shell: What the Critical PHP Vulnerabilities Mean for Your Servers

TL;DR On October 21, 2026, PHP released emergency patches for two critical flaws known together as PHP2Shell (CVE-2026-109618 and CVE-2026-109619). An attacker with no credentials can use them to run code on a PHP web server, in some cases with a single HTTP request. Upgrade to PHP 8.2.35, 8.3.36, 8.4.27 or 8.5.12 now. Then go through your logs, because exploitation attempts were recorded before the patch shipped. In this post.

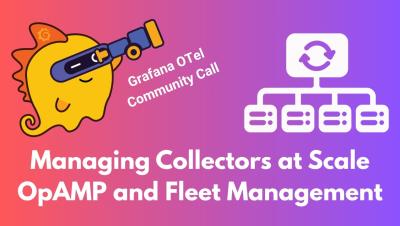
Managing Collectors at Scale: OpAMP and Fleet Management (Grafana OTel Community Call #11)

In this episode of the Grafana OTel Community Call, we're joined by Bejal Lewis and Paschalis Tsilias from Grafana Labs to talk about OpAMP, the Open Agent Management Protocol, and what it takes to manage OpenTelemetry Collectors at scale. We'll cover what OpAMP is and why fleet management matters, where the spec stands today (it's still pre-release), and what it was like building production tooling on top of it.
Featured Post

Monitoring CloudNativePG: What Changes When the Operator Owns Your Logs

Postgres operators like CloudNativePG (CNPG) have lowered the threshold for running highly available Postgres clusters on Kubernetes. Failover, replicas, backups, and rolling upgrades are handled by the operator, along with helpful niceties like automatic configuration of essential extensions. A few changes to a YAML manifest can provide a lot of value very quickly.

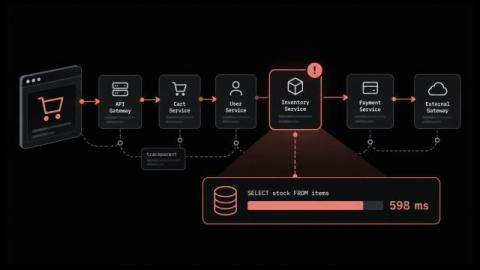
What is Distributed Tracing? How a Request Becomes a Trace

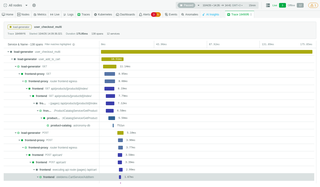
A checkout request leaves the browser and touches seven services before anything comes back. Seven dashboards light up. Every one of them reports a healthy number for its own service, and every one of them is telling the truth about a different slice of the work. Nobody measured the request. That gap is what pushed tracing in beside metrics and logs as a core signal of observability. In this blog, you will: By the end you will open a trace and say where the time went.

Introducing AI Observability: Trace Every AI Agent Request from Prompt to Pod

TL;DR Logz.io AI Observability provides end-to-end tracing for AI agents and LLM applications. Built on OpenTelemetry, it lets you trace every request from prompt to backend service, visualize multi-step agent execution, isolate root causes across models and infrastructure, and track token usage per step, all alongside your existing logs, metrics, and traces.

Scout Monitoring Is Now in Claude's Connector Directory

A customer messages support: checkout feels slow today. You open Scout, find the endpoint, open a trace, spot the query, copy it into Claude, and ask what’s wrong with it. Each step is quick, but together they add up to a lot of tab switching to answer one question. Scout Monitoring is now available in Claude’s connector directory. Connect it once and Claude can look at your production data directly.

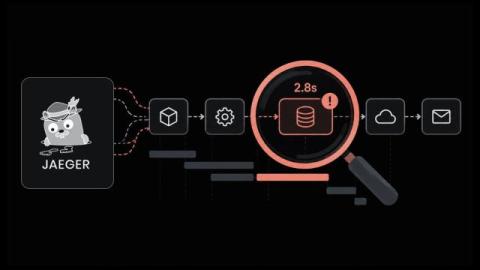
What is Jaeger Tracing and How does It Locate Slowdowns Across Microservices

Why does a checkout or login take several seconds when CPU and memory look normal on every server? In microservices, one click can travel through a long chain of components before the user sees a response. Any one of them can hold the request up, and server graphs won't tell you which. Logs show what each service recorded. Metrics give you averages. What's missing is the path one request took and the place it lost time, and Jaeger tracing records exactly that.

AppSignal MCP Is Now a Claude Connector

AppSignal MCP went generally available last month. Until now, adding it to the Claude app meant pasting our endpoint URL into a custom connector form. Now you search for it like any other connector. Open Settings, go to Connectors, select the Discover tab, and search for AppSignal. That's the whole setup. For more detail on each step, follow the Claude app section of the setup guide. It works the same way in Claude on the web and in the desktop app..

We just gave a million dollars to Open Source maintainers

The title is not a joke. For those of you who know Sentry, you know we’ve been giving back to Open Source maintainers since our early days in whatever ways we could. But around five years ago we really started to give in a more meaningful way. This year we increased our budget from $750,000 to $1,000,000.

Community Stories: Coroot at the Stanford University Libraries

Coroot was designed to solve the problem of time-consuming root cause analysis. It handles the full observability journey - from collecting telemetry automatically with zero code setup (thanks, eBPF!) to simplifying the role of SREs and DevOps everywhere with instant root cause analysis powered by AI. We also strongly believe that simple observability should be an innovation everyone can afford to benefit from: which is why our software is open source!

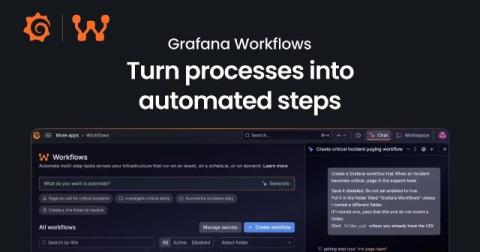
Spend less time on operational busywork and resolve incidents faster with Grafana Workflows

You're investigating checkout errors when someone asks who's coordinating the incident. Support needs an update, and another responder is looking for the runbook. You stop what you're doing to get everyone pointed in the same direction. They're all reasonable requests, but each one takes your attention away from understanding the problem. Yes, your team has a process for handling incidents, but carrying it out is another job for someone who's already busy.
Playing GIFs in the Icinga DB Web Service Grid: What It Taught Me About Icinga 2, Icinga DB and Redis

What happens when you treat the service grid like a screen. Every now and then a side project starts as one thing and quietly turns into something much sillier. Mine started as a way to get more comfortable with the Icinga 2 configuration. It ended with a question nobody asked: can the service grid in Icinga Web play GIFs? Spoiler: kind of. And on the way, I learned a lot about how Icinga 2, Icinga DB and Icinga Web work together.

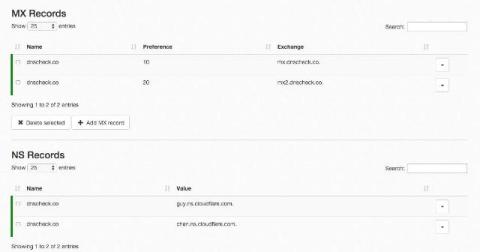
Monitoring the Monitor: When One of Our Uptime Vendors Went Quiet for 27 Hours

DNS Check watches its own infrastructure with several layers of monitoring, including DNS Check itself and third-party uptime monitoring services. One of those vendors polls a private health endpoint on our servers every five minutes, from probes around the world. That endpoint runs a set of internal checks (disk space, mail delivery, background job queues, DNS resolvers, and more) and returns an error if any of them fail. If it errors or stops responding, the vendor alerts us.

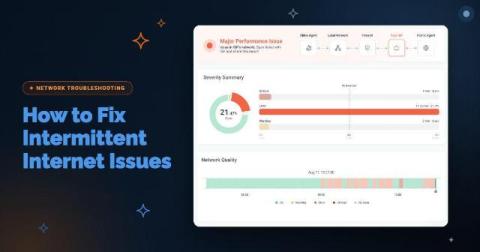
How to Troubleshoot Intermittent Network Issues After They Happen

One of the most frustrating challenges I faced as a network engineer was troubleshooting problems that had already disappeared. A user would call and report that an application was performing terribly. A site would become unusable for several minutes. Voice calls would break up. File transfers would suddenly slow to a crawl. Then, by the time I started investigating, everything would be working normally again.
Sponsored Post

When Vendor Support Ends, Your IT Monitoring Doesn't Have To

IT environments change. Technologies evolve, infrastructure vendors change their strategies, and sometimes support for a monitoring integration ends. For IT teams, that can create an immediate challenge: a previously monitored part of the infrastructure suddenly becomes a monitoring gap.

ObservabilityCON 2026: A guide to all the announcements from Grafana Labs

Today at ObservabilityCON 2026 in San Francisco, we unveiled a range of new Grafana Cloud capabilities designed to reshape cloud economics, bring richer context and deeper visibility across your systems and end-user experiences, and help teams move toward autonomous operations. Check out the keynote to learn more about the latest updates to the open agentic observability cloud, and read on for a quick recap of all the news from ObservabilityCON 2026.

From production problem to proposed fix: Implement autonomous operations with Grafana AI

You've just finished a deployment, and though your service is up, you start to notice some requests are getting slower. To address the lag, someone—or, more likely, some group of people on your team—needs to watch the dashboards, decide whether the change matters, investigate what happened, and turn the findings into a fix. At each step you're gathering context—and often explaining that context again to the next person or tool.

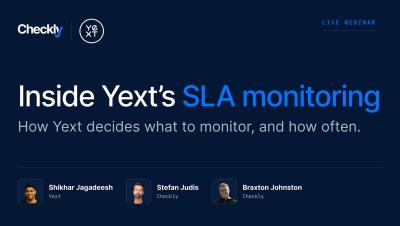
Build better SLOs with RUM and synthetic SLIs

Well-designed service level objectives (SLOs) help you track the benchmarks your app needs to meet to deliver a successful user experience (UX). To track performance against these SLOs, many SRE teams are turning to real user monitoring (RUM) and synthetic monitoring for their service level indicators (SLIs), as these forms of data provide more direct measurements of UX than backend performance metrics.

Our Limits Are Not Our Imagination

Yesterday, my partner told me about his new automated pipeline from a conversation recording to publication of a whole podcast, with social media blurbs and graphics and everything. It did more than he'd predicted the agent could do. "We are limited by what we can imagine," he said. Cheesy, but it kinda gave me goosebumps because it's (almost) true. Most of the experienced developers I know are concerned.

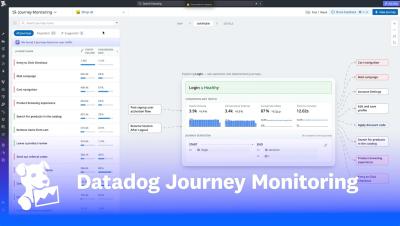
Automate Slack Support with Datadog Workflow Automation + Bits AI

Automate Slack support questions with Datadog Workflow Automation and Bits AI Agent Builder. Datadog Workflow Automation can now trigger directly from messages posted in Slack. In this quick demo, Yuta Yoshida, Product Manager at Datadog, shows how to build an automated support workflow that: → Detects new support questions in a Slack channel→ Sends questions to a custom agent built with Bits AI Agent Builder→ Replies directly in the Slack thread with an answer and relevant documentation.

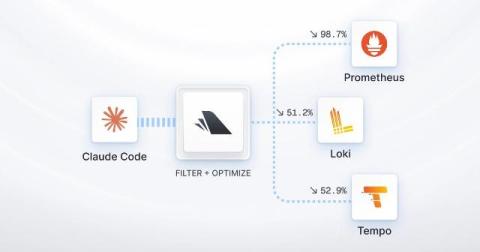
Telemetry Cost Management: Routing, Tiering, and Governance Without Blind Spots

TL;DR Cutting telemetry volume is only half of cost management. The other half is sending each signal to the right destination and storage tier, adjusting policies as traffic and incidents change, and rolling out every change in phases that teams can measure and reverse.

Service Mesh Observability: Istio, Linkerd and Envoy Metrics

Service mesh observability guide: the metrics Istio, Linkerd and Envoy proxies emit, what ambient mode changes, and why tracing still needs app changes. Sejal Pandey works on content and growth at Last9, writing about observability, reliability, and SRE practices.

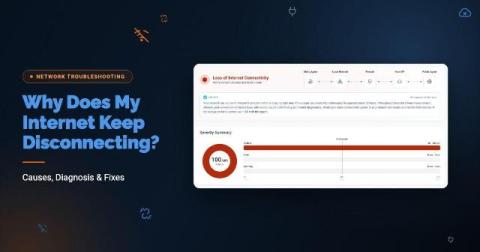
Why Does My Internet Keep Disconnecting? Causes, Diagnosis & Fixes

Your Internet usually keeps disconnecting because of one of five things: a weak or congested Wi-Fi signal, a failing modem, router or cable, an overloaded firewall, a device-level setting or driver, or a problem on your ISP’s line or network. To fix it, first find where the drop happens: on one device, across your LAN, or past your firewall. “The Internet keeps droppin” is one of the most common tickets IT teams get, and one of the hardest to close.

Managed DEX for Application Performance | Find and Resolve Issues Faster

See how Teneo Managed Digital Employee Experience (Managed DEX) helps IT teams identify the root cause of application performance issues and resolve problems faster. Teneo Managed DEX gives service desk and IT teams deeper visibility into application crashes, response times, hang time, wait time and user experience across different application versions. In this short video, see how Managed DEX can help teams.

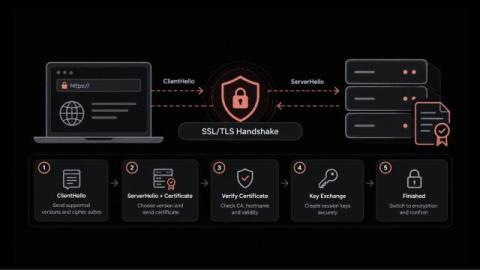
How to Troubleshoot TLS Handshake and Encrypted Traffic Issues with Packet Analysis

I remember the good old days, when troubleshooting application traffic often meant I could examine much of the conversation between a client and server in clear text. Not anymore. Today, nearly everything is encrypted. That is obviously a good thing for security and privacy, but it has also created a common misconception that packet analysis is no longer useful because engineers cannot see the application headers and payload.

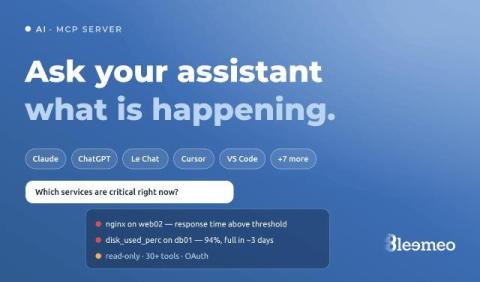
Ask Claude or Le Chat what is happening on your servers: the Bleemeo MCP server

The first minutes of an incident are spent asking questions a monitoring tool can answer but rarely in the form you asked them: which servers are in trouble right now, is it the same thing as last night, what did memory do on the web servers before it started? Each answer is a few clicks away, on a different page.

Managed DEX for Service Desk Optimization | Improve IT Support with Teneo

See how Teneo Managed Digital Employee Experience (Managed DEX) helps IT and service desk teams identify and resolve employee technology issues faster. By giving service desk engineers greater visibility into the digital employee experience, Managed DEX helps teams understand what is affecting users, investigate problems more efficiently, and move from reactive troubleshooting toward proactive IT support.

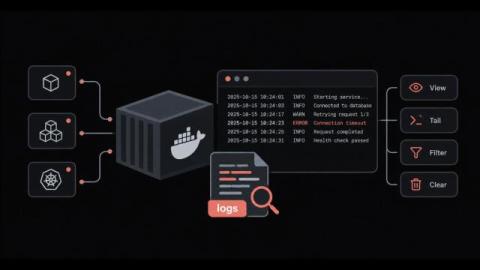
How to View, Filter and Manage Docker Logs Without Losing Them or Filling the Disk

Why does a container fail, restart and leave behind almost nothing useful when you go looking for the cause? Docker logs are the first place most engineers check during an incident, and they work well right up until the output goes missing. Sometimes it is buried under thousands of lines, and sometimes it is deleted along with the container. The docker logs command itself is simple. The difficulty comes from the settings around it, starting with the logging driver and where its files live on disk.

Observability Lessons NVIDIA and CoreWeave

The best thing that can happen to an open-source project is to find its way into some of the world’s largest technology companies. In September 2026, this happened twice in one week: VictoriaMetrics is now officially bundled in the self-managed edition of NVIDIA’s Cloud Functions, and I learned that CoreWeave is using VictoriaMetrics as the metrics backend for all of its infrastructure customers. Both companies adopted VictoriaMetrics independently.

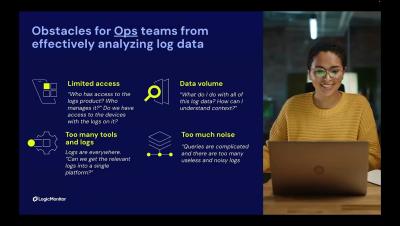
SNMP Traps as Logs and Network Troubleshooting | Logs for Lunch

SNMP traps as logs, AI log anomaly detection, and network troubleshooting are the focus of Logs for Lunch: August 2026, for network and IT ops teams and LogicMonitor users. Tom Chavez introduces LM Logs, which keeps logs and metrics together. Cameron Compton troubleshoots dropped tunnel packets from a network operations dashboard, and Ron Scinta ingests SNMP traps through the Collector. Patrick Sites and Kerry DeVilbiss answer questions on load balancing, OTel and Cribl forwarding, MSP log sources, and search performance.

Cloud Log Monitoring & Root Cause Analysis | Logs for Lunch

Cloud log monitoring in LogicMonitor connects a service alert to the log event behind it. This Logs for Lunch July demo is for ITOps, CloudOps, and SRE teams. Tom Chavez hosts Ismath Mohideen (Product Marketing) and Nick Doane (Senior Sales Engineer). They cover cloud observability and multi-cloud monitoring across AWS, Azure, GCP, and OCI in LM Envision, using cloud provider APIs with no extra collectors.

LM Logs Tips: Alert-to-Logs Workflow for Ops Team | Logs for Lunch

LM Logs troubleshooting starts at the alert. This Logs for Lunch session shows ITOps teams an alert-to-logs workflow and lesser-known LM Logs tips. Ryan Matuszewski demos a Tomcat application error. From the alert's Logs tab, he moves through log anomaly detection, All Logs, Log Patterns, and Log Analysis sorted by sentiment. He then opens the Logs page with the alert time range, and the same steps work for any alert type.

Autonomous IT: Data, Context, and Governed Action | 2H Announcement from LogicMonitor

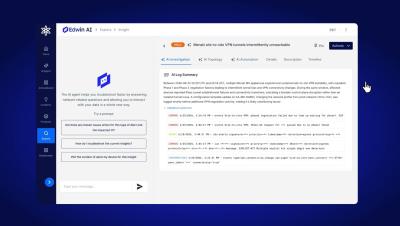
Autonomous IT requires three things: complete, AI-ready data; connected context; and governed action. In LogicMonitor's 2H announcement, we show enterprise IT and ITOps leaders how each layer works. LogicMonitor is the AI-first platform for Autonomous IT. This update covers the three layers behind autonomous IT operations as the category moves from systems of intelligence to systems of action. Your team decides when Edwin AI moves from recommending an action to taking it.

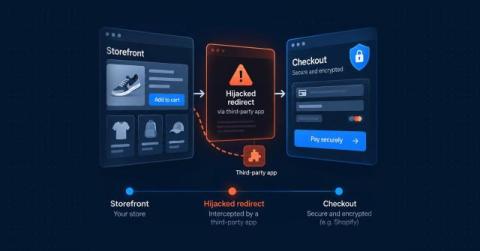
A secure Shopify checkout doesn't mean your entire store is secure

Recent Shopify checkout hijacking attacks reveal an important security risk that many online retailers may not realise exists: the difference between Shopify itself, the apps installed on a store, and the software customers interact with before reaching checkout. In this article In October 2026, customers visiting legitimate Shopify stores were redirected to fraudulent checkout pages designed to steal their payment details. The stores were real. The products were real.

6 improvements that make Grafana Assistant better at helping your workflows

When you ask Grafana Assistant to build a dashboard or investigate an alert, you're doing so because there's work to be done. To do that work effectively, you need the right data, changes you can inspect, and conclusions supported by evidence. You also want Assistant to avoid mistakes and act quickly. Over the past six months, our team has worked hard to improve what makes those outcomes possible.

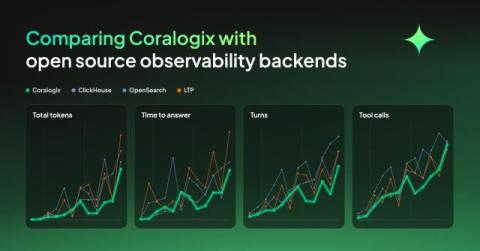
Comparing Coralogix with open source observability backends

We put the same OpenTelemetry data into four backends, Coralogix, ClickHouse, OpenSearch and a Loki, Tempo and Prometheus stack, then set an agent twelve questions against each one, from counting spans to working out what is wrong in a system it has never seen. Then we forced the agents to continue investigating until they got to the right answer. In this experiment, what separated them was the time, tokens, tool calls and turns it took to get there.

CI/CD Pipeline Observability: GitHub Actions, Jenkins and ArgoCD

CI/CD observability guide: the OpenTelemetry CI/CD conventions, tracing GitHub Actions and Jenkins runs, queue time, failure vs error, and deploy markers. Sejal Pandey works on content and growth at Last9, writing about observability, reliability, and SRE practices.

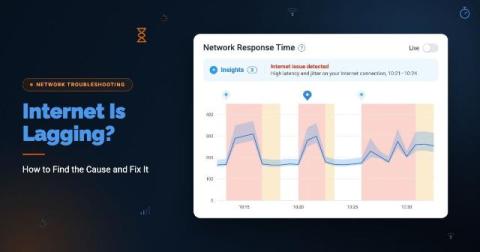
Internet Is Lagging? How to Find the Cause and Fix It

The speed test shows 500 Mbps. Yet Microsoft Teams calls keep turning into people talking over each other, the CRM pauses on every click, and remote employees are opening tickets because the Internet is lagging. Nothing looks broken, which is exactly what makes lag so hard to troubleshoot. Why is my Internet lagging? If your Internet is lagging, your connection is slow to respond, not necessarily slow to download.

Modal scales the next generation of AI with unified observability from Datadog

Modal is an AI infrastructure company rebuilding the cloud for AI, giving developers easy access to the compute needed to build and scale AI applications without managing the underlying complexity. Operating across more than 20 cloud providers and launching approximately 26 million containers daily, Modal relies on Datadog to unify observability across its infrastructure, applications, networking, and CI—helping its engineers detect 99% of incidents within five minutes, resolve 96% of issues before customer impact, and confidently scale one of the world’s most complex AI platforms.

MCP Server Monitoring: Tracing Tool Calls with OpenTelemetry

MCP server monitoring guide: spans, metrics and logs to record for tool calls, why failed tools look healthy, and how to trace requests from client to server. Sejal Pandey works on content and growth at Last9, writing about observability, reliability, and SRE practices.

FastAPI Shipped Three Breaking Changes in 21 Hours: What to Check

FastAPI released 0.146.0, 0.147.0, and 0.148.0 between Sunday afternoon and Monday morning (UTC), and each one is labeled a breaking change. None of them will crash your app on startup. They change what values your endpoints receive, which is the kind of change that passes CI and then shows up as odd data a week later. At Scout Monitoring, we monitor a lot of FastAPI apps, and a loosely pinned fastapi dependency is the most common way these releases will arrive.

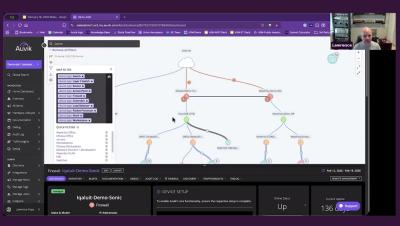
The Auvik Spring 2026 roadmap

Our Spring 2026 product roadmap is built around the idea that AI network management should start with what’s actually happening on your network, not a blank prompt. Over the past six months we’ve built Auvik AI into alerting, troubleshooting, the remote terminal, and Command Runner. We’ve also added, faster fixes for servers and workstations, and a ServiceNow CMDB integration. We walked through all of this, plus what’s coming next, in our Spring 2026 roadmap webinar.

How to Find and Recover Missed Backlink Opportunities

Building a strong online presence requires more than publishing quality content and hoping other websites will link to it. Backlinks play an important role in search engine optimization (SEO), helping search engines understand a website's credibility and relevance. However, businesses often overlook valuable opportunities to earn links from websites already discussing their brand, products, or expertise. Identifying and recovering these missed opportunities can strengthen SEO performance without requiring an entirely new content strategy.
Sponsored Post

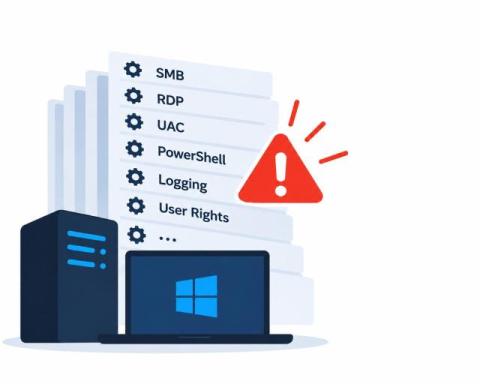
Windows Hardening & Continuous Compliance: Keeping 200+ Security Settings Secure 24/7

Every Operating System – not even counting the software installed on top of it – has a myriad of configuration settings that affect security. Windows Server alone has 4000+ configurable options, out of which 200+ are important for security & compliance efforts. They include: These settings are at the very core of all of your security & compliance efforts – and they are surprisingly often ignored.

Meet Artist

Every network team keeps a dashboard backlog. A war room needs a view of one incident. A service owner wants path health for a single application. An executive review needs business impact on one page. Each request becomes a ticket for the tooling team, and the view often arrives after the moment that needed it has passed. Artist is the dashboard agent in Selector Foundry, the agentic NetOps platform built on Selector Analytics.
CriblCon 26 Keynote highlights: Cribl StreamAI, App Framework, Marketplace, and Detect

This CriblCon 26 keynote highlight reel introduces Cribl’s AI platform for telemetry and highlights Cribl StreamAI, the Cribl App Framework, Cribl Marketplace, and Cribl Detect. It is relevant to IT, security, and observability teams exploring intelligent model routing, agentic app development, marketplace deployment, and security investigations using telemetry and context. The keynote also covers the SEC IT benchmark, the cost of investigating incidents with different AI models, and included inference for Cribl-native workloads.

Everything We Talked About at O11yDay London 2026

We just wrapped O11yDay London, and one theme ran through every session: writing code is no longer the hard part. Review queues, attention, operating agents in production, runaway token bills, and proving any of it is worth the money are where teams are getting stuck. The teams making progress are the ones who can see what's happening in production. Here are some highlights. We'll have videos available in the near future.

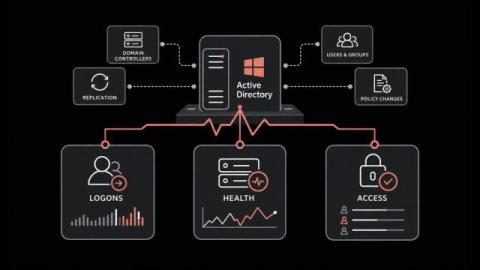
What to Monitor in Active Directory to Keep Logons Fast and Access Under Control

Why do logons crawl at one branch while headquarters is fine, or an admin group gain a member nobody approved, and no alert says a word? Trace any of those back far enough and you usually reach Active Directory. Since email, VPN, file shares and line-of-business software all lean on it for credentials, a directory fault rarely looks like itself and tends to show up as a network outage or a bug in some other application. Most of these faults creep in.

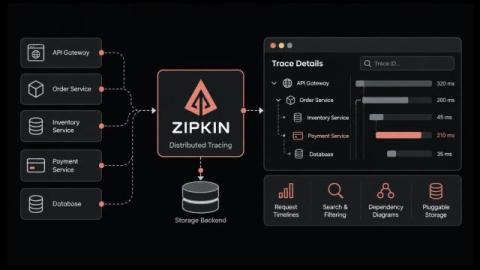
What is Zipkin and How does Distributed Tracing Speed Up Incident Resolution

If a checkout slows down or an API call fails, why can the cause stay hidden for so long while every service dashboard looks fine? One customer click in a microservices setup may hit a gateway and a few backend services first, then a queue or a database. Every hop logs its own events, yet none of those logs points back to the original request. Distributed tracing was created to solve exactly this. Zipkin arrived early, as one of the first open-source tracers.

Lessons Learned on the Journey Zero Disruption: How to Build Buy-In Across the Organization

Operationalizing digital employee experience is not about implementing another technology platform or launching another transformation project. It is about embedding new capabilities into the way IT and eventually the wider organization identifies problems, manages change and improves the employee experience. That cannot happen through implementation alone.

Scout Trails Is in Beta: See What Your AI Coding Agents Are Doing

session start tool call tool call cost outcome AI coding agents have quietly become part of most engineering teams. They open files, run commands, call tools, and push changes, often for hours at a time. Yet when you want to know what an agent actually did, the answer usually lives in one developer’s terminal history, and it disappears when that session closes.

Go, Logs and the Engineering Behind VictoriaLogs Performance

What actually makes a logging system fast? That was the question behind Tech Talk. And if you were expecting the answer to be a collection of clever Go optimizations, Jesús Espino, Principal Engineer at VictoriaMetrics, made an important point pretty early in our conversation: A huge part of VictoriaLogs’ performance comes from architecture and data structures. The micro-optimizations come later. Now that gave my Tech Talk partner in crime, Mathias Palmersheim, and me plenty to dig into.

What Is Observability? It's More Than Metrics, Logs, and Traces

Modern systems, due to their distributed nature, rarely fail in simple ways. A request might pass through an API gateway, several microservices, a database, a message queue, and a third-party service before a response ever reaches a user. When something slows down or breaks, knowing that something is wrong is only the beginning. You need to figure out.

Splunk Observability Cloud and Ansible Automation Platform - How to Remediate Alerts with Ansible

Close the AIOps loop with Splunk Observability Cloud and Red Hat Ansible Automation Platform. Explore how OpenTelemetry and Event-Driven Ansible turn alerts into automated fixes, reducing manual firefighting and speeding up incident resolution.

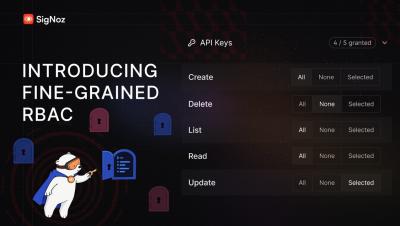
Introducing Fine-Grained RBAC: Resource-Level Permissions in SigNoz

A quick demo of fine-grained access control in SigNoz, using dashboards as the example. We’ve built one of the most advanced access control models in the observability space. See how to define exactly who can access each individual dashboard.

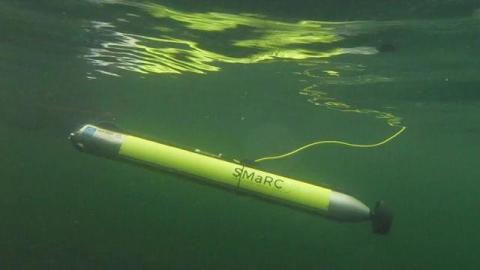
Debugging an Autonomous Underwater Vehicle with Tracealyzer

By Max Johansson, Vehicular Systems, Linköping University An AUV shown for illustration. Photo by Swedish Maritime Robotics Centre (SMaRC). At KTH, the Swedish Maritime Robotics Centre (SMaRC) is continuously developing an autonomous underwater vehicle (AUV) as a research platform for studying underwater environments. The AUV has traditionally been powered by batteries, but adding a fuel cell can extend its operating range.

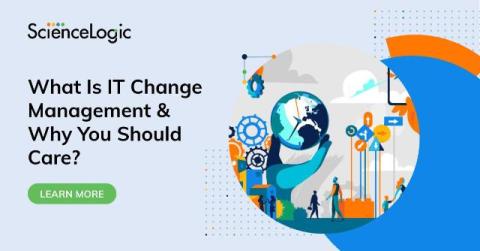
What Is IT Change Management? Process, Types, and Best Practices

Last updated: Oct. 15, 2026 IT environments change constantly. The challenge is making those changes without creating unnecessary risk, outages, or delays. IT change management, called Change Enablement in ITIL 4, helps teams assess, authorize, implement, validate, and learn from changes that could affect an IT service. The goal is not to slow delivery. It is to improve change success while reducing disruption, recovery time, compliance risk, and impact on critical business services.

Use less AI and show your effort in contributing to the OTel project

Using more AI and adding lots of contributions, but not understanding the project, will not scale long-term. OpenTelemetry, like other OSS and cloud native projects, is looking for contributors who care about the ecosystem and genuinely want to learn and support the project. Resources for Further Learning.

Coverage-first or cost-first: two ways to automatically apply Adaptive Metrics' recommendations

Adaptive Metrics , which is part of the Adaptive Telemetry suite, looks at how your metrics are actually used and recommends how much detail you should keep for each metric. This helps you cut costs while still retaining the data you actually need. Last year we added auto-apply capabilities that let you implement those recommendations automatically, but only with coverage-first behavior, maximizing coverage of whatever you're querying.

Get observability in your pocket with the Grafana mobile app

When you’re on the go, your phone is often the only observability tool you have. And what you can do with it in the first few minutes matters. With the incredible innovation that has gone into mobile CPUs, GPUs and displays, a phone is a powerful device where you can immediately see what’s happening and start acting on it. And the Grafana mobile app now allows you to both see and act.

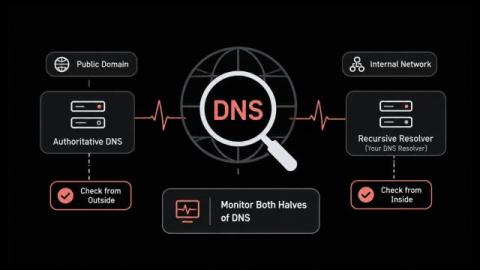
DNS Monitoring: What to Track and Where to Watch It From

DNS monitoring asks your name servers the same question on a timer and checks the answer that comes back. Most teams aim it at their public domain and stop there. That covers half the problem. Your public domain and your internal resolver fail in different ways. A check from outside the building never sees the second one. In this blog, you'll see: By the end you'll know which half of your DNS nobody is watching. A DNS check sends a query and reads the reply. The reply can fail three ways.

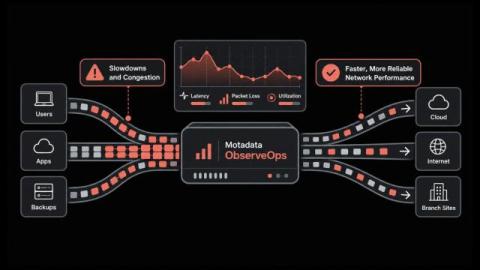
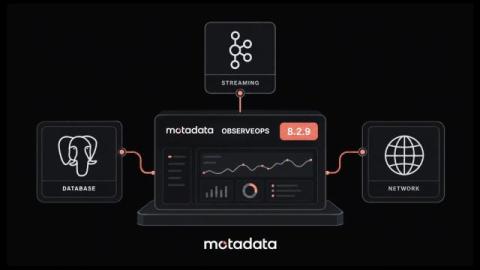
What's New in Motadata 8.2.9 as ObserveOps Expands Database, Streaming and Network Coverage

How often does a lagging replica or a bad network link reach users before your monitoring flags it? The problem grows when every layer has its own tool. Warning signs then show up in different places, often too late to act on. Motadata 8.2.9 came out on October 5, 2026, with eight updates to Motadata ObserveOps. Four of them focus on the network. The other four deal with databases, data streaming, alerting and SEBI compliance reporting. A few add support for technologies Motadata did not cover before.

How Kubernetes DRA can improve GPU utilization and cut costs

Organizations are spending more on GPUs as they move AI workloads into production, and improving GPU utilization is a key priority. But Kubernetes’s legacy device plugin model can limit those improvements because it constrains how workloads request and consume GPU resources. Teams must configure GPU partitioning before workloads are scheduled. Resource requests cannot distinguish GPUs by capability, and a workload can reserve an entire GPU while using only part of its capacity.

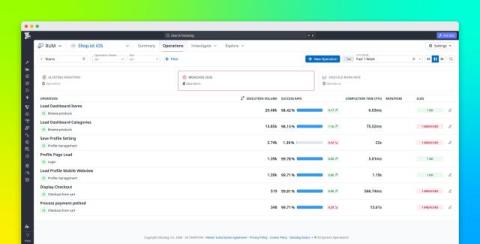
Monitor the performance of critical steps in user journeys with RUM operations

Frontend and mobile applications depend on technical steps that users expect to work in every user journey: loading search results, signing in, saving a payment method, or processing a payment. Datadog Real User Monitoring (RUM) captures detailed events about these interactions, including views, actions, resources, and errors. But examining those events individually does not always provide a direct answer to more fundamental questions: Did a critical application step work, and how long did it take?
Best AI Observability Tools of 2026: Monitoring the AI You Build and the AI That Runs Your Ops

TL;DR “AI observability” now describes two different jobs. One is watching the LLM apps and AI agents your team ships: prompts, tool calls, token spend, and output quality. The other is putting AI agents to work on your production telemetry so incidents are already being investigated by the time an engineer logs in. Most engineering orgs in 2026 need both, and very few tools cover the two well.

What Are AI Agents? How They Work, Why They Matter and Why They Need Governance

An AI agent doesn’t just answer questions—it takes actions in real systems. As teams across the enterprise build their own agents, governance can’t be an afterthought. Learn how agents work, why they create new risks, and what controls are needed before they act, not after.

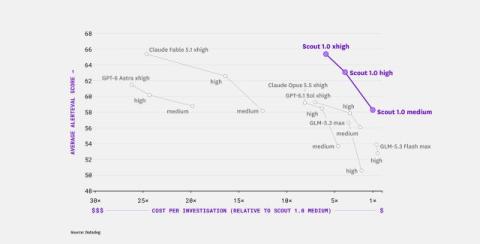
Introducing Scout 1.0: A new SRE model powering Bits AI with frontier performance at a fraction of the cost

Today, we’re introducing Scout 1.0, Datadog’s first AI model specialized for investigating production issues. Scout powers Bits Investigation, our AI SRE. We trained Scout to reduce inference cost so that investigations are cheap enough to run an order of magnitude more often and earlier in an incident’s lifecycle. Key highlights include: Close dialog.

Honeycomb Adds Another AWS Competency: Resilience Technology

We're excited to share that Honeycomb has achieved yet another Amazon Web Services (AWS) Competency—the Resilience Technology Competency—which recognizes our ability to help customers detect, investigate, and recover from failures in production systems running on AWS. While receiving the competency designation is a fantastic recognition of the capabilities of the Honeycomb platform (we also received one in Financial Services earlier this year), it's ultimately not the point.
AI Agents Are Becoming Part of the IT Environment. They Need to Be Managed That Way.


Agent Studio for Edwin AI gives administrators one place to see which agents are available, understand what each one does, control which agents are enabled, and manage their access to MCP tools. See how Agent Studio brings clearer administration and governance to agentic IT operations.

Introduction to Digital Experience Monitoring with Grafana Cloud

Digital Experience Monitoring (DEM) in Grafana Cloud combines frontend observability, synthetic checks, and session replays with backend telemetry to give engineering teams an end-to-end view of customer experience. In this video, Senior Developer Advocate Marie Cruz gives an overview of DEM and a deep-dive demo of how it works in Grafana Cloud.

Monitoring as Code with Icinga: Approaches, Tools and Trade-offs

Monitoring as code means defining hosts, checks, thresholds and notification rules in version-controlled files, and deploying them through review and automated validation, the same way infrastructure as code handles servers and networks. With Icinga you can do this with plain configuration files in Git, the Ansible collection maintained by NETWAYS, the Puppet modules maintained by Vox Pupuli, the Icinga Director, or the REST API from tools such as Terraform.

The October 13, 2026 Microsoft 365 Global Secure Access Outage

Some users in Germany and the United Kingdom who reach Microsoft 365 through Global Secure Access (GSA) may have been unable to use Outlook, Outlook on the web, OneDrive, SharePoint Online, Microsoft Teams and Windows 365 Cloud PCs on October 13, 2026, according to Microsoft's service health updates as recorded by IncidentHub. Microsoft's final update records the start at 07:40 UTC and the end at 18:31 UTC the same day - about 10 hours 51 minutes - and narrows the geographic scope to Germany only.

Introducing Migration Benchmarks: every source we timed now converts in under an hour

The Coralogix migrations team has published what it measured. Since 2023 the team has moved more than 75,000 assets across 300+ migrations and onboardings, including a single migration of about 41,000 alerts. The new Migration Benchmarks page holds the figures by source, a calculator for your own migration and the causes of delay that post-migration reviews name most.

October 2026 at Bindplane: First-class Gateways, three new destinations, and a three-tab Overview

Gateways are now a named resource in Bindplane with their own page, a guided setup, and a one-step migration for anything already running the Bindplane Gateway source. Around that we added destinations for CrowdStrike Falcon Next-Gen SIEM, Arize AX, and Arize Phoenix, gave the Overview page a third tab. Prefer to watch? The October Community Call is streamed live on YouTube. Watch " YouTube" on YouTube Watch.

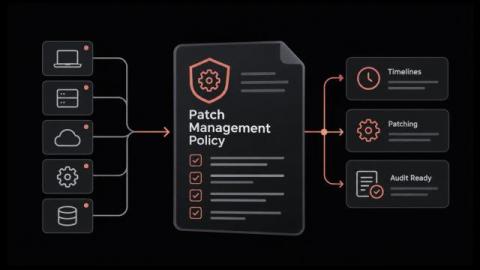
What a Patch Management Policy Should Contain to Keep Systems Secure and Audit-Ready

Who decides how fast a critical patch goes out, and who signs off when a production server can't be restarted? For many IT groups, the answer is a mix of one senior admin's judgment, an old ticket and a shared spreadsheet. It holds up fine right until an auditor asks for proof, or that admin leaves. A written policy replaces that guesswork with rules people have agreed to. Owners are named, deadlines are fixed, and there's a plan for the system that can't be patched on time.

Sentry's Flutter SDK 10.0: Streaming Traces and More Accurate Crash-Free Rates

Sentry’s Flutter SDK 10.0 makes streaming traces the default and changes how unhandled Flutter errors affect Release Health. Errors that leave your app running no longer mark the session as crashed, so your crash-free rate better reflects actual app crashes. The release also gives app startup its own trace on Android and iOS, simplifies logs and metrics setup, expands Dio network error capture, and respects Flutter’s sensitive-content markings in Replay and screenshots.

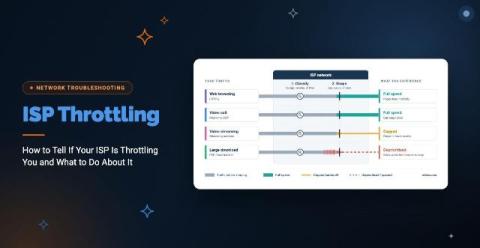
ISP Throttling: How to Tell If Your ISP Is Throttling You and What to Do About It

Your connection is fine in the morning and crawls every afternoon. Or video calls stutter while everything else loads normally. Either pattern could be ISP throttling. It could also be network congestion, or a problem inside your own network. ISP throttling is when your internet service provider intentionally slows your connection based on how much data you use, the type of traffic you send, the time of day, or the plan you’re on. Knowing throttling exists is the easy part. Proving it is harder.

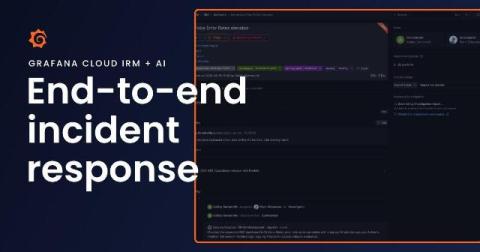
Go from alert to post-incident review with Grafana Cloud IRM and AI

You’ve got 10 minutes before your next meeting when your phone starts ringing. You’re being paged because the frontend is erroring with failed API requests. You open one tool to see what fired, then another to figure out what’s going on. You message a teammate in Slack to see if they’re noticing the same thing. That’s a lot of context switching, and it’s still how a lot of teams' incident response works today. Opening another tool and catching someone up takes time.

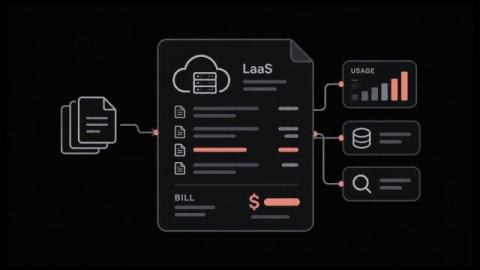
Logging as a Service (LaaS): What It Costs and When It Fits

Logging as a Service moves your log management to a provider. They collect, parse, store and search your logs for a monthly fee. The fee is where it goes wrong. Providers meter five different things, and the one written into your contract decides whether ordinary growth doubles your bill. In this blog, you'll see: By the end you'll know which meter your workload lands on. Logging as a Service is a cloud-delivered model for collecting and searching logs.

SAP Security Patch and Vulnerability Monitoring Guide

Avantra monitors SAP security patch status across entire landscapes, checking each newly published SAP HotNews note against every managed system and tracking which systems still need it. It covers the patch side of SAP vulnerability management, which is a different job from code-level vulnerability scanning.

RISE with SAP Shared Responsibility: Security Monitoring Guide

Avantra handles RISE with SAP security monitoring for the layer that stays with the customer under the RISE with SAP shared responsibility model. SAP operates the infrastructure, network, database, and operating system, while the customer still owns application configuration, users and authorizations, custom code, and requesting the SAP Security Notes that SAP doesn’t apply proactively.

The Business Side of Observability: Ramazan Karadavut on Customer Value and SolarWinds

In this episode of SolarWinds World Tour Conversations, we sit down with Ramazan Karadavut, Founder & Senior Architect at Consolit, to discuss his 20-year journey with SolarWinds and the power of end-to-end IT management. We explore real-world enterprise use cases, including monitoring large-scale banking networks across 10,000+ branches, and thousands of ATMs. We will also explore why moving beyond basic alerting into inventory management, change management, and investment reporting is essential for complex environments.

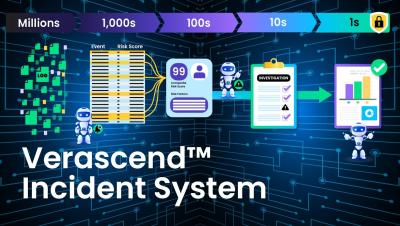
Graylog Verascend Incident System Overview

Verascend Incident System Graylog's agentic layer that turns correlated, risk-scored alerts into verified incidents. Graylog’s Verascend Incident System turns risk-scored alerts into verified incidents before analysts open a case. Alert fatigue is a math problem. Tuning is a workaround. Verascend combines risk-scoring, event consolidation, and two AI agents to confirm which correlated events are real incidents, automatically, before an analyst ever opens a case. Analysts investigate. They don’t filter.

Why 40% of Your Engineering Budget is Completely Wasted

Is up to 40% of your engineering capacity trapped just maintaining legacy systems while leadership demands an AI-first roadmap? Discover how Infrastructure Portfolio Management through Clarity by Broadcom (part of ValueOps) allows enterprises to reclaim trapped infrastructure capacity and redirect resources toward AI innovation. By connecting cores and clusters directly to measurable business outcomes, VCF Advanced Infrastructure Portfolio Management transforms your private cloud into a self-funding engine.

Building an AI Assistant That Actually Understands Your Incidents

When production breaks, the clues are everywhere but the story is scattered. RUM sessions, APM traces, metrics, and logs allow Datadog to tell you part of the story. What’s missing is your service ownership quirks, your team's conventions, or the three-year-old workaround buried in a comment that explains why a certain endpoint behaves the way it does.

Accelerating Resolution with Autonomous Incident Response v1

Incident response often spans a patchwork of tools, handoffs, and manual steps. An engineer gets paged, a team investigates the issue, the incident commander coordinates the response, SREs document decisions, and somebody (anybody!) writes the postmortem. Every handoff introduces more context switching, increasing the risk of critical information loss, and ultimately slowing resolution.

Grape's error! Inside a Transaction Commits Your Data. Grape 4.1 Fixes It.

If your Grape API calls error! inside an Active Record transaction, the client gets an error response and the database keeps the writes. No exception, no warning, no rollback. The request looks failed from the outside and succeeded on the inside. A fix merged into Grape on October 3 and is queued for Grape 4.1.0. It’s not released yet, so every current Grape version still behaves this way. Here’s why it happens, how to check whether you’re affected, and what changes when 4.1 ships.

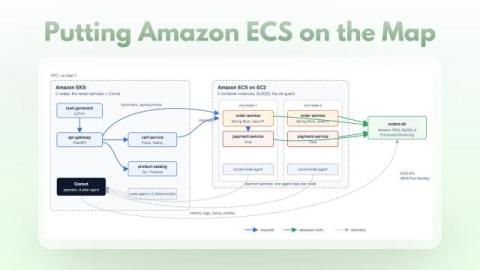
Putting Amazon ECS on the map

Say "ECS" and most people picture serverless containers: no nodes to manage, and nothing underneath you are allowed to touch. For an eBPF-based agent that is a dead end. There is no host to run on, no privileged containers, no kernel to attach to. But ECS is not always serverless. With the EC2 launch type you bring the nodes and ECS brings the scheduler: task definitions, services, rolling deployments, daemons, placement.

We Upgraded SigNoz Infrastructure Monitoring for Deeper Visibility and Faster Troubleshooting

A quick walkthrough of the new infrastructure monitoring experience in SigNoz Cloud. We’ve made several additions to give you more visibility into your infrastructure health and help you troubleshoot faster. Here’s what’s new,

Dismantling Datadog's Monolith with Agentic AI - Developer Track

AI can write code, but how does it do with a large, organically built codebase with years of development? Datadog’s monolithic webapp had significant scale and support challenges, so we knew the time had come to break it up. But when the code has been written, revised and tweaked so many times (as we keep adding new features and capabilities), by so many teams, that becomes much harder.

VictoriaLogs Has Now a Long Term Support (LTS) Release

VictoriaLogs now runs in production everywhere, and many teams running it have told us the same thing: everyone wants new features, but it’s hard to keep upgrading their logging backend every few weeks. They want the mix of stability and up-to-date security that only LTS releases can satisfy. We’re happy to announce the first Long Term Support (LTS) release of VictoriaLogs: v1.52.1. This is the start of a new v1.52.x LTS line.

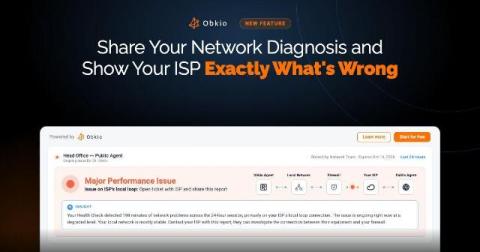
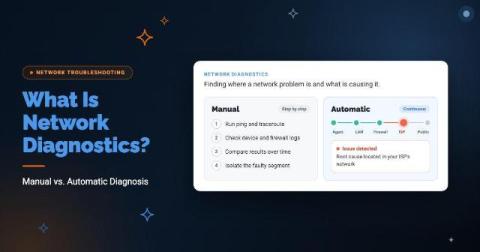
New in Obkio: Share Your Network Diagnosis and Show Your ISP Exactly What's Wrong

You know the conversation. Calls are choppy, users are complaining, and Obkio shows packet loss on the path to your ISP. You open a ticket, and they reply, "Everything looks fine on our end." Now you're stuck taking screenshots, exporting graphs, and trying to explain data to someone who can't see it. Meanwhile, the problem keeps happening. Today we're launching Shareable Links. With one click, you can create a read-only link to any Network Monitoring Session and send it to anyone.

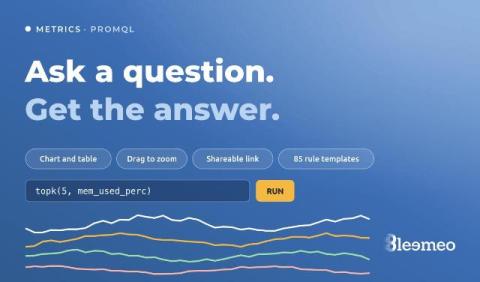
When you have a question, not a dashboard to build: the Metrics explorer and recording rule templates

Dashboards answer the questions you knew you would ask. The other kind — “is it only this server, or all of them?”, “since when?”, “what does memory look like on the ones that restarted?” — used to start with creating a dashboard, adding a widget, picking a metric, and deleting the whole thing afterwards. Bleemeo now has a page for those questions. It is called Metrics: you write a PromQL query, run it, and look at the answer.

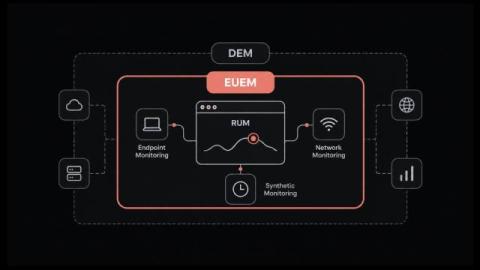
What is End User Experience Monitoring (EUEM)? How It Relates to RUM and DEM

Why do tickets about a slow application keep arriving while every server, link and service check reports normal? That mismatch is the problem end user experience monitoring exists to solve. A healthy server is one thing, but the business notices something else: whether people can finish their work or complete a purchase without delays or errors. Monitoring in most IT operations groups was built to watch the systems from the inside, so it reports CPU load, memory and uptime.

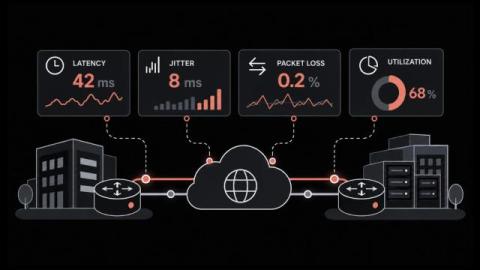
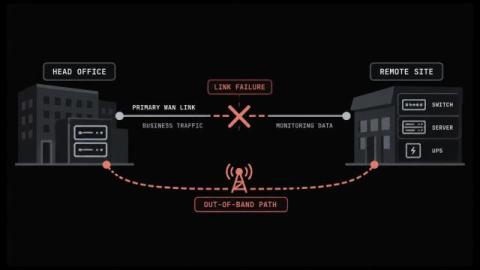
WAN Link Monitoring for Faster Branch Troubleshooting

Why do users at a branch complain about choppy calls and stalled apps when every WAN circuit on the dashboard still shows up? A link can be reachable without being healthy. Delay and packet loss can rise for hours on a live circuit, and a simple up-or-down check will report nothing unusual the whole time. WAN link monitoring checks the quality of each site-to-site connection by having routers send their own test packets and time the replies.

How Do You Review 10x the Code? You Don't - Developer Track

AI is generating code at 10x human speed, but we’re not shipping software 10x faster. Agents have a quality problem, and we still can’t trust their output without validation. Breaking the code review model didn’t help. So what would it take to autonomously ship code that’s actually trustworthy? Join us to explore what an agentic harness looks like when the SDLC is the harness, a validation system that spans intent, CI, staging, and production, with context flowing bidirectionally between all stages.

Datadog San Francisco Summit: Keynote

Datadog has always been driven by a broader vision of helping teams understand and operate complex systems. In this session, you'll hear from Michael Whetten, Senior Vice President of Product Management, and Cansu Berkem, Director of Product Management, as they share the latest updates across the Datadog product suite and discuss how that vision continues to shape the platform's evolution and support the next generation of AI-driven applications.

How Datadog defines service criticality at scale

Datadog runs thousands of internal services and has been increasing global footprint year after year. For most of that growth, we treated services uniformly when making deployment and reliability decisions. At our current scale, that approach became expensive. A change destined for production rolls out to data centers sequentially, so deployment time grows with every data center we add.

SFTP vs TFTP: Differences and Security

SSH File Transfer Protocol (SFTP), also known as Secure File Transfer Protocol, and Trivial File Transfer Protocol (TFTP) have similar acronyms but have two different jobs. Choose SFTP for sensitive files, routed or untrusted networks, authenticated automation, partner exchange and remote file management. Reserve TFTP for constrained bootstrapping or device-transfer workflows on a tightly controlled network when the endpoint requires a minimal design.

The Root Cause Agent: Bring an agentic approach to observability

For years, engineering teams have faced the same challenge during incidents: the systems generating alerts are becoming more complex, but the investigation that follows is still largely manual. Monitors are good at telling us that something is wrong. The harder question is why. When an alert fires, an engineer still has to work out where to look, which signals matter, what hypothesis to test, and how the evidence across logs and metrics fits together.

Introducing DojoAI Credits: Flexible, predictable AI pricing built for scale

AI agents are quickly becoming the first responders on the most sophisticated SecOps and DevOps teams, pulling threads on a threat or making sense of a flood of telemetry before a human even logs in. But most AI pricing hasn’t caught up. Token-based models leave you burning through usage with no visibility into what’s driving the cost, while per-seat caps ration access like AI is still a nice-to-have instead of core to how your team operates.

Democratizing Incident Response with AI at Riot Games - SRE Track

Senior engineers are the pillars of SRE programs—not only do they have the leadership to manage incidents well, they also have the tribal knowledge to understand the technical causes of tricky issues. But when the know-how is confined to a few individuals, it greatly limits the effectiveness of your SRE team.

RUM Metrics That Matter for User Experience and Revenue

Why does a page that scores well in testing still draw complaints from customers about slowness? A lab test runs on one fast machine over a stable connection. Customers use older phones, congested mobile networks and browsers loaded with extensions, so their experience can only be measured on their own devices. Real user monitoring captures that experience, and it produces a long list of measurements.

How Alert Suppression Pauses Alerts During Planned Work Without Losing Visibility

How many pages did your on-call engineer get during the last planned firmware upgrade on a core switch? The device stops responding and every dependent check fails. Soon the on-call phone is buzzing with alerts for a change that was approved last week. Alert suppression is a time-limited pause on alerts for a condition you already know about, such as planned work or an issue under investigation. And what is alert suppression from the engineer's side of the console?

Agentic AI Is Becoming the Enterprise's Connective Tissue. Governance Has to Move Into the Flow.

McKinsey's 2026 tech report calls agentic AI the 'connective tissue of the enterprise.' But agents that act at machine speed need governance at machine speed too. Static controls won't work for dynamic agents—active, in-flow guardrails must run before the action, not after.

Ask Your Logs: The AI Assistant Comes to Papertrail

It is 2 a.m., and something is wrong. The answer is somewhere in your logs, but finding it means guessing keywords, remembering search syntax, and scrolling through thousands of lines. Your systems keep growing, so you have more data than ever and less clarity when it counts. Today, we are bringing the AI assistant, the SolarWinds in-product AI agent (also known as SW1 in earlier previews), to Papertrail. Ask your logs a question in plain English and get an answer, with a link back to the evidence.

How to Fix Packet Loss: Step-by-Step Troubleshooting Guide

Packet loss rarely shows up as packet loss. Users report choppy Teams calls, frozen screen shares, slow SaaS apps, or a connection that feels unstable. By the time the ticket reaches IT, the issue has often cleared. Even small amounts of loss degrade real-time traffic. And because TCP retransmits every lost packet, sustained loss also cuts throughput for everything else on the link. Packet loss happens when data packets fail to reach their destination.

VictoriaMetrics September 2026 Ecosystem Updates

Another month whooshed by, bringing a slew of updates: 3 vmanomaly and 2 VictoriaMetrics releases, and new versions of vmestimator, VictoriaTraces, and our first ever LTS release of VictoriaLogs. This brings 12 months of stability to VictoriaLogs Enterprise users. But the big one was the launch of VictoriaTraces on VictoriaMetrics Cloud. Finally, we can offer a complete managed observability stack with metrics, logs, and traces. We run it, you use it. This ecosystem update includes.

The October 8, 2026 Google Cloud Storage Outage

Google Cloud Storage in us-central1 (Iowa) had elevated latency and error rates on upload and write operations on October 8, 2026, and a smaller subset of reads was also affected, according to Google's incident page. Google records the start at 11:00 UTC and the end at 23:30 UTC the same day - 12 hours 30 minutes. The outage report - fetched on October 12, 2026 - includes a preliminary incident report as of this writing.

Vulnerability Management and the Risk You Cannot Patch This Weekend

✓ operational truth Operational risk is no longer limited by the ability to find vulnerabilities. It is limited by the ability to prioritize them by business exposure and to act on the large share that cannot be patched at all. Autonomous IT changes this by mapping findings to applications and owners, automating the work around the patch, and proposing evidenced mitigations where no patch exists.

Best Log Management Tools in 2026 [35 Analyzed]

Summarize with ChatGPT Claude The best log management tools are Hyperping for logs attached to the incident your uptime or log alert opened, Better Stack for low per-GB log prices, Datadog for logs next to APM and infrastructure, Grafana Cloud Logs for Loki and LogQL, Axiom for high log volume on a small bill, New Relic for 100 GB a month free, SigNoz for OpenTelemetry with a self-hosted option, and Sentry Logs for logs next to the errors you already track. I analyzed 35 products and shortlisted eight.

The recovery playbook every IT team needs to get ahead of downtime

Most downtime doesn't come from problems your team can't solve. It comes from problems they've already solved sitting in a runbook or a text file, waiting for someone to run the fix manually. The fix is documented, and the steps are proven, yet the recovery still takes 40 minutes because a human has to log in and type it out. Workflow automation exists specifically to close that gap: The fix runs the moment the alert is triggered, not when someone sees it.

Elastic Introduces Elastic nightshift AI SRE to Investigate with the Full Context Others Can't Afford to Keep

The AI SRE uses complete context from across the entire stack to continuously detect issues and learn from every incident, delivering evidence-backed answers engineers can trust.

Sentry JavaScript SDK v11 adds tracing for all JS platforms

This post is about a recent change to the Sentry JavaScript SDKs. If you don’t use Sentry with JavaScript, it may still be useful as a look at how we made the change and why. In the Sentry JavaScript SDK v11, we rebuilt how our tracing integrations work. While we still support the OpenTelemetry standard (described in more detail below), we now instrument your dependencies with a code transformer instead of using the OpenTelemetry instrumentation classes as we did in previous versions.

Meet Rosetta

During an incident, the answers an engineer needs are spread across tools. Telemetry sits in one place, configurations in another, and tickets in a third. Building a complete picture means knowing which tool holds which piece and how to query each one, usually under time pressure. Rosetta is the conversational interface for Selector Foundry, the agentic NetOps platform built on Selector’s existing AIOps and Observability solution.

How Configuration Monitoring Helps Detect Zero-Day Activity

Last updated: October 9, 2026 A zero-day vulnerability may be unknown, but its effects often are not. Exploitation can leave behind observable changes: a new privileged account, an altered management setting, an unexpected file, a modified access rule, or configuration drift from an approved baseline. That makes zero-day configuration monitoring an important part of a defense-in-depth strategy.

SSL Handshake Guide Covering Each Step and the Fixes That Prevent Outages

Why would a website that passes every uptime check still show customers a security warning? In most cases, the server is running and the network is healthy. The failure happens earlier, during the brief exchange in which the browser and the server agree on how to communicate securely. That moment is the SSL handshake. If it goes wrong, users get an error page while your dashboards stay green. Maybe a certificate expired; maybe a routine change left both sides on different protocol versions.

What Is RMM (Remote Monitoring and Management)?

RMM lets one small team look after thousands of machines nobody will ever physically touch. It grew up inside managed service providers. The whole category runs on agent-based monitoring, which means a small program sits on every endpoint and phones home on a schedule. That agent is also why attackers have taken such an interest lately. In this blog, you'll see: By the end you'll know what the category covers and where it stops. RMM stands for remote monitoring and management.

ServiceNow Integration for Obkio's Network Monitoring Tool: Now Live

Obkio's ServiceNow integration is now live. When Obkio detects a network issue, it opens an incident in ServiceNow. When the issue recovers, it resolves that same incident. Your team works the problem in the platform they already use for incident management, with the monitoring context already attached.

Fixing 3 issues with one distributed trace

Use Sentry tracing to investigate three different problems in one shopping flow: an N+1 query, an expired promo-code warning, and a checkout exception. The entire shopping flow happens through the agent conversation on Empower Plant’s homepage: a search for plants under $200, adding one of each to the cart, starting checkout, applying SAVE20, then attempting to place the order. The trace connects that flow to repeated database queries and an N+1 issue, a warning that SAVE20 has expired, and a checkout exception with its inventory-validation stack trace.

Unify data across Datadog BYOC with cross-cluster queries for teams and AI agents

Organizations may need to keep data in specific regions or infrastructure they control, whether because of data residency requirements, internal policies, or transfer costs. Datadog Bring Your Own Cloud (BYOC) extends the Datadog platform into those environments. Each BYOC deployment runs as a Kubernetes cluster with its own object storage, keeping data close to its source.

First CloudWatch Logs on Logit.io

CloudWatch already holds the lines from your Lambda, ECS task, or unified agent. The first useful win on Logit.io is not a migration spreadsheet. It is one Log Group, the documented Lambda shipper posting to this stack's API, and rows in OpenSearch Dashboards Discover that show logGroupName, logStreamName, and message. If you are still proving that a Logs stack can accept anything at all, start with First Logs on Logit.io; this post assumes CloudWatch is the source and the Stack API is the pipe. Contents.
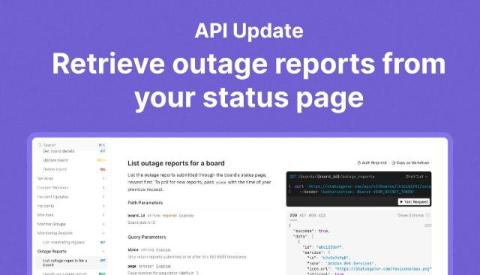
Landing on the Moon with Grafana and Thermal Engineering | Grafana Everywhere

In honor of World Space Week, we're spotlighting Jackson Sweeney's story and his role in Blue Ghost Mission 1. As a Thermal Engineer at Firefly Aerospace, he used Grafana to ensure that the spacecraft maintained the right temperature throughout the mission... and receive a Golden Grot Award for his use case. Behind every successful moonshot are people solving one hard problem after another. For engineers like Jackson, that means turning an extraordinary ambition into thousands of practical decisions.

Grafana Tempo: Redaction by query & TraceQL filtering in trace-by-ID v2 (Oct 2026 Community Call)

Trace redaction permanently removes sensitive data from your traces, for when something like an API key ends up in a span attribute. Tempo 3.0 could do it, but only from a list of trace IDs, so you had to go find every affected trace first. In Tempo 3.1 you can hand it a TraceQL query instead. Separately, trace-by-ID got a filter. You normally ask for a trace and get all of it. Now you can pass a TraceQL query and get back only the spans that match.

How AI agents help teams deliver better digital experiences

The moment your page slows down, two clocks start. One is yours: time to alert, time to investigate, time to fix. The other belongs to the user staring at the slow page. Yours is measured in minutes. Theirs runs out in seconds. That gap is what AI agents close. Zia Agents in OpManager Nexus detects an issue, works out the cause, and runs the fix on its own, often before your users feel a thing. This blog looks at how that changes the experience you deliver.

Top Tips: Staying productive during a slow work week

Top tips is a weekly column where we highlight what’s trending in the tech world and share ways to stay ahead. This week, we’re looking at what you can when you’re having a slow-paced, less hectic workweek. We’ve all been there at intermittent intervals of our jobs: You check into the office right after the weekend only to realize you’re having one of those slow, relatively low-pressure weeks. So what do you do to stay productive?

Run incident response in your FedRAMP High environment

Earlier this year, Datadog for Government achieved FedRAMP High certification, extending our GovCloud environment (US1-FED) to the federal government’s most sensitive civilian workloads. That certification now covers Datadog Incident Response, bringing paging, incident coordination, automation, and postmortem workflows into US1-FED. When a government system goes down, responders need to reach the right people, coordinate a fix, and keep stakeholders informed.

Manage your OpenTelemetry Collectors with Fleet Management in Grafana Cloud

If you’ve built your telemetry pipelines around OpenTelemetry Collectors, you’ve already invested in a collector distribution, YAML configuration, and a deployment model that fits your infrastructure. As that deployment grows, managing it means keeping shared configuration consistent, accommodating different workloads, and understanding whether your collectors are healthy. Fleet Management in Grafana Cloud brings those tasks together in one place.

Reducing Android scope-sync overhead in Sentry Flutter

Our SDK adds work to the app that installs it. It records recent app activity as breadcrumbs and keeps user information and other diagnostic data up to date. Changes to that information are called scope updates. On Android, we send those updates to a worker isolate, which passes them to the Sentry Android SDK. We found that the calling isolate and the worker both normalized the same data. The encoding step also created a JSON string and an extra byte buffer that we could avoid.

We Ran Minecraft on 4 Raspberry Pis with Kubernetes and Monitored it with Open Source

Why did we do this? Not important: jump to 1:31 to see the Pis. TL;DR: We stuck Minecraft on kubernetes running on 4 Raspberry Pis in a 3D-Printed case, and monitored it with open source observability. Huge thanks to Percona DBA Ivan Zaitsev for putting the demo together for Percona University, Montevideo. Coroot automatically collects and visualizes all your telemetry data: logs, metrics, traces, profiles, and a complete map of your services. With the complete context of eBPF, it can diagnose the exact cause of an incident in seconds, and show you the exact commands to fix it.

Log in, look around, level up: Building a trial people want to explore

We turned the mic around for this episode, with Zoe Hawkins interviewing Adam White and Jake Lee about Sumo Logic’s redesigned free trial. The new 14-day sandbox comes preloaded with realistic data feeds, Cloud SIEM, and our AI agents, so no one has to build collectors or open tickets before finding out whether the platform fits. Adam and Jake walk through the guided “choose your own adventure” paths, the broad, open-ended questions that bring out the best in Mobot, and how the trial will keep pace with new releases.

Define user actions on your web app with visual labeling in Product Analytics

Adding or renaming a product event has traditionally meant creating an engineering ticket. Datadog Product Analytics uses the same SDKs and configuration as Real User Monitoring (RUM), and those SDKs autocapture actions such as clicks and taps. But an automatically generated action name describes the element rather than the user intent behind it.

How to Monitor Database Backups and Get Alerted When One Fails

To monitor a database backup, make the backup script check its own output (exit code, file size, a table you know must be there) and ping a heartbeat URL only when all of it passed. If that ping does not arrive on schedule, you get an alert. A backup that failed, wrote an empty file, hung, or never started all look the same from the outside: no success ping.

How to Monitor Celery Beat and Catch Missed Periodic Tasks

To monitor Celery beat, give each periodic task its own heartbeat URL and ping it from the worker when the task succeeds, with a task_success signal handler. If beat is down, the message sits in a queue no worker reads, or the task raises, the ping does not arrive and you get an alert. The trap is that beat only publishes messages: its log prints Sending due task on schedule whether or not anything ever runs the task.

7 Best Network Sniffing Tools for 2026

Ever wondered what is actually using your network when it suddenly slows down? It could be a device sending too much data, a backup running at the wrong time, or an application taking too long to respond. Without visibility into network traffic, finding the real cause can take hours. That’s where network sniffing tools can help. They let you inspect network traffic, capture packets, and see what is happening between devices, servers, and applications.

7 Best SQL Server Monitoring Tools for 2026

A slow query can affect an application before the database team knows what is causing it. A blocked session, failed job, or growing database file can create more problems if no one spots it early. That’s where SQL Server monitoring tools come in. They help you track database performance, find slow queries, monitor waits and locks, and see what changed before a problem occurred.

Debug Production at the Speed of AI

Your coding agent can debug production issues now. Yes… Not just “help you debug.” Actually run the investigation… FOR YOU! In this new era of agentic development, speed matters. And in the old days (you know… last week or so) we used to investigate production bugs ourselves. Manually. Like humans. But for a lot of incidents, we don’t need to do all of that anymore.

Where Jev fits in ops

If you're using agents and MCPs to get a better understanding of your environment or work through an investigation, you can get a lot of useful information back. You can pull logs, look at recent changes, and check how services are configured, but you're still the one deciding what to do with all of it. That part of the process still lives in your head. To see where Jev might fit, look at decisions your team already makes and work backwards from them.

Event Intelligence and the Diagnosis Gap: When Logs Are the Only Witness

✓ operational truth Incident diagnosis is now the longest phase of resolution because evidence is fragmented, expertise sits with a few people, and cloud and SaaS estates no longer allow engineers to log in and look. Event Intelligence closes the gap by correlating events into a single probable cause, mining logs automatically, and arriving at the incident with a hypothesis already formed.

Searching Sentry Logs with Regex

We use Sentry's new Regex search for Logs to hunt for non-obvious bugs in our app. What do you do when traces show that Postgres jobs are backing up? Logs are trace-connected, so by looking at one of the affected traces, we can see all of the logs on that trace. In there, we can see Postgres has logged that it acquired a lock only after a long wait. Using regex, we can find all of these logs that describe acquiring a lock after a 10-second-plus wait. That narrows our search from thousands or hundreds of logs down to about a dozen.

Generative AI in Banking: Balancing innovation, risk, and operational readiness

Generative AI (GenAI) is moving quickly into banking. According to a 2025 survey by McKinsey, 52% of financial institutions surveyed already consider GenAI a priority, while another 39% are interested but have not yet made it a top priority. As adoption grows, banks need to think carefully about what AI agents can access, which identities it uses, what actions it can take, and whether those activities can be traced when something goes wrong.

Modernize Your Data Historian with InfluxDB

In this video, Dev Advocate Cole Bowden walks you through where traditional data historians fail, and why a dedicated time series database like InfluxDB can streamline your operations. With an AI-powered demo showcasing an automative plant's data, you'll see the value of InfluxDB and where it can power insights that Data Historians can't handle on their own.

AI Investigation for ITOps: Faster Root Cause with Edwin AI

AI investigation for IT operations finds the likely root cause of an incident and shows the evidence behind it. This video covers how deep AI investigation works for ITOps, SRE, and platform engineering teams using LogicMonitor's Edwin AI. Engineers lose time stitching together alerts, logs, and recent changes after an alert fires. Deep AI investigation hands that first pass to AI agents, so your team starts closer to the fix. Edwin AI, LogicMonitor's AI agent for ITOps, correlates alerts, identifies root causes, and recommends remediation.

Icinga Web Filter Syntax: Operators, Wildcards and Custom Variables

An Icinga Web filter is a chain of conditions, each one a column, an operator, and a value, combined with & and |. You type it into the search bar of Icinga DB Web, but the same syntax shows up in URLs, dashboards, role restrictions, and the event rules of Icinga Notifications Web. This post covers the whole thing: operators, wildcards, grouping, and filtering all the way down into arrays and dictionaries.

OpenTelemetry Collector Configuration for LLM Observability

Your LLM application emits telemetry unlike anything else in your stack. Model calls, tool invocations, retrieval steps, and token usage arrive as spans whose attributes carry entire prompts and completions. That data is bulky, it's full of user content you may not be allowed to export, and depending on which instrumentation each service uses, the same fact can arrive under different attribute names.

Manage synthetic checks at scale: Introducing folders in Grafana Cloud Synthetic Monitoring

As your use of Grafana Cloud Synthetic Monitoring grows, so does the number of checks you need to manage across services, environments, and teams. Eventually, a single flat list of checks becomes difficult to navigate, and even simple questions get harder to answer: Which checks belong to the payments team? Can I disable everything in staging during a maintenance window? Who should be able to edit the checks for this service?

9 Best Help Desk Software for Small Business in 2026

Why is your network slow or failing even when your devices seem to be working? Finding the cause of a network problem can take time. You may need to check packet loss, trace the network path, find a busy link, or see why an application is not connecting. A simple ping test can tell you whether a device responds, but it cannot always show what is causing the problem. Network diagnostic tools help you narrow down the cause by checking devices, ports, routes, packets, traffic, and link performance.

8 Best Network Diagnostic Tools for 2026

If your team manages a network across several offices and cloud systems, finding the cause of a slow or failed connection can take time. You may run into problems such as: As your network grows, a quick test from one computer may not show where the problem started or when it first appeared. Network diagnostic tools help you check devices, ports, routes, packets, and link performance.

Coroot at KCD Argentina

Kubernetes Community Days (KCD) Argentina brought together the vibrant technology communities of Buenos Aires for in-depth technical talks, SRE workshops, and an amazing opportunity to connect with fellow experts in cloud technology. Coroot had a great time participating, and we extend our thanks to all the SREs, DBAs, and DevOps engineers who stopped by the booth to discuss their observability experience.

Governing AI Agents From the Inside: What We Learned Building AgentPatrol

When every employee is building AI agents, seeing what they did afterward isn't enough. AgentPatrol's in-flow governance runs inside the agent's execution flow—pausing for human approval, enforcing policies by value, masking PII, and stopping runaway agents before costs spiral.

Governing AI Agents From the Inside: What We Learned Building AgentIQ

When every employee is building AI agents, seeing what they did afterward isn't enough. AgentIQ's in-flow governance runs inside the agent's execution flow—pausing for human approval, enforcing policies by value, masking PII, and stopping runaway agents before costs spiral.

Seer Agent: Get Answers. Take Action.

This video walks through what it looks like to treat Sentry's Seer agent the way you already treat a chatbot, asking it plain language questions about your own production application. From Slack or inside your Sentry account, Seer Agent can answer questions with real context: the affected spans, the recent release, the likely cause. Seer doesn't stop at answering questions. Ask it to act on what it just told you and it completes that work inside Sentry, serving as an assistant to your projects, team workflows, and your future self.

Q3 2026 Recap: Up to 4x Faster Single-Series Queries, Distributed Compaction, and Telegraf Controller High Availability

Q3 was a packed quarter, with releases across InfluxDB, Telegraf, and Amazon Timestream for InfluxDB that help deployments and fleets grow without slowing down. InfluxDB 3.11 brought performance improvements for heavier, more complex workloads to GA in InfluxDB 3 Enterprise. InfluxDB 3.12 followed with roughly 3x faster bulk imports, distributed compaction in beta, per-database schema enforcement, and generally available role-based access control.

Restoring Compliance After Missed SAP Patch Cycles

Avantra restores SAP compliance after missed patch cycles by measuring the real gap on every system, automating the catch-up in risk order, and monitoring continuously afterward. A missed cycle can leave SAP operations out of compliance or exposed to documented vulnerabilities, and until each system is assessed, the impact is unknown. Getting “back to good” requires three steps: The patching itself is rarely the hard part.
Sponsored Post

Raygun APM Agent 3.1: async traces that stay with the right request

Raygun APM Agent 3.1 introduces more accurate asynchronous request tracing for Windows, Linux, and Azure App Service. Version 3.0 rebuilt the foundation of the Agent, profiler, installers, and release pipeline. Version 3.1 builds on that work with a focused improvement for ASP.NET Core: automatic request correlation that follows asynchronous execution without requiring developers to instrument their application. The result is a more accurate trace, with less duplication and a clearer view of the work performed for each web request.

10 Best Database Monitoring Tools for 2026

If your company relies on multiple databases and applications, keeping track of database performance can become difficult. You may face challenges such as: As your database environment grows, identifying the cause of performance issues becomes harder without the right monitoring in place. I get why database monitoring tools have become an important part of managing database performance. They help you monitor database activity, spot performance issues, and find what is causing a slowdown.

Remote Infrastructure Management: How to Run Sites With No IT Staff

Most IT teams now look after more sites than they have people to visit. Remote infrastructure management covers that gap, and it works differently from the IT infrastructure management you run inside a building where somebody can walk over and look at whatever broke. The technology rarely causes the trouble. Trouble starts when a site goes quiet and there's nobody standing there to look at it.

How to Filter and Reduce AI Agent Telemetry with OpenTelemetry & Bindplane

Why is the telemetry AI agents generate so intimidating? If you turn on Claude Code’s internal telemetry it’ll throw a wall of text at you. And, it’s very expensive to store. But, the bigger issue is that you can’t make sense of it. Luckily it’s all OpenTelemetry native. That means you can configure it to send, transform, and store what you really need. Which raises the only question that matters. What do you actually need?

The Data Race That Wasn't a Bug (and the One That Was)

Imagine this: you are testing the performance of some part of your application. Everything is going smoothly, the numbers look good, and as a last check you turn on Go’s race detector. Then, out of nowhere, it prints a warning you didn’t expect: So you look at it. You look at it again, and again, and you think: “What the…?” The race is between your code and a goroutine you never started, somewhere deep inside net/http. You have no idea how that is possible, or why.

Unreal MCP now speaks Sentry

Setting up crash reporting is rarely the most exciting part of shipping a game. Paste a DSN, flip a few checkboxes in Project Settings, turn on symbol upload, package a build, crash it on purpose and check that the event shows up in Sentry… It’s not hard to do (and important), but it’s the kind of work you’d happily hand off to someone else. With Unreal Engine 5.8, that someone else can be your coding agent.
Beyond Traditional Observability: Turning Technical Insight into Operational Intelligence

Observability has become a central part of modern IT operations and for good reason. Metrics, logs and traces give technical teams detailed evidence about how applications, infrastructure and services are behaving. Such evidence helps them investigate performance degradation, identify abnormal behavior and understand what changed around the time an issue occurred.

How ScienceLogic Helps Federal Skylar One Customers Move to FIPS 140-3 Without Disrupting Operations

ScienceLogic provides federal Skylar One customers with a supported Oracle Linux 9 direction, deployment-specific migration workflows, validation gates, and clear ownership before Oracle Linux 8 is retired.

Azure in Bleemeo: your subscription next to your servers, with one read-only role

Most teams that run on Azure do not run only on Azure. There is a database on a VM nobody wants to move, a Kubernetes cluster somewhere else, a few servers in a rack, and a monitoring setup that grew around all of it. Azure Monitor sees the Azure part very well and nothing else, so the picture of an incident ends up split across two consoles, two alerting configurations and two sets of dashboards. Bleemeo now connects to Azure the same way it already connects to AWS.
Observability vs Monitoring: Why Does IT Still Find Out After the Business Does?

✓ operational truth IT finds out late because traditional monitoring is built to detect what goes wrong, not what has quietly stopped happening. Closing that gap requires observability that validates business journeys end to end, detects missing activity, checks its own coverage, and predicts degradation before a threshold is ever crossed.

On SQLAlchemy 2.1.0 or 2.1.1, Fixing an N+1 Could Change Your Results

The standard fix for an N+1 query in SQLAlchemy is to eager load the relationship with selectinload(). On SQLAlchemy 2.1.0 and 2.1.1, that fix can change your results. A regression in those two releases makes selectinload() ignore part of the join condition on some many-to-many relationships. The query gets faster, and it also returns related rows that the relationship was defined to exclude. It’s fixed in 2.1.2, released October 2.

Ship faster, improve reliability, and control CI costs with Datadog CI/CD Optimization

AI-assisted development can increase the rate at which teams produce code, but teams only realize those velocity gains if CI can keep pace. More pull requests (PRs) mean more builds, tests, and pipeline executions. Slow jobs leave developers and coding agents waiting for feedback, flaky failures consume time in reruns and investigations, and unnecessary test execution increases runner demand as delivery volume grows.

Distributed Tracing In Netdata: OpenTelemetry Traces

Back in 2020, when we laid out where Netdata was going, the plan listed anomaly detection, log collection and “application traces collection”. The first two shipped years ago. Traces took longer, because we wanted them to work the way the rest of Netdata works: collected and stored on your own nodes, with no separate backend to stand up. Distributed tracing is now available in Netdata.

How Honeycomb Private Cloud Drinks From the Fire Hose

Back in July, I wrote about how the Tenant team (the team behind Honeycomb Private Cloud (HPC)) has embraced the code review bottleneck to focus more of its work. One of the other challenges we have is that we're downstream of almost all the other teams at Honeycomb, meaning that we have to package up everyone's code and services, and how it gets provisioned! This is something impossible to handle through code review since there are so many engineers on other teams, and so few of us.

10 Best AI Help Desk Software for 2026

Are your support teams spending too much time handling tickets and answering repetitive questions? As support requests increase, teams spend more time reading conversations, assigning tickets, finding relevant information, and preparing replies. These tasks can take attention away from complex issues that require human support. AI help desk software can help reduce this workload. It can answer common questions, summarize tickets, suggest replies, route requests, and assist with support tasks.

ISO 27001 Compliance: What Auditors Require and When You Need the Certificate

ISO 27001 compliance means running your information security the way ISO/IEC 27001 sets out. Most teams meet the standard when a customer sends over a security questionnaire. It lands as one more line on a cybersecurity compliance checklist. That framing hides the decision underneath it. You can follow the standard without ever being certified against it. The two routes cost very different amounts. In this blog, you will: You will finish able to decide whether you need the certificate, and what it takes.

Moving Mainframe Data to Snowflake and AWS Through Apache Kafka: Treehouse Software and meshIQ

Treehouse Dataflow Toolkit moves mainframe data from Db2, VSAM, and IMS through Apache Kafka pipelines into Snowflake and AWS targets. meshIQ keeps the streaming layer visible and stable. Together they give data science teams continuously updated enterprise data for AI and ML.

The Year-2 Price Cliff: What Your Observability Stack Really Costs Over 3 Years

I’m not the one whose phone lights up at 3 a.m. when production breaks. But I’ve spent years working alongside the engineers who are, and I’ve noticed that observability migrations happen for two reasons. Either engineering needed one, or, far more often, a quote landed that looked too good to refuse. The engineers rarely regret the first kind. The second kind they tell me about in year two, usually with a renewal notice in hand.

FastAPI 0.142 Turns On OpenTelemetry by Default. Here's What It Records.

FastAPI 0.142.0 ships with OpenTelemetry built in. Install fastapi, set one environment variable, and every request produces a trace, metrics, and error logs. No middleware, no instrumentation package, no code. That’s a big change for a framework most Python teams instrument by hand. It’s also easy to misread. The defaults record more than some teams expect in one place, and less than others assume in another. Here’s what you actually get.

Steer, Block and Audit Agent Behavior from One Place | SAO Agent Control Demo Cisco Agent Control

Most teams keep an agent from regressing by hardcoding checks into its logic, an if-statement here, a regex there. Every new rule then becomes a code change, a review, and a deploy, and the person who spots the problem in production is rarely the person who can ship the fix. Agent Control moves those rules out of the code and into one hub. Steer, block, and validate agent behavior in real time, with rules any team member can update without touching the codebase.

Turn Production Failures Into Test Datasets | SAO Dataset Curation

Your agent breaks in production. You fix it and move on. But the input that actually broke it is gone and two months later the same failure quietly comes back, because there was never anything to test against. That's not a debugging problem. It's a missing dataset. This demo turns low-scoring production traces into a regression suite you can run against every prompt and model change, without writing a single test case by hand.

The September 30, 2026 Railway Outage

Railway-hosted domains returned HTTP 404 to new connections in all four Railway regions on September 30, 2026, for about five minutes between roughly 07:35 and 07:40 UTC. This happened after a new version of Railway's routing service went live before the database schema change it depended on had been applied.

Block AI Agent Regressions Before They Ship | SAO Pre-Push Eval Gate Demo

Every engineering team has unit tests. They tell you the code still works. They tell you nothing about what the model started saying. This demo wires a single eval gate script into a git pre-push hook, so Splunk Agent Observability scores every agent's output before the push is allowed through. Luna, an on-premise small language model, runs as a synchronous judge against fixed thresholds. Fail one, and the push is blocked.

Who Built This Dashboard, and Are They Still Here?

You have lived it, no? When production is down, and you have that chart that says something really strange and peculiar, and nobody knows who did it or when. Production is bleeding. There is a spike on screen. And the chart answers everything except the question you actually have: who built this panel, what did they mean by it, and are they still here?

Get a weekly view of your service reliability

StatusGator already keeps you informed as outages happen with status change notifications and Early Warning Signals. Now, you can also get a simple summary of how your services performed over the past week. We’ve added Weekly Uptime Reports, delivered directly to your inbox. Each weekly report gives you an at-a-glance view of your StatusGator board, including: This makes it easy to review the week without digging through individual incidents or notification emails.

Seer, the Sentry MCP and CLI, or your own coding agent: where each one fits

I’ve been getting some version of this question a lot lately, mostly in our Seer preview webinars. Different audiences, same handful of questions: Worth answering all three in one place. Honestly, I needed to write this down for myself too. Things are moving fast around all of us and answers seem to get more nuanced by the week. This is an attempt to codify the difference: what each option is and when it makes sense to reach for one over the other.

Prove Your SLAs: How Yext Ties Synthetic Monitoring to SLOs with Checkly (Live-Webinar)

Yext uses synthetic monitoring to prove and meet SLAs, by tying Checkly checks directly to SLOs and user-facing SLIs. Stefan (Developer Relations), Braxton (Solutions), and Shikhar (Engineering Productivity at Yext) cover the SLA/SLO/SLI basics, the math behind "all these nines", and how Yext turns those targets into concrete checks with monitoring as code.

Monitor Databricks with Datadog

Earlier in this series, we covered key metrics for monitoring performance in Databricks and discussed Databricks’ native resources for accessing those metrics and other key observability data, such as logs and data lineage. In this post, we’ll cover using the Databricks integration to bring that data into Datadog and monitor your Databricks analytics and AI/ML workloads alongside the rest of your end-to-end data pipelines and distributed infrastructure. We’ll show you how to.

What Is Network Diagnostics? Manual vs. Automatic Diagnosis

Network diagnostics is the process of finding out why a network performance issue is happening: what's causing it, where and when it occurred, and who needs to fix it. It's the step between an alert telling you something is wrong and a fix being applied. For most IT teams, it's also the slowest part of resolving a network issue.

Databricks' native monitoring resources

In the first part of this series, we cataloged key metrics for Databricks data engineering, analytics, and Model Serving workloads. In this post, we’ll discuss how to collect those metrics and other telemetry data from Databricks and Apache Spark, which powers Databricks under the hood. We’ll cover collecting and querying telemetry data via system tables, as well as the other primary sources of visibility into.

Become a PowerPack Picasso: A Discussion About Skylar One Studio

If Sklyar One is your canvas, then Skylar One Studio is where you develop your art. In this session, we’ll dive into the latest tools that allow you to quickly and easily build new PowerPacks. You’ll learn how to build beautiful PowerPacks, without having deep Python knowledge, which work quickly, have great performance, are secure, and easy to support; all thanks to the extensibility of ScienceLogic tools using the latest and greatest innovations in content development. Your next masterpiece is at your fingertips!

Where do you see organizations hitting their limits?

In this clip, Virtana Chief Product Officer, Amit Rathi explains why more data does not automatically lead to better operations. As system complexity grows, organizations are collecting more telemetry than ever while struggling to turn it into actionable insights. At the same time, rising observability costs are forcing some teams to monitor only part of their environments. Watch the video to learn why intelligence, not just visibility, is becoming essential for modern IT operations.

NetScaler Console Indicators of Compromise Detection

On September 27, 2026, Citrix published a security bulletin covering eight new vulnerabilities in NetScaler ADC and NetScaler Gateway. Some of these vulnerabilities are critical and have already been exploited in the wild. Citrix released fixed NetScaler builds and recommends upgrading affected appliances as soon as possible. However, when a vulnerability is already being actively exploited, installing the update only solves part of the problem.

Azure Monitor pricing: What you pay vs. what you get

Azure Monitor doesn't have a price. It has a bill and those are very different. There's no plan tier to pick, monthly set fee, or simple number to sanity-check against your budget. Instead, you're charged across a handful of separate meters: log ingestion, log queries, retention, alert rules, web tests, and custom metrics. Each of these metrics scale independently. Most teams don't see the full cost until the bill arrives.

Best Monitoring Tools With MCP Servers for AI Coding Agents (2026)

Your AI coding agent can read your code, run your tests, and open a pull request. Until recently it could not see what that code does in production. MCP servers from monitoring vendors close that gap. Connect one, and Claude Code, Cursor, or Copilot can pull the error, the trace, and the slow query behind a bug report without you copying anything out of a dashboard. Most major monitoring vendors now offer an official MCP server. But they aren’t interchangeable. Some only expose errors.

How Agilent Uses Workspace to Turn DEX Data into Confident IT Decisions

⁠Operating across 110 countries, Agilent Technologies supports scientists working in life science research, patient diagnostics and testing that helps ensure the safety of water, food and pharmaceuticals. Keeping the technology behind that work running effectively helps employees stay focused on the science and services that contribute to Agilent’s mission to advance quality of life.

How does data mesh architecture improve data management? [Quick Question Ep. 2]

How does data mesh architecture improve data management? In this episode of Quick Question, we cover the three core benefits — real-time visibility, control, and data quality — including how CISA uses Elastic to connect data from over 100 civilian agencies without moving it to a central location. The episode also covers how data sovereignty is preserved through role-based and attribute-based access controls, and why data quality improves when the teams closest to the data are the ones managing it.

How to Make Claude Your UI Design Companion

When I first tried Claude Design, shortly after it was released, I wasn’t impressed. As an every day Figma user, I missed the option to manipulate elements directly, especially for fine tuning details. What I overlooked at that point was the fact that it is really good at generating different options efficiently. Most of them aren’t usable, but getting these options suggested helps when exploring and combining different approaches and ideas.

Introducing Distributed Tracing in Netdata

Netdata now supports distributed tracing. In this webinar, we'll demo the new tracing capabilities for the first time: OpenTelemetry trace ingestion, the new tracing dashboard, and the UI built to let you move from a metric anomaly to the exact span that caused it. For years, teams have asked us to close the gap between infrastructure monitoring and application performance. This release does that. Netdata can now ingest traces via OTEL, correlate them with the metrics and logs you already collect, and surface them in a purpose-built interface designed for speed and clarity.

Fleet Monitoring with Netdata: Live Demo

A walkthrough of monitoring a distributed fleet with Netdata, using a simulated fleet of about 1,000 devices spread across regions. We show how the whole fleet reports into a single view: per-second metrics from every node, grouping by region and by customer, a map view that colors each device by health, filtering and saved views for different teams, and an AI-assisted investigation that scans the fleet for anomalies and points to likely causes.

Grafana Mobile to Desktop Companion App

The Grafana Mobile App lets you triage alerts with help from Assistant from your phone. You can declare an incident or trigger an investigation into an incident in order to get more information so that by the time you get to your desktop, everything is ready for you. Grafanistas Ignacio and Florian go through a use case deep dive, demonstrating the value of the Grafana Mobile Companion app by triggering an investigation, talk to Assistant, and have all the data you need to resolve an incident - all from your phone.

Cloud Shell, New Integrations, and More

VirtualMetric DataStream now includes a PowerShell console in the browser, more than a dozen new integrations, and a new way to collect data from servers and virtualization hosts, where teams choose exactly what they collect. This update also brings guided learning for new users, built-in monitoring rules, and new controls for organizations managing branding and sign-in. Here’s what’s new.

SOX ITGC Controls Checklist for IT Service Management and Year-Round Audit Readiness

How much of your SOX audit season goes into rebuilding proof of work that was already done? Access was approved, the change went through review, the backup ran, yet the evidence lives in email threads, chat messages and a spreadsheet someone updated last quarter. When an auditor asks for a complete list of production changes, IT staff have to pull records from several places against a deadline.

What Happens When an SLA is Breached and How to Recover Customer Trust

What does your organization owe a customer when a priority ticket misses its resolution target by forty minutes? For most service providers and internal service desks, the answer stays unclear until the customer asks for a credit or a manager asks why the monthly SLA report shows a miss. By then, the facts that decide the outcome, such as when the clock started, whether it paused and who was told, are scattered across tickets, emails and chat threads.

How to Fix Intermittent Internet Issues: Is It Your Network or Your ISP?

Your Internet circuit is up. The firewall shows the WAN link as connected, your ISP's status page is green, and a speed test comes back at full provisioned bandwidth. Meanwhile, Teams calls at one branch break up for ten minutes every afternoon, and every user at that site sees Salesforce slow to a crawl at the same moment. Then everything recovers before anyone can capture it.

OnlineOrNot updates from June through August 2026

It's been a while since I last updated you on what's new in OnlineOrNot. For the most part, I've continued making it useful for software teams: there's now an MCP server, I've improved the terraform provider significantly, and there's a new TypeScript SDK. You can also (finally?) monitor DNS/TCP with it.

Dr. Cat Hicks on the Psychology of Software Teams

What happens when a software engineer who has put their entire identity into being the resident expert of an obscure technology or language with ten years of experience and who knows the codebase like the back of their hand now has to compete with AI? Psychologically speaking, according to Dr. Cat Hicks, author of The Psychology of Software Teams and founder of Catharsis, that's called identity threat, and it's a surefire way to feel unsafe. We were honored Dr.

Monitor warehouse data quality beyond pipeline health

You get a Slack message from the VP of Sales: They have asked an AI agent connected to Snowflake for the past quarter’s revenue and the numbers look wrong. First, you verify the agent’s query and, when that looks fine, check the pipelines that populate the underlying table. All jobs completed, the data is recently refreshed. Then it’s time to check the logs for errors. Nothing.

How Hybrid WAN Is Transforming Enterprise Network Connectivity

Enterprise networks are evolving as businesses adopt cloud applications, remote work, distributed offices, and connected devices. A hybrid WAN solution can help organizations combine different connectivity options while supporting the performance, reliability, and flexibility required by modern business operations.