|
By Nikolay Sivko
Coroot's node-agent already collects CPU profiles for any process on the node using eBPF, with zero integration from the application side. For Java, we dynamically inject async-profiler into the JVM to get memory and lock profiles. But Go processes were still a blind spot for non-CPU profiling unless the app exposed a pprof endpoint and the cluster-agent scraped it. We wanted the same zero-config experience for Go heap profiles. This post is about how we got there.
|
By Nikolay Sivko
Coroot already does eBPF-based CPU profiling for Java. It catches CPU hotspots well, but that's all it can do. Every time we looked at a GC pressure issue or a latency spike caused by lock contention, we could see something was wrong but not what. We wanted memory allocation and lock contention profiling. So we decided to add async-profiler support to coroot-node-agent. The goal: memory allocation and lock contention profiles for any HotSpot JVM, with zero code changes. Here's how we got there.
|
By Nikolay Sivko
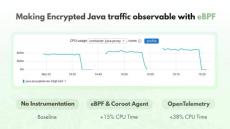
Coroot's node agent uses eBPF to capture network traffic at the kernel level. It hooks into syscalls like read and write, reads the first bytes of each payload, and detects the protocol: HTTP, MySQL, PostgreSQL, Redis, Kafka, and others. This works for any language and any framework without touching application code. For encrypted traffic, we attach eBPF uprobes to TLS library functions like SSL_write and SSL_read in OpenSSL, crypto/tls in Go, and rustls in Rust.
|
By Nikolay Sivko
Coroot is an open source observability tool that uses eBPF to collect telemetry directly from applications and infrastructure. One of the things it does is capture L7 traffic from TLS connections without any code changes, by hooking into TLS libraries and syscalls. Works great for OpenSSL. Works for Go. Then rustls enters the picture and everything stops being obvious. With OpenSSL, everything is nicely wrapped: From eBPF’s point of view this is perfect: Everything happens inside one call.
|
By Nikolay Sivko
No one has time to watch dashboards all day. Alerts exist to tell us when something goes wrong or is starting to go wrong, so we can act early. In theory, it sounds simple. Define a rule, set a threshold, get notified when it is crossed. In practice, it rarely works that smoothly.
|
By Alexander Lamberton
Cloud costs often grow quietly until they suddenly command everyone’s attention. Gartner estimates that companies overspend on cloud services by up to 70 percent, mostly because they lack clear visibility into where the money is actually being spent. Cloud invoices speak the language of infrastructure: nodes, instance types, regions, volumes, and egress. Engineering teams speak the language of services, deployments, and code.
|
By Nikolay Sivko
When we set a memory limit for a container, the expectation is simple: if the app leaks memory, the OOM killer steps in, the container dies, Kubernetes restarts it, done. But reality is messier. As a container gets close to its memory limit, allocations don’t just fail instantly. They get slower. The kernel tries to reclaim memory inside the cgroup, and that takes time. Instead of being killed right away, your app just crawls.
|
By Nikolay Sivko
Recently, I was testing Coroot’s AI Root Cause Analysis on failure scenarios from the OpenTelemetry demo. One of them, loadgeneratorFloodHomepage, simulates a flood of excessive requests. As expected, it caused a latency degradation across the stack. Coroot’s RCA highlighted how the latency cascaded through all dependent services. At the same time, we noticed a moderate increase in CPU usage for the frontend service and the node itself.
|
By Yiran Cui
Coroot is excited to feature an editorial from the open source observability database GreptimeDB as an Open Source Spotlight. We hope to improve the work of our global community of SREs and DevOps professionals by sharing exciting projects like GreptimeDB, which make innovation accessible for everyone through the freedom of open source.
|
By Nikolay Sivko
Cloud platforms make it incredibly easy to store data. Object storage feels endless, and block volumes can be resized anytime. That’s great, until you check the cost. In some cases, like financial transactions, storage costs are tiny compared to the value of the data. But observability is a different story. Logs, traces, and profiles can be extremely detailed and often take up more space than the actual business data. Yes, there are situations where logs need to be kept for compliance reasons.
|
By Coroot
Try it open source on your system. Learn how tools can make gathering and making sense of observability data instant and painless with co-founder Peter Zaitsev.
|
By Coroot
All the problems that could go wrong with DNS and why "It's always a Freaking DNS Issue" according to DevOps movement co-founder and open source advocate Kris Buytaert.
|
By Coroot
Learn what DevOps is from a founder of the movement, Co-founder of DevOpsDays, O11y, and Inuits, FOSS advocate: Kris Buytaert.
|
By Coroot
Understand the four pillars of observability (metrics, logs, traces, and profiles) with Co-founder Peter Zaitsev.
|
By Coroot
Alex chats with Kris Buytaert, Co-founder of DevOpsDays, O11y, Inuits and pivotal instigator of the movement about why he loves using Coroot.
|
By Coroot
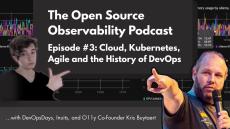
Kris Buytaert is the Co-founder of Inuits, O11y, and ‘DevOps Days,’ an internationally-attended series of DevOps events. He is a passionate advocate of Free and Open Source Software, and is accredited by the community as being a founding instigator of the DevOps movement. In this episode we trace the history of the DevOps movement from its intersection with open source and Agile, through the evolution of Cloud technologies and tools such Docker and Kubernetes, to present day best practices for CI/CD, monitoring, and observability.
|
By Coroot
Co-founder of DevOps Days, O11y, Inuits, and pivotal instigator of the DevOps movement Kris Buytaert explains why “observability best practices” starts with functioning monitoring and common mistakes to avoid.
|
By Coroot
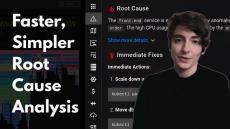
Watch Coroot’s Root Cause Analysis AI pinpoint the exact cause of an incident and suggest fixes in seconds.
|
By Coroot
🐧🐝 Learn what classic CPU metrics are (Load average, Node usage, and Container CPU usage) and why Delay Accounting can provide better, kernel-level insights into your system: https://t.ly/HQrWx
|
By Coroot
Incidents can quickly become costly, and digging through overwhelming amounts of telemetry can take hours. AI-Powered Root Cause Analysis automatically identifies the root cause of an incident and suggests fixes in seconds, so your team can get back to development (or if they’re on call at 3am, back to sleep.)
- April 2026 (2)
- March 2026 (2)
- February 2026 (2)
- January 2026 (6)
- December 2025 (4)
- November 2025 (1)
- September 2025 (4)
- August 2025 (7)
- July 2025 (7)
- June 2025 (11)
- May 2025 (2)
- April 2025 (2)
- March 2025 (1)
- January 2025 (6)
- December 2024 (2)
- November 2024 (3)
- September 2024 (5)
- August 2024 (17)
- July 2024 (3)
- June 2024 (3)
- May 2024 (6)
Metrics, logs, traces, continuous profiling, and SLO-based alerting, supercharged with predefined dashboards and inspections.
An open-source observability platform built for simplicity. Say goodbye to manual analysis of metrics, logs, and traces. Gain actionable insights and focus on remediation.
Observability made simple:
- Zero-instrumentation: Coroot uses eBPF to automatically collect comprehensive telemetry data, including metrics, logs, and traces. It provides a detailed Service Map of the entire system, eliminating blind spots. Coroot also includes predefined inspections that can identify root causes for over 80% of issues without requiring any configuration.
- Application Health Summary: Coroot’s Application Health Summary feature makes it easy to understand the status of your services, even when you have hundreds of them. It provides instant insights into application logs and tracks Service Level Objectives (SLOs) for efficient performance monitoring.
- Distributed Tracing: Coroot’s distributed tracing helps you answer critical questions about your system’s performance. Coroot fully supports OpenTelemetry, ensuring no vendor lock-in. Struggling to instrument legacy or third-party services? Coroot’s eBPF-based instrumentation captures requests without any code changes.
- Log Monitoring: Grasp insights from logs with just a quick glance. Coroot performs low-overhead log analysis right on the node to identify message severities and recurring patterns. This process is seamless and compatible with a wide range of log formats, providing valuable meta-information for quick and easy log analysis.
- Continuous Profiling: Coroot’s Continuous Profiling allows you easily identify and analyze any unexpected spikes in CPU and memory usage down to the precise line of code. This allows you to quickly pinpoint and resolve performance bottlenecks, optimize your application’s resource utilization, and deliver a faster and more reliable user experience.
- Deployment Tracking: Coroot discovers and monitors every application rollout in your Kubernetes cluster. Each release is automatically compared with the previous one, so you’ll never miss even the slightest performance degradation. No integration with your CI/CD pipeline is required.
- Cost Monitoring: Every developer understands that in order to optimize something, you must first measure it. The same principle applies to you cloud costs – measuring them is crucial for optimization. Now you can easily monitor you cloud costs with Coroot. It doesn’t require access to you cloud account or any other configurations.
Enable system observability in minutes, no code changes required.


