Operations | Monitoring | ITSM | DevOps | Cloud
June 2021
Cut cloud cost spending with a tool that works
More and more, we see our clients moving their workloads from clunky on-premise data centers to nimble cloud platforms, orchestrated container environments, such as Kubernetes and Red Hat OpenShift, or a combination of both. The technical aspects of such a migration are typically well-known. Your IT staff does a great job managing these environments: Still, there is one more aspect of managing these environments that is often overlooked — cost.
Manage GKE services with Cloud Operations
CircleCI Continuous Updates | Server 3.1
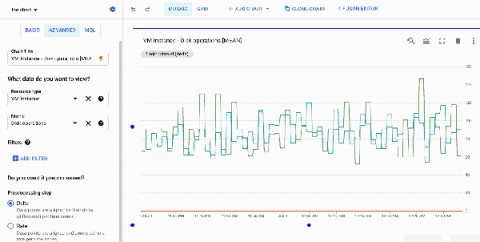
New in the Google Cloud Monitoring data source plugin for Grafana: sample dashboards, deep linking, more
More than two years ago, the Google team began collaborating with Grafana Labs to build a data source plugin for Google Cloud Monitoring (then known as Stackdriver). Today, Grafana ships with built-in support for Google Cloud Monitoring, allowing users to add it as a data source and quickly get started building dashboards for Google Cloud Monitoring metrics. We’ve continued to make improvements on the plugin, and we’ll share in this blog post a few new features we’ve built.
What We Learned About Enterprise Cloud Services From the 2021 Azure Outage
Azure, AWS, and GCP cloud services are invaluable to their enterprise customers. When providers like Microsoft are hit with DNS issues or other errors that lead to downtime, it has huge ramifications for their users. The recent Azure cloud services outage was a good example of that. In this post, we’ll look at that outage and examine what it can teach us about enterprise cloud services and how we can reduce risk for our own applications.
Expert advice on moving to serverless
We asked seven serverless experts, knowing what they know now, what piece of advice would they give to their past selves on moving to serverless. Here’s what they had to say: Ben Ellerby, AWS Serverless Hero and VP of Engineering at Theodo Serverless is a mindset change, bring your teams with you on the journey. Show them the power of Serverless hands-on – and invest in the developer experience of your pipelines from day 1. Ben Smith, Senior developer advocate for serverless at AWS.
The Technologies Every IT Professional Needs to Consider in 2021
How Psyonix wins with better logging
When you grow your peak concurrent users by 5x nearly overnight, ensuring that your operations can successfully support that growth can be a make or break for your success. Rocket League is a popular online multiplayer game created by Psyonix described as arcade-style soccer and vehicular mayhem. In the summer of 2020, the game maker decided to switch the business model of the game from an upfront purchase to a free to play model.
Put a Stop to Data Swamps with Event-Driven Data Testing
Ensure data quality in your S3 data lake using Python, AWS Lambda, SNS, and Great Expectations. Data lakes used to have a bad reputation when it comes to data quality. In contrast to data warehouses, data doesn’t need to adhere to any predefined schema before we can load it in. Without proper testing and governance, your data lake can easily turn into a data swamp.
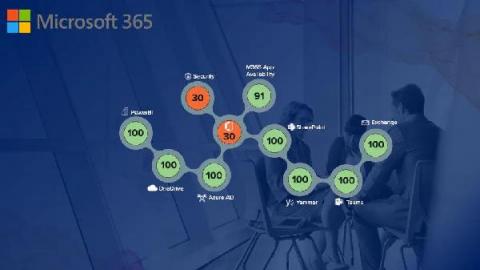
Microsoft 365: Are You Flying Blind...and at What Cost?
Many organizations today are migrating from on-prem solutions for email / calendar / communications to Microsoft 365. If this is you, this is your productivity cloud across work and life, designed to help you achieve more with innovative Office apps, intelligent cloud services, and world-class security.
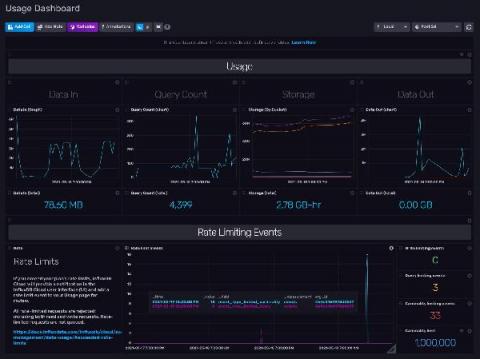
TL;DR InfluxDB Tech Tips - Using and Understanding the InfluxDB Cloud Usage Template
So you’re using InfluxDB Cloud, and you’re writing millions of metrics to your account. Whether you’re building an IoT application on top of InfluxDB or monitoring your production environment with InfluxDB, your time series operations are finally running smoothly. You want to keep it that way. You might be a Free Plan Cloud user or a Usage-Based Plan user, but either way, you need visibility into your instance size to manage resources and costs.
Why companies need URL filtering for enhanced cloud protection
The cloud landscape is rife with unsafe URLs and inappropriate content. This—coupled with the accelerated adoption of cloud applications in the workplace—has created an urgent need to scrutinize and control the use of these online resources to prevent data theft, exposure, and loss. This blog elaborates on how a robust URL filtering solution can help manage what cloud services your employees use and how they interact with these services.
5 Tips for SaMD Development
6 Key Factors for Digital Transformation Success
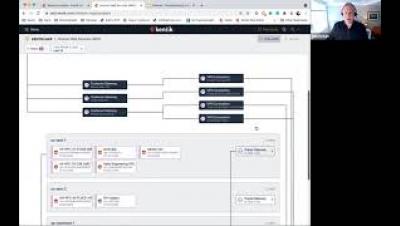
AWS Transit Gateways-Visualizing Cloud Routing with Kentik | Kentik Tech Talks, Episode 10
What Top Brands Are Saying About Splunk Observability Cloud
Customers have had a lot to say about the new Splunk Observability Cloud since we announced general availability on May 5, 2021. For the first time ever, IT and DevOps teams can get all their data in one place with unified metrics, traces and logs — collected in real time, without sampling and at any scale. What makes Splunk Observability Cloud unique from other solutions? We’ll let our customers do the talking.
Debugging with Dashbird: Lambda Task Timed Out After X Seconds
When building serverless applications, Lambda functions often form the backbone of the system. They might provide just a few lines of code, but these lines are usually what hold the whole architecture composed of many managed services together. Event-driven architecture is what this style is called, and it’s most prevalent in serverless applications. API gateways collect requests from your users, convert them to events, and send these along the way.
Elastigroup configurable auto-healing
When EC2 instances fail to serve requests the usual cause is typically hardware issues or high CPU utilization. To avoid sending traffic to instances with these issues, AWS continuously monitors instance health and routes inbound traffic accordingly. In the past Elastigroup fetched the health status for all managed instances and triggered an automatic replacement once an instance was determined as unhealthy.
How Log Analytics Powers Cloud Operations: Three Best Practices for CloudOps Engineers
Multi-tenant Architecture for SaaS Apps
A multi-tenant architecture is essentially a framework in which a common instance of a software application is used to service several client applications or tenants. This multi-tenant architecture has found extensive adoption in SaaS applications, which cater to requests from tens and thousands of clients. The main reason for the adoption of multi-tenancy is the efficient and optimal use of resources and funds, along with delivering seamless service.
Announcing new features for Cloud Monitoring's Grafana plugin
The observability of metrics is a key factor for a successful operations team, allowing for increasingly effective visualizations, analysis, and troubleshooting. Google Cloud works with third-party partners, such as Grafana Labs, to make it easy for customers to create their desired observability stack leveraging a combination of different tools. More than two years ago, we collaborated with Grafana Labs to introduce the Cloud Monitoring plugin for Grafana.
Troubleshooting AWS Serverless Applications With Lumigo
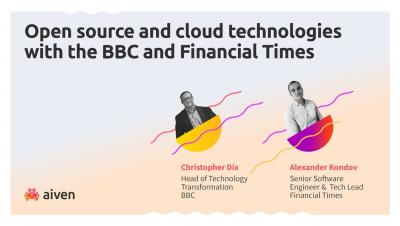
Open source and cloud technologies with the BBC and Financial Times | Aiven Webinar
A new, more streamlined experience for Elastic Cloud Enterprise admins
We’re excited to introduce usability enhancements to the Elastic Cloud Enterprise (ECE) platform administration console to simplify your experience. Administration is shifting to a host-based management and dedicated role pages for ECE proxies and control plane.
Spot + Data Mechanics: Delivering fully automated, optimized Spark on Kubernetes
After working with hundreds of customers over the last few years, we know one thing for sure at Spot by NetApp—when applications have infrastructure that is automatically optimized to meet their needs, they can scale and thrive in the cloud.
One Spot for K8s application delivery and CloudOps: Introducing Ocean CD
The widespread adoption of Kubernetes has made it table stakes for the modern cloud native stack. Software is now being purpose-built for Kubernetes, and as companies enter this new phase of their cloud journey, they are looking to scale this cloud native, Kubernetes-first model. Building upon years of experience with Kubernetes, Spot by NetApp is continuously innovating to bring new ways to help customers achieve this goal.
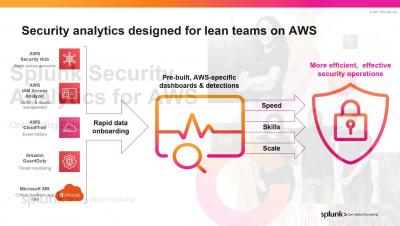
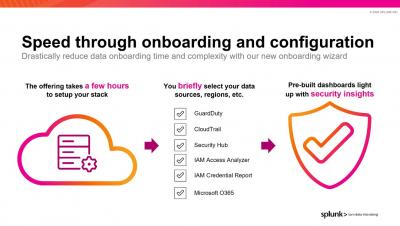
Onboarding Data in Splunk Security Analytics for AWS
Detecting and Investigating Threats in Splunk Security Analytics for AWS
What is the VA's Strategic rationale of accelerating to hybrid-cloud with AIOps?
Cycle Podcast | Episode 4 "Empowering Platforms: Stax.ai + Stratum Cloud" with Aptus Engineering
Introducing the World's First Modern Cloud-Based SecOps Platform: Splunk Security Cloud
To say that the past year presented its fair share of cybersecurity challenges to the InfoSec community would be a drastic understatement. The rapid migration to remote work at scale left 80% of CIOs unprepared, and SecOps teams struggled to confront the evolving threat landscape with disparate toolkits and skill sets. Not to mention that as more organizations shifted to hybrid and multi-cloud environments at scale, cloud complexity (and cloud-based threats) skyrocketed.
4 ways ServiceNow, Google offer seamless multicloud workflows
Siddhartha Agarwal, managing director, SaaS partnerships and co-innovation, Google Cloud at Google, co-authored this blog. When organizations embrace cloud as a core component of their IT operations, they have options: a wholesale migration to the public cloud, incremental or large-scale hybrid deployments, private clouds, or even running services across multiple clouds. More than 90% of enterprises have a multicloud strategy.
How to search for an Azure Blob
Simply open up Cloud Storage Manager, then go to the FILE and then SEARCH. Now the Search window will open up in Cloud Storage Manager. Choose the category of the item you want searched for, either an Azure Storage Account, Container, or a Blob can be searched. Type in the name of what you want to search for in the SEARCH box and then finally choose if you want an Exact Match, Starts with, Ends with or Contains, then press Search.
Deploying Sysdig from the new AWS CloudFormation Public Registry
AWS CloudFormation provides an easy way to model and set up AWS resources to help you save time in deploying the stack you need to run your applications. Today, AWS announced the launch of AWS CloudFormation Public Registry. CloudFormation Public Registry is a searchable collection of extensions that allows you to easily discover, provision, and manage resource types and modules published and maintained by AWS Partner Network (APN) partners like Sysdig.
Announcing the availability of Gremlin using AWS CloudFormation Public Registry
Get started with Gremlin's Chaos Engineering tools to safely, securely, and simply inject failure into your systems to find weaknesses before they cause customer-facing issues. We’re excited to announce that Gremlin is available on AWS CloudFormation Public Registry.
End-to-end Correlation Across Logic Apps
How To Implement Cloud Observability Like A Pro | Pepperdata
How To Control Cloud Cost and Complexity with Managed Auto-Scaling
Big Data Cloud Performance Monitoring In The Cloud: Best Practices
How To Manage Big Data Analytics In The Cloud: Best Practices
The Future Trends of Big Data, Analytics and Cloud Adoption in 2021
How To Fix Spark Performance Issues Without Thinking Too Hard
JFrog CloudFormation Modules Make Provisioning to AWS Easy and Secure
Stackery announces the availability of Bastion modules on the CloudFormation Public Registry
AWS CloudFormation Modules, now available for public use through the AWS CloudFormation Public Registry, are a huge step forward for enterprise IT teams to create large manageable Infrastructure-as-Code (IaC) practices around CloudFormation. We’re excited to support the launch today with our own Bastion module. Unsure what Modules are? Read on.
Automated App Modernization: The Smarter Cloud Migration Approach
Thinking of migrating applications to cloud through a lift and shift approach? It could be a time to rethink your plan and take control of your migration journey, in a secure way. According to Markets and Markets, the global application modernization services market size is expected to grow from USD 11.4 billion in 2020 to USD 24.8 billion by 2025, at a Compound Annual Growth Rate (CAGR) of 16.8% during the forecast period. And the numbers are not stopping there!
Cloud on the Bar with Ulrich Homann
Spot by NetApp joins AWS CloudFormation Public Registry
Repetition is super helpful when learning something new. But eventually we get tired of repetitive tasks, errors start creeping in and the tedium saps us of the creative energy we need to innovate and problem-solve. This is why here at Spot by NetApp we love AWS CloudFormation. It decreases errors, frees teams to focus on their core tasks and when used with our products, helps to dramatically optimize cloud infrastructure cost and utilization.
New Research by IDC, Sponsored by PagerDuty, Explores How Organizations Can Reach CloudOps Maturity
Many organizations have made the shift to the cloud in recent years, and many more are planning to or are just starting their cloud migration journeys now. However, some organizations struggle to realize value from this move. The benefits of cloud are clear: it’s flexible, scalable, and has a low cost of entry. But cloud can also bring complexity—creating new interdependencies, more services to manage, and more data and signals to monitor.
How to set up Elastic Cloud: Advice from Elastic Support
I hate reinventing the wheel once I find a good setup. On top of that, I dislike searching for all the links I used to come up with the “ultimate setup” for different services. So, I decided to outline for myself (and for you of course) my default setup when I deploy on Elastic Cloud to set myself up for success and automate insight for the future. Most of my setup steps make monitoring accessible or automate various warnings to myself.
Organizations Grapple with Skyrocketing Cloud Costs, Anodot Survey Finds
The pandemic upended business for many or at the very least cast a grim shade of uncertainty, so, as many took to working from home, they also were commissioned with cutting waste. Among the biggest sources of misspend in 2020 – cloud services. And remote work may have actually spurred the problem, as organizations migrate more applications to the cloud to support these workers.
Tutorial: Set Up Event Streams in CloudWatch
When building a microservices system, configuring events to trigger additional logic using an event stream is highly valuable. One common use case is receiving notifications when errors are seen in one of your APIs. Ideally, when errors occur at a specific rate or frequency, you want your system to detect that and send your DevOps team a notification. Since AWS APIs often use stateless functions like Lambdas, you need to include a tracking mechanism to send these notifications manually.
Deploy an app on AWS in 25 seconds with Qovery v2
From zero to hero - here is a short video to show how to deploy an app from scratch on AWS with Qovery v2 - this video is linked to https://www.qovery.com/blog/one-week-before-the-launch-of-qovery-v2-beta-whats-new
Fully Managed Data Analytic Service Optimized for Large volume of Streaming Data
FinOps Best Practices at Autodesk
What Is Cloud Automation? Here's Everything You Need To Know
How D2iQ Fits Into The Broader CNCF Kubernetes Ecosystem
In order to run Kubernetes in production, you need more than just the base Kubernetes, but a variety of other necessary add-on services, such as monitoring, security, disaster recovery, and more. However, navigating the cloud-native ecosystem is complex and rapidly changing, making it difficult to build a robust production platform required to run mission critical business services.
AWS updates for serverless builders in 2021
In this article, we’re covering all the latest updates from AWS in 2021 that serverless builders should be aware of. Before we start, let’s recall a few significant updates in serverless, announced at re:Invent 2020. One of the things that we see is that agility is really one of the primary drivers to one’s workload in the cloud and serverless is a good example of this. But the discussion often starts with cost.
Go Cloud-Native or Go Home
The movement away from on-premise and towards the Cloud is unstoppable. Even the US government is on board with their plans to “accelerate movement to secure cloud services, including Software as a Service (SaaS), Infrastructure as a Service (IaaS), and Platform as a Service (PaaS).” On-prem software is deployed, hosted, and maintained by your organization.
How to manage a 24×7 private cloud with one engineer
In the last several years, we have witnessed the creation of many technologies, starting with the cloud and going further to machine learning, artificial intelligence, IoT, big data, robotics, automation and much more. The more the tech evolves, the more organizations thrive to adopt these technologies seeking digital transformation and disrupting industries along their journey, all for the benefit of better serving their consumers.
Azure Storage Types: What are they?
Microsoft Azure Storage system is a cloud storage technology designed for current data storage environments. A highly available object store for data objects, disc storage for Azure virtual machines (VMs), a command-line service for the cloud, a messaging store for trustworthy communications, and a NoSQL store are all available through core storage services. They are long-lasting, accessible, flexible, maintained, and safe and readily available.
Segment vs Rudderstack vs alternatives in 2021 - Go Data Warehouse-first?
For marketing and product teams in 2021, using a customer data platform (or CDP) to pipe and clean data from their websites and web apps to various other services have become a widely used industry standard. More specifically, Segment's adoption has skyrocketed in startups and later stage companies and I predict their growth to continue across enterprises with their acquisition into Twilio.
Bad guys are watching for new openings in your cloud, are you?
You see the headlines, and perhaps, ‘thank goodness it wasn’t us’ flickers through your mind. An overly permissive web server exposes 100 million+ consumer credit applications, or an S3 bucket leaves hundreds of millions of user records open to the public. A nightmare scenario for any CISO and their cloud security team!
Continuously deploy custom images to an Azure container registry
The Azure container registry is Microsoft’s own hosting platform for Docker images. It is a private registry where you can store and manage private docker container images and other related artifacts. These images can then be pulled and run locally or used for container-based deployments to hosting platforms. In this tutorial, you will learn how to create a custom docker image and continuously deploy it to an Azure container registry.
Cloud Governance Explained: How To Create An Effective Governance Strategy
Introducing Ubuntu Pro for Google Cloud
June 14th, 2021: Canonical and Google Cloud today announce Ubuntu Pro on Google Cloud, a new Ubuntu offering available to all Google Cloud users. Ubuntu Pro on Google Cloud allows instant access to security patching covering thousands of open source applications for up to 10 years and critical compliance features essential to running workloads in regulated environments. Google Cloud has long partnered with Canonical to offer innovative developer solutions, from desktop to Kubernetes and AI/ML.
Five worthy reads: Confidential computing - The way forward in cloud security
Five worthy reads is a regular column on five noteworthy items we’ve discovered while researching trending and timeless topics. In light of rising concerns over cloud cybersecurity, this week we explore the concept of confidential computing. The past year has seen strong adoption of cloud technologies due to accelerated digital transformation and a cloud-first approach in business.
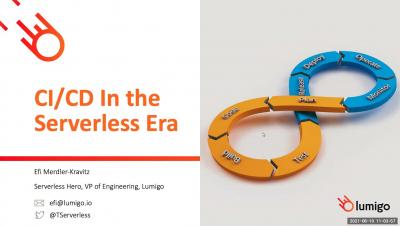
Making CI/CD Work with Serverless
Monitor AWS control plane API usage metrics in Datadog
AWS Service Quotas helps you manage limits on the number of resources or API operations that are possible for a given AWS service. Hitting such limits could cause operational disruptions related to getting rate limited on the critical APIs that your applications rely on or being unable to provision additional AWS resources.
Enabling You to Get the Best from AWS: Introducing the New Calico AWS Expert Certification
Calico is the industry standard for Kubernetes networking and security. It offers a proven platform for your workloads across a huge range of environments, including cloud, hybrid, and on-premises. Given this incredibly wide support, why did we decide to create a course specifically about AWS?
Is Real-Time Processing Worth It For Your Analytical Use Cases?
Real-time processing provides a notable advantage over batch processing — data becomes available to consumers faster. In the traditional ETL, you would not be able to analyze events from today until tomorrow’s nightly jobs would finish. These days, many businesses rely on data being available within minutes, seconds, or even milliseconds. With streaming technologies, we no longer need to wait for scheduled batch jobs to see new data events.
Press Release: iLert achieves Amazon RDS Ready designation
Cologne, Germany – iLert GmbH, a SaaS company for alerting, on-call management, and uptime monitoring, announced today that it has achieved the Amazon RDS Ready designation, part of the Amazon Web Services, Inc. (AWS) Service Ready Program. This designation recognizes that iLert has demonstrated successful integration with Amazon Relational Database Service (Amazon RDS).
Multi-Project Cloud Monitoring made easier
Customers need scale and flexibility from their cloud and this extends into supporting services such as monitoring and logging. Google Cloud’s Monitoring and Logging observability services are built on the same platforms used by all of Google that handle over 16 million metrics queries per second, 2.5 exabytes of logs per month, and over 14 quadrillion metric points on disk, as of 2020.
FinOps for Cloud & Container Infrastructure
Understanding Serverless Observability
Ideally, observability should help you understand the state of your application and how it performs under different circumstances. However, while serverless observability may seem similar to serverless monitoring and testing, the three achieve different goals. Testing helps you check your application for known issues, and monitoring helps you evaluate system health according to known metrics. Observability helps you search and discover unknown issues, providing end-to-end visibility.
What Is Cloud Optimization? (And Why Is It Important?)
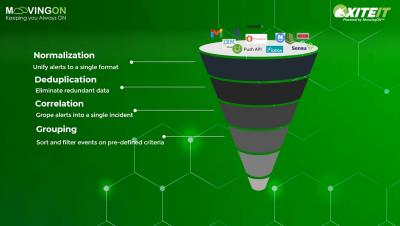
Turn knowledge into Automation
Monitor Azure using Applications Manager
Microsoft Azure is the fastest growing cloud platform at the moment. Many organizations use Microsoft Azure to quickly build and deliver cloud services that can scale or to migrate existing workloads to the cloud. However, larger and faster cloud services can quickly increase the complexity of a network. To solve this and ensure business-critical workloads run correctly, IT teams need deep visibility into their Azure environments.
Cycle Podcast | Episode 3 "New Portal"
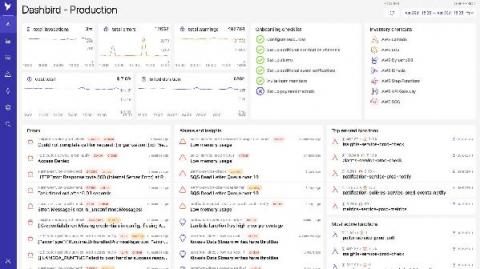
Dashbird app launches new version
The new Dashbird app is bringing your data together for a faster, more secure, and smoother observability experience with team collaboration in mind. The enhanced version of the Dashbird app is making your account more secure and your app navigation and data exploration faster, more intuitive, and all-around enjoyable. Additionally, you can now enable multi-factor authentication (MFA) for your Dashbird account. Check it out now!
Ensure Cloud Security With These Key Metrics
EMR workload continuity with Elastigroup
Amazon’s Elastic Map Reduce or EMR, makes it easy to set up, operate and scale big data environments. This enables data scientists and developers to rapidly analyze massive amounts of structured and unstructured data. Combined with Spot by NetApp’s Elastigroup, data scientists can reliably run EMR core and task nodes on highly affordable EC2 spot instances.
How Lowe's meets customer demand with Google SRE practices
At Lowe’s, we’ve made significant progress in our multiyear technology transformation. To modernize our systems and build new capabilities for our customers and associates, we leverage Google’s SRE framework and Google Cloud, which helps us meet their needs faster and more effectively. With these efforts, we’ve been able to go from one release every two weeks to 20+ releases daily—about 20X more releases per month.
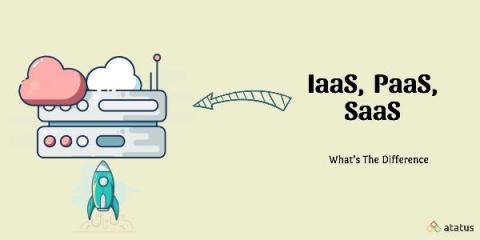
What is IaaS? How IaaS Different from SaaS and PaaS?
The cloud is a hot topic for everyone from small companies to multinational corporations, but it's also a vast term that covers a lot of online ground. It's more important than ever to appreciate the differences and benefits of the different cloud providers when you consider moving your company to the cloud, whether for application or infrastructure deployment. Infrastructure-as-a-service (IaaS) is a cloud-based service that provides virtualized computing resources to businesses over the internet.
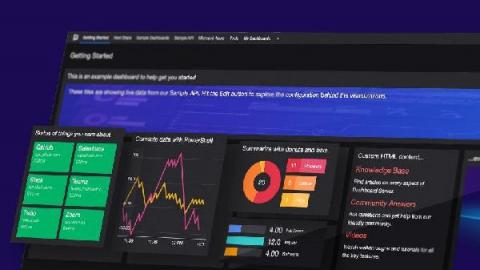
Build a CircleCI Dashboard to visualize all your CI/CD data
If you’ve checked out SquaredUp for SCOM/Azure and decided for one reason or another that it wasn’t the right tool for you, you are in for a treat! Our latest free tool, Dashboard Server, addresses many of the same pain points, but this time, for a variety of platforms not tied to SCOM or Azure. On the flip side, if you’re currently using SquaredUp for SCOM/Azure, don’t click away!
Terraform and Spot Ocean
Azure Monitor for Windows Virtual Desktop (WVD)
At the end of March 2021, Microsoft released Azure Monitor for Windows Virtual Desktop (WVD) for General Availability. Built upon Azure Monitor Workbooks to give insights into the Windows Virtual Desktop environment, including: Connection Diagnostics, Connection Performance, Host Diagnostics, Host Performance, Utilizations, Users, Clients and Alerts.
Decoding Azure Service Bus Exceptions for Operational Excellence
Anodot vs. AWS: Which Has the Most Accurate Cloud Cost Forecasts?
The move to cloud computing has been a no-brainer for many enterprise companies. But cloud computing is an expense that, unlike many other operating costs, is largely variable. Many companies — including the fastest-growing startups, largest enterprises, and leading government agencies — choose AWS to help them streamline fragmented processes, reduce costs, become more agile, and innovate faster.
Debugging with Dashbird: Resolving the Most Common API Gateway Request Errors
Adding an API Gateway to your application is a good way to centralize some work you usually have to do for all of your API routes, like authentication or validation. But like every software system, it comes with its own problems. Solving errors in the cloud isn’t always straightforward, and API Gateway isn’t an exception. AWS API Gateway is an HTTP gateway, and as such, it uses the well-known HTTP status codes to convey its errors to you.
Integration of Enterprise Alert 9 with AzureMonitor
Our Azure Monitor connector provides seamless 2-way integration of Enterprise Alert 9 with Azure Monitor. Once added to your Enterprise Alert instance, the connector will read your Azure Monitor alerts fully automatically and trigger alert notifications, e.g. to your team members on duty. It also synchronizes the alert status from Enterprise Alert 9 to Azure Monitor so that if alerts are acknowledged or closed, this status is also updated on the according alert in Azure Monitor.
Event-driven autoscaling in Kubernetes
In modern cloud architecture applications are broken down into independent building blocks usually as microservices. These microservices allow teams to be more agile and deploy faster. Microservices form distributed systems in which communication between them is critical in order to create the unified system. A good practice for such communication is to implement an event-driven architecture.
Open source and cloud technologies for retail and e-commerce | Aiven Webinar
AWS Kinesis vs SNS vs SQS (with Python examples)
How to choose a decoupling service that suits your use case? In this article we’ll take you though some comparisons between AWS services – Kinesis vs SNS vs SQS – that allow you to decouple sending and receiving data. We’ll show you examples using Python to help you choose a decoupling service that suits your use case. Decoupling offers a myriad of advantages, but choosing the right tool for the job may be challenging.


