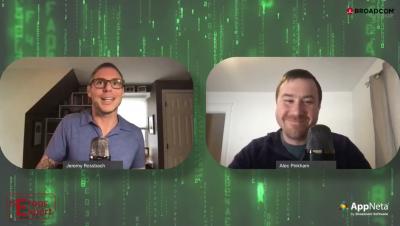
Have you ever experienced user complaints and struggled to find the root cause of the performance degradation? I'm sure every IT operations professional has. Is it the application? Is it the underlying infrastructure? Is it the network? What if you have a single pane of glass that will gather all the relevant metrics and telemetry and display it in an intuitive and easy to understand fashion?
Event ingestion is one of the most mission-critical components at Sentry, so it’s only natural that we constantly strive to improve its scalability and efficiency. In this blog post, we want to share our journey of designing and building a distributed ingestion infrastructure—Sentry Points of Presence— that handles billions of events per day and helps thousands of organizations see what actually matters and solve critical issues quickly.
Network monitoring is a set of automatic processes that help to detect the status of each element of your network infrastructure. We are talking about routers, switches, access points, specific servers, intermediate network elements, and other related systems or applications (such as web servers, web applications, or database servers).In other words, network monitoring can be understood as taking a look at all the connected elements that are relevant to you or your organization.
In response to the explosive growth of Internet of Things (IoT) devices, organizations are embracing edge computing systems to better access and understand the enormous amount of data produced by these devices. As the name suggests, edge computing moves some storage and computing resources out of the central data center and closer to where the data is generated at the edge of the network, whether that’s a factory floor, retail store, or automated car.
In part 1 of our synthetics series, we looked at tracking network performance to drive better business outcomes. Here in part 2 of our series, we’ll dig into the very first and most basic business outcome of using digital experience monitoring (DEM). That is, we’ll look at how to protect and grow revenue by proactively monitoring the health, availability and uptime of your critical applications and services, so you can fix issues before your customers’ experience suffers.
The global march towards delivering operational resilience across the financial sector steadily continues.
What’s your network doing right now? Where is traffic flowing to, and where’s it coming from? Are there bottlenecks you don’t know about? Where’s the next problem going to be? Network traffic pattern analysis answers these questions and more. It’s a way for you to examine how your clients use your networks. You may think you know how heavily your clients utilize each segment and VLAN and where the weak points are. But do you?
After a year of hard work, Obkio is proud to announce the release of our brand new free Visual Traceroute tool! Learn about the story behind our new tool and how IT pros can leverage Obkio Vision visual traceroute tool to quickly identify and troubleshoot network and Internet problems faster than ever before.
What do big mountain ascents and modern network operations have in common? You’ll only succeed when you’re learning from experience. This was one among many compelling takeaways that attendees took from our recent NetOps Summit. Centered on the theme “visibility anywhere,” this event featured a number of compelling presentations, including a keynote from Jimmy Chin, the professional climber, photographer, and Academy Award-winning filmmaker.
Any new technological breakthrough tends to be greeted by two opposing factions. On one hand, you have promoters, for whom this technology is a panacea, the cure for every ailment plaguing the current environment.
Obkio releases a new macOS Monitoring Agent to allow users to monitor network performance on macOS to identify and troubleshoot network problems.
Surge Protection helps prevent denial of service (DOS) attacks. Cloud 66 automatically blocks any IP address that makes more than 1,500 requests per minute to your server(s).
WhatsUp Gold provides specialized Voice over Internet Protocol (VoIP) Service Level Agreement (SLA) monitoring necessary for tracking Quality of Service (QoS) and SLA metrics for your network of deployed VoIP devices (telephones, conference room devices and more). After you discover and configure devices for VoIP monitoring, you can view results and graphs on the WhatsUp Gold Custom Performance Monitors dashboard.
Learn about Obkio’s new Monitoring Agent hosted by Canadian IT service and solutions provider, Bravad ITm to help Bravad identify and troubleshoot network problems faster than ever before.
The Ops agent is Google’s recommended agent for collating your application’s telemetry data, and forwarding them to GCP for visualization, alerting and monitoring. The Ops agent collates logs and a metrics collector into one single powerhouse. Some of the key advantages of using the Ops agent are outlined below.
Network downtime opens the gates to productivity loss and customer attrition and can affect business growth moderately or even severely. Usually, the reasons behind a network outage are the following: Errors in network endpoints: Things like a network bottleneck or a spike in temperature can interrupt a client’s network operations and then snowball into an outage. Operational slip-ups: According to research done by Uptime Institute, 70% of data center and service downtime is due to human error.
ScienceLogic customers are well-aware of the challenges inherent with the growing complexity of their IT infrastructures. That’s why you’re making investments in digital transformation and adopted SL1 as your AIOps platform of choice for your IT operations monitoring and management strategy.
In episode 11 of Network AF, Avi talks with Jezzibell Gilmore, co-founder and chief commercial officer (CCO) of PacketFabric. Jezzibell is a powerful woman in networking who is modernizing and paving the way for infrastructure in the digital universe. In the conversation, she shares how she’s weaving together technology, business drivers and cutting-edge innovation, while keeping her foot firmly on the ground.
Part of our job here at Progress is to not only look at the challenges our customers are currently facing, but also to look at the technology landscape in general and consider the challenges they’re going to be facing. We don’t have a crystal ball, of course, but there are a plenty of trends that are obvious to even the most casual observer. Security has always been important, but the last year has made it clear exactly how important it is for every organization with a network.
Financial services firms face three key network issues: maintaining compliance with an array of regulations, keeping a growing horde of financial data hungry hackers at bay, and earning the trust of users with an always-on responsive network. Financial data is so valuable, cybercriminals make getting it a top priority. And financial services networks are so interconnected and complex, there are all sorts of ways hackers can try to break in. The security threat to finance is more than bad.
This blog post discusses some of the best practices for balancing the costs of cloud traffic monitoring while maintaining a reasonable level of visibility. Progress Flowmon 12 has introduced the processing of native flow logs from Google Cloud and Microsoft Azure, plus it has enhanced support for Amazon Web Services (AWS) flow logs.
One of our most requested and popular features, IP ranges for the Docker executor, recently became available to all customers on a Performance or Scale plan. With IP ranges, you can route job traffic through an IP address that is verifiably associated with CircleCI. This enables your team to meet compliance requirements by limiting the connections that communicate with your infrastructure. With any new feature, you want to know how much it’s going to cost your team.
Having any form of application discovery can be of great benefit. With these capabilities, you can determine what is deployed within your infrastructure and better understand what monitoring to apply to each device. When you know which applications are running within your environment, you can group devices by their associated applications.
The jitter and latency are the characteristics related to the flow in the application layer. Jitter and latency are the metrics used to assess the network's performance. The major distinction between jitter and latency is that latency is defined as a delay via the network, whereas jitter is defined as a change in the amount of latency. Increases in jitter and latency have a negative impact on network performance, therefore it's critical to monitor them regularly.
If you’re running earlier versions of Application Performance Management (APM), including version 10.7, on-premises and considering upgrading to DX APM SaaS, you’re undoubtedly curious what the migration process might look like. In this blog post, I’m going to share the story of one of Broadcom’s Fortune 50 customers and how they successfully migrated more than 30,000 production agents while navigating time constraints around their busy holiday season.
According to Gartner, by 2023, 60% of enterprises will phase out their VPN in favor of Zero Trust Network Access (ZTNA). In this blog, discover the four key advantages of ZTNA vs VPN. VPN (Virtual Private Network) has been the dominant solution securing remote access for users and has been considered a good solution for almost three decades. VPN benefits included keeping data secure, protecting online privacy, and reducing bandwidth throttling.
It is always big news when governmental organizations are attacked. And they are attacked frequently. Hackers love headlines, which is one reason to go after high profile government targets. But the real reason hackers love governmental organizations is because that’s where the juicy data is. Even small governmental organizations hold confidential and classified information—exactly the secrets state-sponsored groups and other cybercriminals drool over.
Modern enterprise and SME networks are complex constructions. They comprise on-premises network equipment and servers, multiple public cloud infrastructure components, operational technology links to monitor physical items, edge networks, and large numbers of endpoint devices that connect from various locations over many different networks.
There’s little doubt that a lot has changed when it comes to network design, specification and build. The seemingly simple goal of carrying traffic from point A to point B might remain, but these days it comes with a long list of options and alternatives to cover a wide range of network architectures, content providers and service types, all of which might have different requirements for bandwidth, latency, and availability.
I am excited about the upcoming Optical Fiber & Communications (OFC 2022) Conference in San Diego for several reasons. Not only will it be the first in-person conference that I have attended in more than two years due to the pandemic, but the thing that I am most excited about is the fact that Ribbon will be showcasing our new IP Wave offering at the show.
HAProxy and HAProxy Enterprise collect a vast amount of information about the health of your applications being load balanced. That data, which uses the Prometheus text-based format for metrics, is published to a web page hosted by the load balancer, and since many application performance monitoring (APM) tools can integrate with Prometheus, it’s likely that you can visualize the data using the APM software you already have.
Reader’s note: On Friday, March 4, we published this blog post to comment on Cogent’s decision to terminate their commercial relationships with their Russian customers. Today, March 7, another international telecom, Lumen, announced that it will also take action. We’ve updated this blog post to reflect the latest information we have.
We sympathize with the IT teams that keep their networks running – we really do. We understand it’s a thankless job where they’re ignored if everything’s working and blamed when everything’s not. That’s why we’ve tried to make our network infrastructure and application experience (AX) products as simple and intuitive as possible.
As the demand for media-rich content grows, so do the performance expectations of consumers. One of the greatest challenges online businesses face is to deliver large amounts of content to audiences spread out across the globe as quickly as possible. The solution is a content delivery network (CDN).
No matter which one you choose, all PerfOps products are about the data. We’re committed to providing high-value DNS, CDN, and Cloud analytics for providers and businesses. The data derived from our analytics software is the most accurate and robust DNS, CDN, and Cloud data in the world. Rest assured, as far as providers go, there are no “red-headed stepchildren” here. No bias. No number skewing. The data is what the data is. Pure and simple.
Experiencing network issues is inevitable - but they don’t need to derail your entire work day. The faster you troubleshoot network problems, the quicker you can get back to peak productivity. In this article, we’re teaching you how to troubleshoot network issues using Network Troubleshooting tools.
The peering coordinator’s toolbox is a blog series where we dive deep into the peering coordinator workflow and show how the right tools can help you be successful in your role.
Flowmon 12 Pushes the Boundaries of Cloud Monitoring. Bring your cloud monitoring strategy to the next level with new support for native flow logs from Google Cloud & Microsoft Azure + enhanced support of AWS (Amazon Web Services).
IT operations managers know that data is vital to understanding the health, availability, and reliability of their enterprises, and to making informed decisions about how to run their enterprises at peak efficiency.
Winners make good decisions fast, execute them quickly, and see higher growth rates and/or overall returns from their decisions. That’s according to a McKinsey study, ‘Decision-Making In The Age Of Urgency’. But the same study also pointed out that ineffective decision-making has significant implications for company productivity today. On average, survey respondents said they spent 37 percent of their time making decisions.
IT pros in the healthcare industry have one of the toughest jobs imaginable. Herculean task number one is protecting patient data, with failure to do so bringing hefty HIPAA fines and more than a little bad press. Gargantuan task number two is stopping breaches (and then doing forensics if one busts through). Failing either of these is not exactly a confidence booster. Don’t forget, almost all hacks and breaches either attack the network itself or go across it to reach their target.
Businesses now scale exponentially and so do their networks. Managing a hybrid IT environment that comprises wired, wireless, and virtual networks can be a challenging task for network administrators. However, continuous monitoring of these devices for fault and performance is crucial. Network discovery is key to successful monitoring solutions.
Crowdsourcing is becoming an essential part of many enterprises, from big companies to startups. This is because it is an incredible way of creating an ecosystem to facilitate different processes within a business. Leveraging the Exoprise platform, companies can benchmark their slow proxies, detect, and fix slow network experiences. Crowdsourcing entails getting information, goods, or services from disparate people worldwide. Often, crowdsourcing is made possible through the magic of cloud-based applications and platforms because of the way the Internet connects people and organizations. Exoprise specializes in crowdsourced monitoring of cloud and SaaS services. We call it crowd-powered.
What fun is network observability if you can’t share what you see? That’s why we’ve added public link sharing to the Kentik platform. One of the greater missions of network observability is to break the boundaries of conventional monitoring. At Kentik, we focused our initial efforts on making complex infrastructure problems easy to visualize, understand and resolve. Now we’re tackling a follow-up mandate: to democratize network observability.
HAProxy is one of the most popular software around when it comes to load balancers and reverse proxies. When you’re using it for these purposes, it’s especially important to monitor for both availability and performance, which will impact your SLI and SLOs. In this post, we’ll talk about the main HAProxy metrics you should monitor and the best monitoring tools you can use to measure them.
In any organization, the IT operations teams bear the responsibility of providing reliable cloud services to users that are increasingly distributed, working from home, the office, or elsewhere. As a result, IT professionals are looking for solutions to achieve visibility of the user’s network from end to end to quickly identify and resolve bottlenecks and ensure maximum productivity and ROI of their cloud applications.