LiveLogs - Cloud 66 Demo
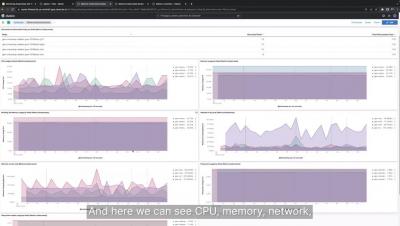
LiveLogs is Cloud 66’s real-time logging interface. It allows you to monitor your app via the Cloud 66 Dashboard. You can set up custom Live Logs via your Manifest file. What is Cloud 66? Cloud 66 gives you everything you need to build, deploy and maintain your applications on any cloud, without the headache of dealing with “server stuff”.