Operations | Monitoring | ITSM | DevOps | Cloud

Monitoring

The latest News and Information on Monitoring for Websites, Applications, APIs, Infrastructure, and other technologies.

Tutorial: Setting up AWS CloudWatch Alarms

AWS CloudWatch is a service that allows you to monitor and manage deployed applications and resources within your AWS account and region. It contains tools that help you process and use logs from various AWS services to understand, troubleshoot, and optimize deployed services. I’m going to show you how to get an email when your Lambda logs over a certain number of events.

Using Jaeger for your microservices

Jaeger is a popular open-source tool used for distributed tracing in a microservice architecture. In a microservice architecture, a user request or transaction can travel across hundreds of services before serving what a user wants. Distributed tracing helps to track the performance of a transaction across multiple services. Before we deep dive into how Jaeger accomplishes distributed tracing for microservices-based architecture, let's take a short detour to understand distributed tracing.

Telegraf Integrations with Logz.io

Logz.io is proud to announce a slew of new integrations via Telegraf. Logz.io utilizes Prometheus in its product, but aims to support compatibility across common DevOps tools. A number of our customers, and the community in general, are strong users of Telegraf and its companion apps in the TICK Stack (which includes InfluxDB). Telegraf is not as popular as Prometheus, but it’s a strong element in the DevOps toolbox.

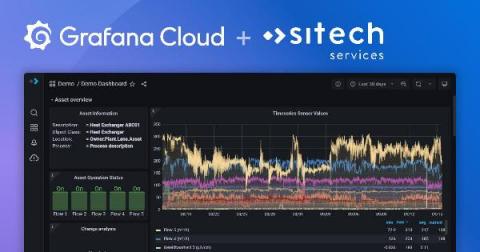
How Sitech builds modern industrial IoT monitoring solutions on Grafana Cloud

Chemelot is an industrial park in the Netherlands with more than 150 companies in chemical and process industries that are working to build the most sustainable and competitive chemical site in Western Europe. Sitech Services is part of making that happen. The Dutch technology firm brings together maintenance and engineering specialists with data scientists to create multidisciplinary solutions that achieve optimal safety, efficient infrastructure, and efficient processes for the plants.

What is Proactive Monitoring?

In the realm of monitoring products, proactive monitoring usually means identifying potential issues within IT infrastructure and applications before users notice and complain and initiating actions to avoid the issue from becoming user noticeable and business impacting. Proactive monitoring means a business is continuously searching for signs that indicate a problem is about to happen.

Tracing Issues in Your Application

Imagine that you are receiving a support ticket that your application is not working. You read the attached stack trace and now it's time to solve the mystery—what did the user do that led to triggering this exception? Is it possible to find all the logs from all the applications that correspond to this user's business operation? What if the user is complaining that the system is slow? How can you decide which concrete operation is the culprit? Is there any way to visualize the latency?

A look at the upcoming improvements to LINQ in .NET 6

When .NET Framework 3.5 was released back in 2007 it included a new feature known as Language Integrated Query, or LINQ for short. LINQ allows .NET developers to write efficient C# code using arrow functions to query collections of objects or even databases using libraries like Entity Framework Core. Like all things with .NET, LINQ continues to evolve over time. The upcoming release of .NET 6 brings a number of really interesting features, including a suite of new LINQ capabilities.