Container Network Observability
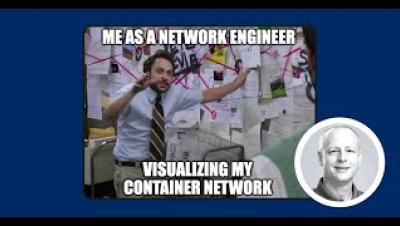
Justin Ryburn describes the complexities of managing the network in a modern Kubernetes deployment and how Kentik can provide observability. Leveraging eBPF technology allows network engineers the ability to visualize and make sense of the network traffic within the Kubernetes cluster, as well as traffic entering and leaving the cluster. Justin wraps up with a brief demo of Kentik’s beta Kentik Kube functionality.