Operations | Monitoring | ITSM | DevOps | Cloud

Monitoring

The latest News and Information on Monitoring for Websites, Applications, APIs, Infrastructure, and other technologies.

Elastic Observability: Driving mean time to resolution to zero

At ElasticON Global 2021, Tanya Bragin, VP Product, Observability, and the Elastic Observability team showed how ongoing innovations continue to deliver actionable insights and faster root cause detection, reducing mean time to resolution (MTTR). The adoption of cloud, microservices, and ephemeral infrastructure is driving increased complexity, requiring an observability solution to provide end-to-end visibility.

Announcing General Availability of the Honeycomb Query Data API

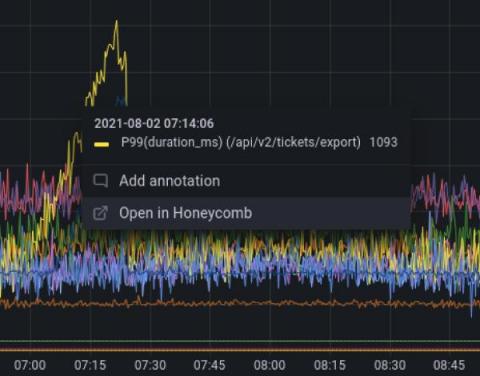
The Query Data API is a Honeycomb Enterprise feature. With a Honeycomb Enterprise account, you can use this API today. Head over to our API docs to learn how to get access to your data. If you aren’t yet a Honeycomb Enterprise user, try it out by requesting an Enterprise Trial. Starting today, Honeycomb Enterprise customers can use the Honeycomb Query Data API to programmatically run queries and retrieve their results, and pull query results into any data visualization tool of their choice.

Monitoring Kubernetes with Prometheus

Kubernetes is among the emerging open-source products expanding in the market at a very fast rate. It is a portable, extensible, and open-source platform used for managing containerized workloads and services. Companies are widely adopting it for the development of their major products. Docker is always used for running Kubernetes servers on local systems for testing purposes. It becomes essential for companies to monitor their Kubernetes container.

Reliable Alerting with Icinga and SIGNL4

You’ve probably been in this situation before – you’re using Icinga to monitor your infrastructure and Icinga detects a critical issue but nobody notices it. It might be an urgent maintenance request, an unexpected breakdown, or a service quality issue. But your technicians or service engineers are neither in the control room nor in front of the dashboard to see the issue and its urgency.

20 KPIs Your MSP Should be Tracking (Webinar)

As an MSP owner or manager, you want your teams to be continually improving and increasing efficiency. To make that happen, you know you need to be tracking MSP KPIs—after all, what gets measured gets improved. But which numbers do you track, how many do you track, and how do you actually use them to get better?

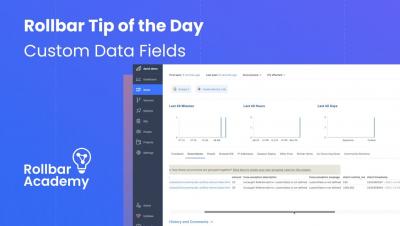
Rollbar Pro Tips: Custom Data Fields

Rollbar will accept and report any additional data fields that you choose to configure, allowing you to send extra data with each occurrence payload. This extra data can be used for things like analytics, custom grouping, and alert routing. Rollbar is the leading continuous code improvement platform that proactively discovers, predicts, and remediates errors with real-time AI-assisted workflows. With Rollbar, developers continually improve their code and constantly innovate rather than spending time monitoring, investigating, and debugging.

Better Kubernetes application monitoring with GKE workload metrics

The newly released 2021 Accelerate State of DevOps Report found that teams who excel at modern operational practices are 1.4 times more likely to report greater software delivery and operational performance and 1.8 times more likely to report better business outcomes. A foundational element of modern operational practices is having monitoring tooling in place to track, analyze, and alert on important metrics.