Operations | Monitoring | ITSM | DevOps | Cloud

The latest News and Information on Monitoring for Websites, Applications, APIs, Infrastructure, and other technologies.

Martello in Motion - University of New Hampshire

Founded in 1866, the University of New Hampshire (UNH) is a public research university with its main campus spread across 2,600 acres in Durham, New Hampshire. For more than 154 years, UNH has delivered hands-on learning, research, and work experiences that bring together students, faculty, and private and public partners to create life-changing opportunities and innovative solutions across the world.

Datadog On eBPF

eBPF (extended Berkeley Packet Filter) is a Linux technology that can run sandboxed programs in the kernel without changing kernel source code or loading kernel modules. While the kernel is an ideal place to implement monitoring/observability, networking, and security it wasn't until the recent broad adoption of eBPF that it was feasible. Datadog has embraced the possibilities that eBPF brings in those areas and there are several teams already using eBPF in their products. 

Auto-instrumenting a Java Spring Boot application for traces and logs using OpenTelemetry and Grafana Tempo

Auto-instrumentation is a subject I have not had much experience with. Here at Grafana Labs, we primarily develop in Go, which doesn’t afford such luxuries. However, there is an enormous amount of interest from the community in Java auto-instrumentation, so I set out to determine what was possible using the shiny new OpenTelemetry auto-instrumentation libraries.

SquaredUp helps customers save 20% of Azure costs

Are you suffering from overspending in Azure, lack of cost visibility and lack of context? You’re not alone; Azure cost management is a problem we hear about time and time again. That is why we created top-notch cost tiles that would allow users to build the perfect Azure cost dashboard, and help them quickly identify overspends and expensive resources in their Azure tenant.

LogicTalks: Meeting the Moment and Needs of LM Customers

In this mash-up of previously recorded LogicTalks hear how LogicMonitor meets the moment and needs of our clients. Whether you're migrating to the cloud, looking to reduce the sprawl of monitoring tools, expedite onboarding of new endpoints, or wanting to leverage AIOps features like dynamic thresholds and predictive forecasting, learn how LogicMonitor looks to partner with our clients to drive digital transformation and give you visibility into every corner of your diverse infrastructure.

Introduction to StatsD

StatsD is an industry-standard technology stack for monitoring applications and instrumenting any piece of software to deliver custom metrics. The StatsD architecture is based on delivering the metrics via UDP packets from any application to a central statsD server. Although the original StatsD server was written in Node.js, there are many implementations today, with Netdata being one of them.

Removing the Chaos Between Monitoring and Incident Management

The monitoring and incident management process is often chaotic and time-consuming for organizations. However, there is a better way to approach IT incidents and make your existing process function better. Topology and relationship-based observability solutions take the incident management process from chaotic to structured. Let’s look into how StackState’s solution improves and speeds up the incident resolution process.

A Dashboard Guide for IT Operations Metrics

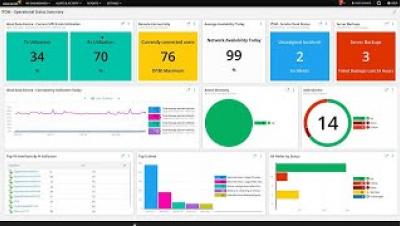
As one of the three pillars of observability, along with logs and traces, digesting metrics is a crucial part of any ITOps admins’ job. Metrics are a numeric representation of data measured over intervals of time and thus can derive knowledge of system behavior historically, which can help predict future patterns of behavior and inform investigations of issues and incidents.

Smarter ITSI Episodes Powered by Community Detection Algorithms

In this blog we are going to describe how you can create a notable event policy in IT Service Intelligence (ITSI) that is able to group your events using labels generated by unsupervised machine learning in the Smart ITSI Insights App for Splunk – and don’t worry you don’t have to be a data scientist to read this blog!