Monitoring is often not the first thing on the mind of the modern developer. Yet, it’s necessary at many points of the software development lifecycle, including: before deprecating an API, before launching a new feature, after launching the feature, and more. In fact, monitoring needs can vary much more than the classic Ops monitoring.
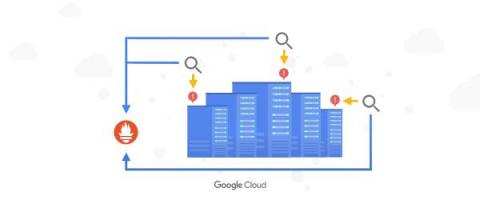
According to a recent CNCF survey, 86% of the cloud native community reports that they use Prometheus for observability. As Prometheus becomes more of a standard, an increasing number of developers are becoming fluent in PromQL, Prometheus’ built-in query language. While it is a powerful, flexible, and expressive query language, PromQL is typically only able to query Prometheus time series data.
It’s been a long few years for your IT department. In the span of one month, you had to make sure that all employees and contractors could work remotely. This meant giving everyone access to all cloud resources and ensuring uptime. Then, you needed to start securing access. Now, you need to shore up all your security as the phrase “zero trust architecture” has recently entered conversations with leadership.
In my previous blog post, we explored key questions about Synthetic Monitoring, such as what it is, why it’s important, how it works, and how it compares to Real-User monitoring. Synthetic Monitoring is becoming an increasingly-popular method to continuously monitor the uptime of applications and the critical flows within them so that DevOps, IT, and engineering teams are quickly alerted when issues arise. Unfortunately, a good Synthetic Monitoring tool can be expensive.
Cribl Edge is the easiest and most manageable agent for exploring, processing, and collecting Observability data at the edge for Linux servers. Today, we’re excited to announce that it’s not just Linux admins whose lives have been made easier with Edge. With the Cribl Software Suite 3.5.0, Cribl Edge now supports Windows Server 2016, 2019, and 2022, bringing that same intuitive experience for deploying, setting up, and collecting observability events to your Windows infrastructure.
We’ve been busy building more features for Cribl Stream, and are excited to share the new value we offer our users. Cribl Stream 3.5 is now available! This release brings some much-requested features that will help users build more robust observability pipelines, with new sources and destinations. Let’s dive into what’s new!
Cribl.Cloud’s Summer 2022 release is now available in an AWS cloud near you! As part of this release, we are excited to share the features we have been building, including the latest Cribl product releases (Stream 3.5 and Edge 3.5). This release brings some much-requested features that will help customers increase their compliance, reduce overall costs, and deploy a more resilient observability data pipeline.
What is an observability engineer? They build monitoring tools, right? Develop data pipelines? For time series data? Maybe distributed tracing? Ah, got it…an observability engineer is just an extension of an SRE with a wider ‘end-user’s’ perspective? But don’t they also build solutions that move telemetry for security tools? Maybe monitor and review an organization’s overall security posture?
Our team has been hard at work this month to introduce 2 new parsing rules, DataMap improvements, updated tracing visualizations for SLA monitoring & more. Get up to speed on everything that’s new and improved in the Coralogix platform!
In the early days of log analysis, application developers would use their logging libraries to write logs to files stored on a disk. After years of relying on those libraries, they found that they were unable to monitor the performance of their applications anymore because they didn’t understand the way their logging libraries worked. This led to a shift from using log files stored on a disk to using Syslog.
In a world where the customer’s digital experience is critical to business outcomes, it is crucial to understand how our applications are behaving. As businesses increasingly rely on the performance and availability of revenue-generating applications, the tolerance for downtime and slow response times has plummeted – so the response to production issues must be quick and effective.
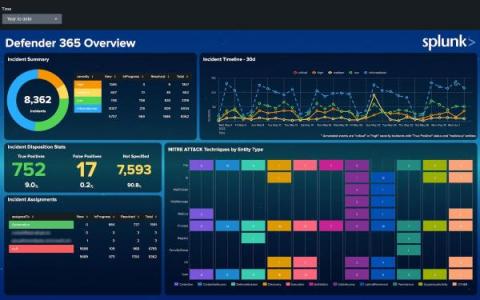
Dashboards are a powerful tool for communicating a lot of information at once. Many Splunk apps are packaged with dashboards to help you make the most of your data. For example, the Microsoft 365 App for Splunk comes with a number of dashboards to provide insights around usage, incidents, and more.
Write enough programs, and you’ll agree that it’s impossible to write an exception-free program, at least in the first go. Java debugging is a major part of the coding process, and knowing how to debug your code efficiently can make or break your day. And in Java applications, understanding and leveraging stack traces can be the game-changer you need to ship your application quickly. This article will cover how to debug in Java and how Java stack traces simplify it.
You may remember from our previous update (published August 2nd 2021) that we announced our initial support for the beta version of OpenSearch, well today we are pleased to announce that we’ve recently launched OpenSearch & OpenSearch dashboards 2.0.0 available for all platform users to use from today.
What a kickoff to the summer! That’s right, in the past two weeks, we got to welcome a lot of our ecosystem back with hugs, high fives, fist bumps, and air fives! It has been a great way to get welcomed into my new work family.
On the heels of several exciting developments about Splunk Cloud Platform announced at.conf22, I am excited to share today that Data Manager now supports onboarding of Microsoft Azure data sources, effective immediately.
It’s 3PM on a Friday, and your day is winding down. Suddenly, you get an urgent email from your boss asking you to set up an alert for monitoring volume. You consider this an easy task. You set a hard threshold for what you think is a low volume based on the last four hours of incoming data.
Wouldn’t it be great to peek into the future and find answers to the problems that you’re facing today? This may sound like science fiction, but many companies currently possess this capability, and they are creating strategies around it to strengthen their monitoring and analytical capabilities. One way is time series forecasting, a statistical method. You can take advantage of the insights of time series forecasting by using techniques like anomaly detection to gain.
As the container orchestration platform of choice for many enterprises, Kubernetes (or K8s, as it’s often written) is an obvious target for cybercriminals. In its early days, the sheer complexity of managing your own Kubernetes deployment meant it was easy to miss security flaws and introduce loopholes. Now that the platform has evolved and been managed, Kubernetes services are available from all major cloud vendors, and Kubernetes security best practices have been developed and defined.
The Internet of Things (IoT) can be found in a diverse range of devices, including fleets of autonomous vehicles, automobiles, planes, electric charging stations, and voice controllers. These devices are embedded with gateways, electronics, actuators, platform hubs, and cloud-service connectivity, enabling them to exchange data across the physical, network, and application layers that constitute IoT architecture.
In part one of our PHP logging blog series, we discussed what logging is and covered the basics of creating logs in PHP applications using the PHP system logger. While the PHP system logger automatically records critical events like errors in code-execution, a more customized logging setup can be achieved using PHP functions. For part two, let's look at the basics of creating custom error logs by calling PHP functions.
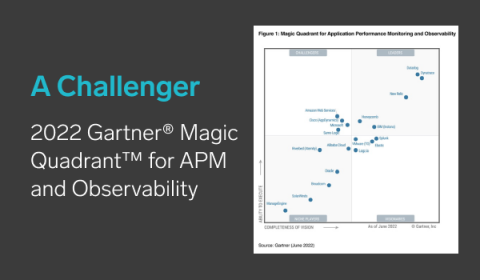
Earlier this month, we shared exciting news with our first placement in the 2022 Gartner® Magic Quadrant™ for Application Performance Monitoring and Observability: we are in the Visionary Quadrant. This research is near to my heart, as I led this research for four years; so, I wanted to reflect on why this is an accurate placement for Logz.io. The Visionary Quadrant is designated for those organizations who are pushing the boundaries of a specific market and technology.
It’s common for most CISOs to lead off a security conversation by comparing what other companies in the industry are spending on cybersecurity and simply matching that. After all, regardless of the results, the CISO can always tell the board of directors they’re following industry guidelines around security budgets. The problem is security outcomes are bad regardless of budgets. It’s not what you spend. It’s the results you get that matter.
We find ourselves submerged in a sea of software applications practically all the time. Their primary job is to make life easier and help us accomplish certain tasks. However, these applications require a lot of data. What’s more, their development requires a systematic approach with proper management of that data — and its related activities. But that’s not a straightforward and simple process. What happens if these applications stop running?
Want to improve your outlook with a splash of RUM? In our pursuit of connecting users to the right data at the right time, we’ve come to see Real User Monitoring as an invaluable tool for understanding the total picture when it comes to your web properties, apps, and cloud footprint. Do you find yourself asking any of these questions?
In Splunk Cloud Platform 8.2.2203, we're continuing to expand on interactivity capabilities and visualizations for Dashboard Studio. We've added the ability to use search results and job metadata as tokens, and pass tokens through drilldowns to other dashboards. There is a new map visualization for cluster maps and UI to match strings for dynamic coloring. And finally, we've included the ability to set a Studio dashboard as your home dashboard.
Many years ago, I attained my private pilot’s license. This entailed completing a very structured program, similar to how most companies introduce a product to a new user. Let’s be honest, there is a really good reason for this – to avoid the crash and burn. With flight training, it’s literal, while with products it’s a bit more figurative (except when you YOLO something into production–that can cause a crash and burn–and leave for a bad first impression).
Infrastructure as Code (IaC) is the cloud-computing practice of putting the provisioning and configuring your cloud resources into machine-readable code.
As a software engineer running applications in production, it is essential to monitor this environment to maintain the health of your applications. Production monitoring software and systems are used to improve observability so that you can better understand your operating environment and visualise performance issues easily.

The value of log files goes far beyond their traditional remit of diagnosing and troubleshooting issues reported in production. They provide a wealth of information about your systems’ health and behavior, helping you spot issues as they emerge. By aggregating and analyzing your log file data in real time, you can proactively monitor your network, servers, user workstations, and applications for signs of trouble.
Logz.io alerts are a critical capability for our customers monitoring their production environment. By keeping a watchful eye for data that indicates an issue – like spiking memory metrics or 3xx-4xx response codes – alerting quickly notifies engineers that something is going wrong. Setting an actionable alert to immediately notify engineers of oncoming problems can be the difference between a minor issue and a major event with widespread customer impact.
GrafanaCONline 2022 is off to a great start with exciting news from around the Grafana-verse and a jam-packed day filled with dashboards showcasing how Grafana is used in space, in industrial IoT, at live events, and even in an effort to prevent food waste.
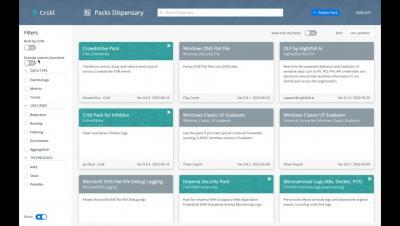
Cribl Packs are, in my opinion, our most exciting feature. Packs encapsulate the deep log processing capabilities and enable sharing of the best practices with customers, Worker Groups/Fleets, and the Community. Ease of sharing enables consistent configurations across distributed deployments of Cribl Stream or Cribl Edge. All users can leverage Packs–and should! If you collect Microsoft Windows Logs, use Palo Alto Networks or share logs via Syslog, Packs are for you.
I can’t believe that OpenObservability Talks podcast is already celebrating its second anniversary. It feels like just yesterday I wrote the summary of the summary of the first year, sharing the hectic times of starting a podcast in the midst of the COVID-19 global pandemic. The pandemic has been with us most of this year too, but it didn’t stop us from bringing the latest on the best of breed open source observability.
Ever since CircleCI introduced webhooks, I have been excited about the possibilities this new way of integration opens up to developers. I decided to try out one of the use cases described in the webhooks documentation. This use case involves transmitting information about build-pipeline workflows into an Airtable database. The data piped into Airtable forms a log for you to monitor your workflows and you can go as far as designing graphs and other visualizations to analyze the build data.
I’m thrilled to announce today that Logz.io has been named a Visionary in the 2022 Gartner® Magic Quadrant™ for Application Performance Monitoring and Observability. Gaining this recognition from these leading industry experts, in my opinion, is an outstanding accomplishment for our entire organization – the product of years of hard work and putting the needs of our 1,300-plus customers first.
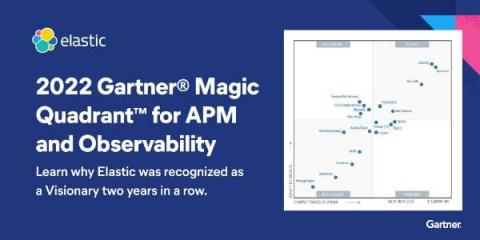
We are excited to announce that Elastic has been recognized as a Visionary in the 2022 Gartner Magic Quadrant for APM and Observability for the second year in a row. In addition, the Elastic solution scored among the Top 3 vendors in five out of six use cases in the 2022 Gartner Critical Capabilities for APM and Observability.
Every enterprise collects and stores massive amounts of security and observability data but struggles to get value outside of operations and security teams. These datasets can offer enormous value to business operations and enterprise reporting teams if they have access to the data in their toolsets. BizOps needs to optimize batch planning and the enterprise reporting teams need to reconcile how many assets the enterprise owns versus the number it has under support contracts.
Back in late May, we hosted a webinar on the heels of our Series D funding announcement where we also took the wraps off our big product announcement: Cribl Search.
As systems become more complex and distributed, the total amount of machine data put off by those systems continues to skyrocket. While teams may need access to an ever-increasing scope of machine data to gain insights into their increasingly complicated systems, that same need to access an increasingly large amount of data also creates cost concerns. Those concerns can grow into cost emergencies quickly.
The IT Operations space has a ton of recent advancements, and arguably the most elusive Observability unicorn for many organizations has got to be "AIOps," perhaps with "proactive monitoring" coming in as a close second place. You may be thinking.
From production monitoring to security concerns, businesses need to analyze and review their logs on a daily basis to make sure their system is up to par. Here are the reasons why analyzing your log data is so important. If you landed here, chances are you probably know what logs are, but we’ll start off with a short explanation of what it is.
Monitoring and analyzing log files to identify and resolve issues make up log observability. Log analytics is the process of extracting insights from log data. Logs are a valuable source of information for IT operations teams, as they provide insight into what is happening on a system or network. Logs can monitor system performance, troubleshoot problems, and identify security incidents. Logs are a vital part of application performance management.
RabbitMQ is one of the most popular open-source message brokers available. Its ability to be deployed in various configurations and on various platforms makes it a widely used tool; it also supports all major messaging protocols, making it very versatile. Still, debugging issues with a tool like RabbitMQ can be challenging, especially when it’s deployed on a large cluster. RabbitMQ logs are one way to go, as they help you backtrack to an earlier point while debugging.
Monitoring is often not the first thing on the mind of the modern developer. Yet, it’s necessary at many points of the software development lifecycle, including: before deprecating an API, before launching a new feature, after launching the feature, and more. In fact, monitoring needs can vary much more than the classic Ops monitoring. My podcast guest Liran Haimovitch is the co-founder and CTO of Rookout, a live data collection and debugging platform.
Software exists to make your job easier, not to suck the joy out of your work. It should be there when and if you need it, but be completely out of the way when you don’t — you’re at work to get a job done, not to use any particular product. If you’re forced into using the same underperforming, over-customized, difficult to implement, or just generally terrible software each and every day, it can really put a damper on the quality of your work and quality of life.
At Mezmo, we see a massive opportunity to reduce Mean Time to Detection (MTTD) and Mean Time to Resolution (MTTR) by making log data more valuable and actionable. Today, we’re thrilled to announce the release of the Mezmo Exporter for OpenTelemetry- the first step in our continued work with the project to further simplify the ingestion of log data and make that data more actionable with enrichment of key OpenTelemetry attributes.
Logging is essential to application development. Logs provide exhaustive, robust information that is useful for tracking all the changes made to an application's code. PHP logs help you track the performance of the method calls within your application, the occurrence of a particular event, and the errors in your application. With proper PHP logging techniques, you can track and optimize an application's performance.
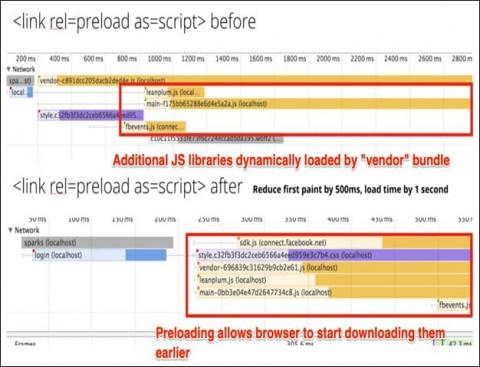
Preloads are a powerful optimization technique that can make significant improvements to crucial performance metrics such as Core Web Vitals. I have written on prefetching a DNS lookup or even preconnecting to a domain. Preloading is a much more powerful extension of these concepts because it enables you to download entire resources in advance. In this article, let’s look at.
On May 27, 2022, an interesting Microsoft Word doc was uploaded to VirusTotal by an independent security research team called nao_sec. The Word doc contains built-in code that calls an HTML file from a remote source that in-turn executes more (malicious) code and Microsoft Defender for Endpoint misses detection. Two days later, May 29, Kevin Beaumont publishes an article describing the behavior of this Word doc, and deems this a new 0-day vulnerability in Office/Windows products.
If there was a question on if an enterprise needed an observability pipeline in 2019 or 2020, we now know the answer is: yes. The observability data management methods of the 2010s aren’t going to work in the 2020s. Data is growing too fast for us to ignore, and the need to gain intelligence from said data continues to grow in importance. Data (and access to it) is becoming a competitive edge for many enterprises today.
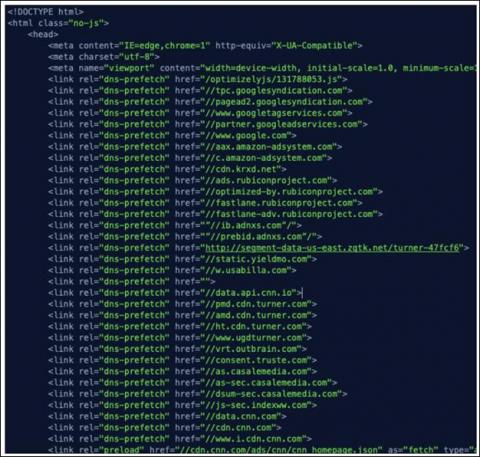
This article helps you understand DNS prefetching, one type of resource hint, including what they are, why and how to use them, and best practices for auditing and scaling them.
In this article, let’s take a look at preconnect resource hints — what they are, why and how to use them, and best practices for auditing and scaling them.
Since the beginning of the Internet, the speed of delivering content has been an issue. While processor enhancements, network acceleration, and web frameworks have brought drastic improvements to performance, the goalposts have continued to shift further away; devices operate on wireless connections with limited bandwidth, and the Internet is accessed from every corner of the globe.
From the moment Elastic announced plans to abandon a pure open source license for its Elasticsearch engine and Kibana dashboards in early 2021, there’s been a massive effort underway to create clear alternatives for the global community of active users. Logz.io has been an outspoken advocate and contributor to this work – fully embracing it as part of our product roadmap to best serve the needs of our customers, and preserve our long-term commitment to open source observability.
An old colleague of mine once said to me, “It doesn’t matter how inefficiently something DOESN’T work.” This was a joke used to make a point, so it stuck with me. It also made me consider that it does matter how efficiently something DOES work. Sometimes, when we have tools like Cribl Stream making things like routing, reducing, and transforming data so easy, we can forget that there might be a more efficient way to do it.
With the rise of microservices and distributed systems, more and more data migrates through APIs. So, let’s look at the best ways to monitoring APIs using authentication.
APIs have existed nearly as long as websites themselves. But because APIs are primarily consumed by programs instead of people, they tend to be less visible than applications or sites directly accessed by users. The result: APIs often receive far less attention from a site reliability engineering (SRE) and monitoring perspective than other parts of application environments.
The cost of cybercrime is predicted to hit $10.5 trillion by 2025, according to the latest version of the Cisco/Cybersecurity Ventures "2022 Cybersecurity Almanac." The way that people work, the tools that they use, and the mindset they must adopt to protect the enterprise has to evolve to keep up with the threat landscape.
At first glance, availability monitoring may seem like one of the more mundane responsibilities of site reliability engineering (SRE) and IT operations teams. Determining whether an application is available may appear to be relatively straightforward, especially for teams that focus simply on monitoring certain transactions or services. This may have been true in the past.
Git integration has always been at the foundation of Stream. In the fall 2021 release of Cribl Stream (both on-prem software and Cloud), our Enterprise users have a received set of APIs to separate the development and deployment of Stream. Stream GitOps connects with your favorite git based versioning platforms and leverages their PR, approve/reject, and CI/CD workflows to push production-ready changes from a development branch into a main branch or release.
It’s been an exciting few days at Cribl. A week ago, we announced our $150 Million Series D funding round led by Tiger Global, with participation from existing investors IVP, CRV, Redpoint Ventures, Sequoia Capital, and Greylock! We also announced an exciting new product: Cribl Search! We’ve been blown away by the excitement from our customers thus far.
Synthetic monitoring tools have long formed a core part of application performance management and monitoring toolsets. Yet no matter how familiar you are with synthetic monitoring, there is likely room to get more out of it than you currently are. Indeed, the default approach to synthetic monitoring tends to involve using it reactively: problems occur in production, and your team uses synthetic monitoring to help understand and remediate them.
While 2020 and 2021 were significant years for us, we’ve entered this year ready to give more to our users! We’re delighted to share we have raised $142 million in a Series D funding round! So what does that mean for you exactly? Over the past few months, our team has been working hard to build custom mapping for metrics, an advanced tracing UI, and more into our platform. The world is our oyster, and we can’t wait for you to see what else we have planned!
Many cybersecurity teams are drinking from multiple firehoses without solutions in place to deal with the onslaught of data. And with 70 percent of companies experiencing over one hundred attacks each day, it’s not slowing down. Teams are overwhelmed with data from multiple sources and formats with continuous requests to pull in more and more.