Operations | Monitoring | ITSM | DevOps | Cloud

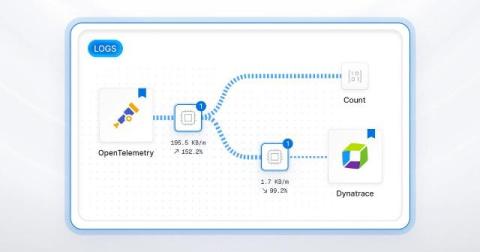
Deduplicate logs at the edge: Same insights, a fraction of the volume

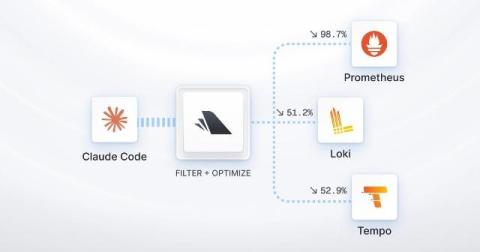
Ask a platform team why their observability bill keeps growing and you'll often get a one-sentence answer: And that's usually where it ends. The application teams own the log output, the platform team owns the bill, and nobody has the leverage to change what gets emitted. A single retry loop can print the same error thousands of times a minute. Every one of those lines is ingested, indexed, and stored. You pay for all of them, and they tell you exactly one thing: this error happened, a lot.

September 2026 at Bindplane: Bindplane Agent and a new Overview page

Also this month, a new BDOT 1.107.0 release, and you can start a configuration from a Full-Pipeline Blueprint. Here’s what happened in the last month. Prefer to watch? The September Community Call is streamed live on YouTube. Watch " YouTube" on YouTube Watch.
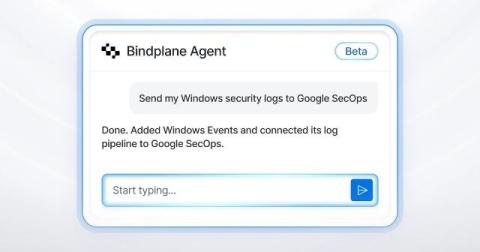
Bindplane Agent Is Here: Build, Edit, and Understand Pipelines in Plain Language

Pipeline Intelligence already recommends processors, reads live telemetry, detects log types, and generates processor bundles from natural language. But most of it lives inside a single processor node. You still have to know which one to open and what to ask for. This changes today. Bindplane Agent is your AI assistant inside Bindplane, ready to act on what you describe in plain language.

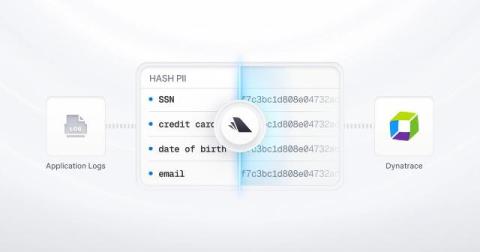
Redact PII at the edge - and still be able to search for it

Ask a platform team why their application logs aren't in their observability backend and you'll often get a one-sentence answer: And, that's where the conversation ends. The logs stay in a silo. Or, they don't get collected at all. The team loses the troubleshooting signal, and nobody revisits the decision because the alternative looks like a compliance violation. Application logs in healthcare, aviation, insurance, and retail are full of personal information that should not be stored in plain text.

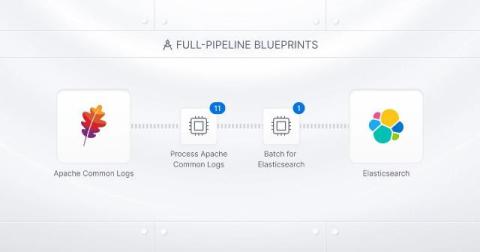
Full-Pipeline Blueprints Are Here: Source, Processors, and Destination in One Click

Blueprints launched as processor bundles, and that solved the repetitive middle of the problem. But the middle was never the whole job. You still had to know which source type to add, which parameters mattered, how to batch for your backend, and how to route it all together. That changes now. The first two cover the two requests we hear most.

OpenTelemetry at the edge: Observability for IoT fleets with Bindplane and Dynatrace

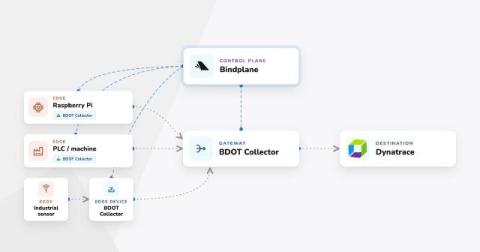
By the time an IoT device shows up in an incident review, it has usually already done its damage. Not the dashboard-gap kind. These devices are load bearing. They sit in the control path of substations, haul trucks, pump stations and cold rooms, so when they go blind the blast radius gets measured in tripped relays, spoiled stock, and unplanned outages rather than in missing datapoints.

How to Reduce Data Costs with OpenTelemetry and Bindplane

Originally written by Paul Stefanski, updated by Dylan Myers. Data costs fill a large column in many organizations' accounting sheets. Data pipeline setup and management is a significant time sink for DevOps, IT, and SRE. Setting up telemetry pipelines to reduce unwanted data often takes even more time, which could better be spent creating value rather than reducing costs. This post will show you how to quickly set up your data pipeline to filter unnecessary telemetry data.

July 2026 at Bindplane: A new pipeline editor, friendlier pricing, and a Blueprints library

The new Advanced Pipeline Editor went live for all paid plans, we launched a public Blueprints library of ready-made pipeline patterns, we reworked plan pricing and raised the Free tier to 100 GB/day, and the source and processor catalog grew with an AWS Neuron source, an AWS CloudWatch metrics source, and a full set of XML processors. None of these are flashy on their own.

The Advanced Pipeline Editor Is Here: One View, Every Pipeline

The Advanced Pipeline Editor is now live for all paid Bindplane plans. It's a rebuilt configuration editing experience that puts your whole config in a single interactive graph: every source, processor, router, and destination, across logs, metrics, and traces, in one view you can search, pan, zoom, and edit directly. If you've ever bounced between pipeline tabs trying to figure out where a processor sits in a config with a dozen sources and three destinations, this release is for you.