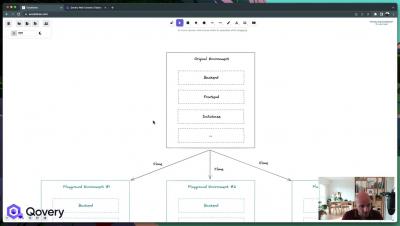
Qovery x Spayr - Managing Multiple Environments Running on Kubernetes Clusters
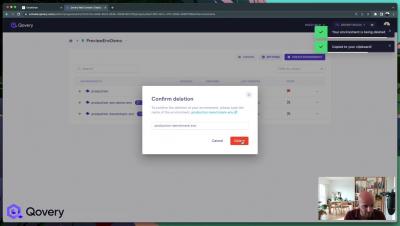
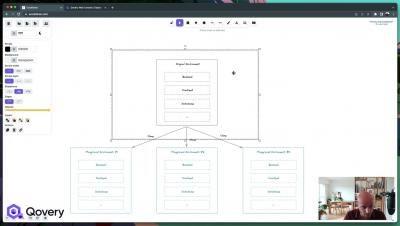
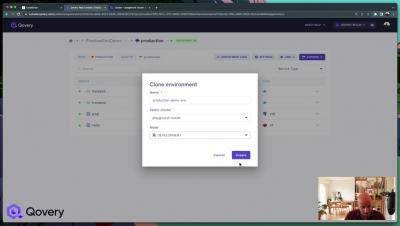
Qovery makes it easy to deploy on-demand environments on AWS. More than 20,000 DevOps and developers use Qovery to deploy their production, staging, and development environments on AWS in a few seconds. Join Albane (Product Marketing at Qovery) and Pierre (CTO and Co-founder at Spayr) to talk about how Spayr is managing multiple environments running on Kubernetes clusters on Qovery, and is empowering his team, from junior to senior developers, to create a new environment and test new ideas independently.