Visual Trace Diagnostics - Tracealyzer in the Lab, DevAlert in the Field
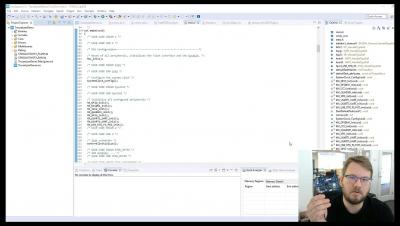
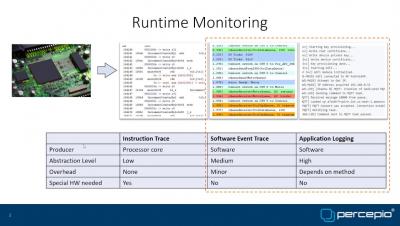
An introduction to Percepio solutions for runtime monitoring of embedded software systems and IoT devices given by Dr. Johan Kraft, CEO, CTO and founder of Percepio AB.


The latest News and Information on Monitoring for Websites, Applications, APIs, Infrastructure, and other technologies.
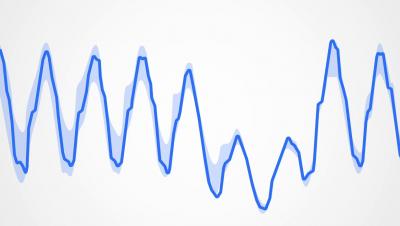
The promise of NoSample™ full-fidelity distributed tracing with unlimited cardinality exploration is that no application performance degradation will be sampled away. This ensures that executions, which exemplify problems related to latency and/or errors will be retained for further inspection and analysis. Additional value can be extracted from trace data by determining when such investigations should occur, in other words, by identifying spikes and anomalies in endpoint latency or error rate.
The TrackJS team is hard at work polishing the product to make it even better at tracking JavaScript Errors. Here’s what we shipped this Spring.
Amazon Web Services (AWS) provides tools that help with application management, machine learning, end-user computing, and much more. Users that utilize AWS, more than likely, have a combination of the many services AWS offers. LogicMonitor consolidates data from these services and empowers users to monitor them side by side with the rest of their infrastructure, whether it’s in the Cloud or on-premises. Keep reading for tips on monitoring some of these services to ensure business continuity.
Recently, Atlassian announced 12 new features to help improve collaboration across software teams. These new capabilities and some help from Sentry & friends aim to help developers spend more time building the products and services their customers want. Here’s a more detailed look at how Sentry integrates with Atlassian products and leverages Bitbucket’s new Code Insights feature.
Previously on this Azure dashboards series, we covered making dashboards natively in the Azure portal vs. SquaredUp for Azure for VMInsights and AppInsights. In this third and final part we will be comparing our dashboard experiences when it comes to cloud cost management and visualization. We’ve already talked about the resource-level cost dashboards in the previous parts, our main goal in this one is to display costs on the subscription level. Alright, let’s jump straight into it!
Among the many new features introduced in Grafana 7.0, one of the most exciting ones is transformations. The concept of data transformation is not new to Grafana, but prior to Grafana 7, it was fairly rigid and available only in the Table panel.