Checkly Runtime 2021.10 with faker.js and updated Playwright
Checkly has released a new runtime version 2021.10. This is great news for anyone creating browser checks in Checkly, as we have added some new features and brought everything up to date.


The latest News and Information on Monitoring for Websites, Applications, APIs, Infrastructure, and other technologies.
Checkly has released a new runtime version 2021.10. This is great news for anyone creating browser checks in Checkly, as we have added some new features and brought everything up to date.
If GitHub stars are any indication, Prometheus has been doubling in usage year over year since its inception. While at Moogsoft we love Prometheus as the metrics foundation of our observability platform, there were some challenges to overcome to make it the rock-solid piece of our stack it is today.
There is no shortage of content and guidance freely available on the web on how to think like a startup, act more like a startup, turn your various business units into innovation factories like startups and become more agile and responsive to customer demands just like startups.
For years customers have leveraged the power of Splunk configuration files to customize their environments with flexibility and precision. And for years, we’ve enabled admins to customize things like system settings, deployment configurations, knowledge objects and saved searches to their hearts’ content. Unfortunately a side effect of this was that multiple team members could change underlying.conf files and forget that those changes ever occurred.
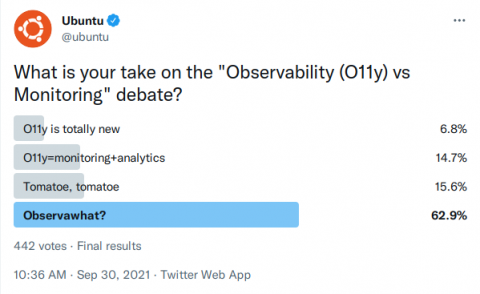
In the past few years, the word “observability” has steadily gained traction in the discussions around monitoring, DevOps, and, especially, cloud-native computing. However, there is significant confusion about the overlap or difference between observability and monitoring.
Sean Tierney is the DevOps lead at Athos, a company that's building better athletes through smart clothing and AI. Sean reinforces a DevOps state of mind across the organization by building empathy between hardware and software teams and putting the systems in place to allow them to move faster as a single unit.
Three seconds is all it takes before your customer decides to leave. Would you imagine that! The audacity of some people! But, can you really blame them? We live in a fast-paced world. Wasting people’s time is worse than wasting their money. Developers are striving to provide value in as short of time as possible. Just as I am now writing this tutorial. I’m adamant about not wasting your time but providing you with concrete info for you to learn something new.
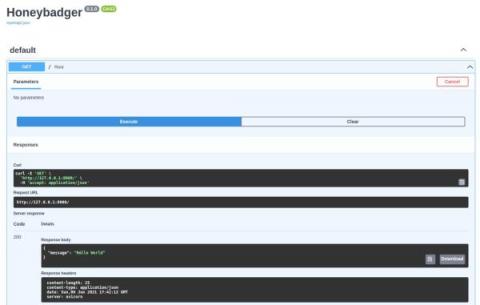
FastAPI is a high-performance web framework for building APIs with Python that has been growing in popularity. In this article, Stefano Frassetto shows us how to set up error monitoring for a FastAPI app using Honeybadger.
It’s one thing to set up an observability strategy. But what’s it like to introduce and scale observability effectively across an organization? In a wide-ranging conversation at ObservabilityCON 2021, three technical pros from Snyk, TripAdvisor, and Citibank joined Grafana Labs VP Global Solutions Engineering Steve Mayzak and — with more than 75 years experience between them — they shared the triumphs and turbulence in their respective observability journeys.