Operations | Monitoring | ITSM | DevOps | Cloud

The latest News and Information on Monitoring for Websites, Applications, APIs, Infrastructure, and other technologies.

What is OpenTelemetry: A guide to understanding OpenTelemetry and the way forward

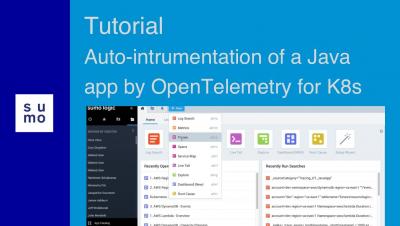
OpenTelemetry is a vendor-neutral approach that enables DevOps and developers to collect performance metrics in a standardized manner. Currently a Cloud Native Computing Foundation (CNCF) sandbox project, OpenTelemetry was conceived by merging OpenCensus, Google's open-source method of collecting metrics and traces, and OpenTracing, a vendor-neutral API to collect traces.

Log Observability and Log Analytics

Logs play a key role in understanding your system’s performance and health. Good logging practice is also vital to power an observability platform across your system. Monitoring, in general, involves the collection and analysis of logs and other system metrics. Log analysis involves deriving insights from logs, which then feeds into observability. Observability, as we’ve said before, is really the gold standard for knowing everything about your system.

Request Metrics Released! What We Got Right.

It's been a long time since we produced a new Request Metrics video and we wanted to give an update! Things have been going well and the product is out there! We made some good choices. Some not so good choices. And we've made many enhancements since launch. Watch Part 1 of our Request Metrics Released series to see how things are going, and what we did right!

New Feature: Slug URLs

Healthchecks.io pinging API has always been based on UUIDs. Each Check in the system has its own unique and immutable UUID. To signal a start, a failure, or a particular exit status, clients can add more bits after the UUID: This is conceptually simple and has worked quite well. It requires no additional authentication. The UUID value is the authentication, and the UUID “address space” is so vast nobody is going to find valid ping URLs by random guessing any time soon.

Using the Resource Timeline in Request Metrics

The Resource Timeline in Request Metrics is a heat map of all the files requested by your pages. It shows the range of resource load time and critical load events experienced by all users, not just a single point load. The data allows you to see which resources impact your page metrics as well as the variability in their load time.

Let's Encrypt DST Root CA X3 certificate set to expire

If you've been using Let's Encrypt for a while, you may have noticed that their certificates are signed by a root certificate titled DST Root CA X3. That root certificate is set to expire in a few hours. Any certificates still signed by that root will no longer be valid. But luckily, that shouldn't form a problem for most Let's Encrypt users. For a while now, new SSL issuances by Let's Encrypt have issued certificates against DST Root CA X3 (the one that is about to expire) and ISRG Root X1.

The U.S. Department of Defense formally authorizes Grafana, Grafana Enterprise, and Loki for its 100,000 developers

Not so long ago, development teams working for the U.S. Department of Defense could take anywhere from three to ten years to deliver software. “It was mostly teams using waterfall, no minimum viable product, no incremental delivery, and no feedback loop from end users,” Nicolas M. Chaillan, Chief Software Officer of the U.S. Air Force, said in a CNCF case study. “Particularly when it comes to AI, machine learning, and cybersecurity, everyone realized we have to move faster.”

What Is Distributed Tracing?

Modern software development is evolving rapidly, and while the latest innovations allow companies to grow through greater efficiency, there is a cost. Modern architectures are incredibly complex, which can make it challenging to diagnose and rectify performance issues. Once these issues affect customer experience, the consequences can be costly. So, what is the solution? Observability — which provides a visible overview of the big picture.