The latest News and Information on Monitoring for Websites, Applications, APIs, Infrastructure, and other technologies.
Before we talk about OpenTelemetry, we should talk about telemetry. Telemetry is: And an instrument is: For the purpose of measuring running computer software and systems, our instruments are virtual instruments. That is to say, code that measures other code. It sounds simple: read a measurement and send it to a remote location. In practice, to make that telemetry data useful in today’s cloud-native and ever more complex environments, there are huge logistical and technical hurdles to overcome.
OpenTelemetry is enabling a revolution in how Observability data is collected and transmitted. See our What Is OpenTelemetry post on why this is an important inflection point in the Observability space. In this post, we’ll walk through how to configure the OpenTelemetry Gems within a Rails app.
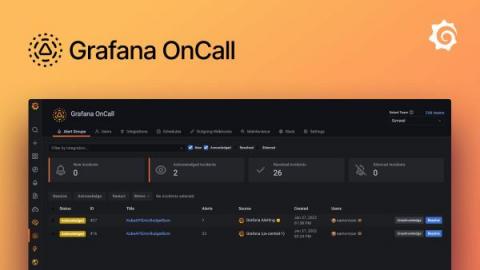
Today we’re announcing the general availability of Grafana OnCall on Grafana Cloud for all paid and free plans. A big part of delivering great software is ensuring the right people get the right information when the inevitable incidents occur. We want to help you do that with Grafana OnCall, an easy-to-use, developer-first on-call management tool that’s built on top of the Grafana stack you know and love.
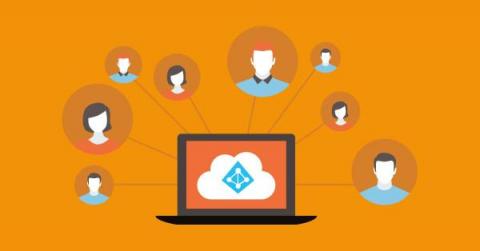
This blog post is part 2 of our Monitoring Microsoft Azure Active Directory series. Managing Identity is a big challenge in a cloud environment, especially when users can potentially log in from anywhere. Additionally, users can often use different types of devices to log in and access cloud-hosted resources. Without a central Authentication and Authorization source, it is very difficult to manage who can login to what and who can do what with a cloud resource.
It’s soon two years since I’ve introduced you to Icinga L10n. There I’ve talked about a place on-line to ease collaboration. So, without further ado, let me introduce you to translate.icinga.com! We’re using Weblate on there and hope that interested users may already be familiar with it. The basic tools are easy to grasp though. And even if not, it has an extensive user documentation.
Ever wonder how your teammates go about debugging? When you use Honeycomb, you’re not only getting observability into your systems; it also provides observability into how your teammates use Honeycomb! Very meta, no? You’re never alone when writing or running Honeycomb queries. Opening up the right sidebar will show you the queries your teammates have recently run on the same dataset.
To date, AIOps has been a solution first and foremost for IT operations teams. In other words, AIOps has been used primarily to help IT teams manage what happens in the post-deployment part of a CI/CD pipeline, when they need to detect and remediate issues in production environments. That doesn’t mean, however, that AIOps leaves developers out of the picture. Although the conversation surrounding AIOps hasn’t paid a lot of heed to developers so far, it’s perhaps time to change that.
You just launched your application and it’s attracted more users than you were expecting. Your web server is bombarded with data. Now you need to know more about your users: what is the dominant device they’re using, and how long are they staying on the app? A time series database will help you answer these questions. It allows you to save data for a given point over a specified period of time, which gives you insight into what type of usage you’re getting and when.