Operations | Monitoring | ITSM | DevOps | Cloud

The latest News and Information on Monitoring for Websites, Applications, APIs, Infrastructure, and other technologies.

Announcing Logz.io Unified Dashboards

In today’s cloud environments, a typical observability stack might include an Elasticsearch cluster for logging, a few Prometheus servers for metrics monitoring, and an AppDynamics deployment for APM. You may run something similar – most observability stacks consist of multiple siloed tools dedicated to collecting and analyzing specific types of monitoring data.

DoD-Worthy Interoperability & Cybersecurity Standards: What Does It Mean to Our Customers?

This is the third in a series of four ScienceLogic blogs on the topic of the Department of Defense Information Network (DoDIN), including what it is, what it means to be approved under DoDIN standards, why it is important to both our federal and private industry customers, and the process for being approved for listing.

Measure, Track, Improve: Streamlined event exploration and increased visibility into team health

For many engineering leaders, measuring their team’s impact can be hard to quantify and a face:palm process, filled with searching through logs and exporting data sets to cobble together a report that most people won’t even look at twice. And let’s be honest, if you wanted to spend time making reports, you wouldn’t have become a developer.

Windows logevent and regexp modules

There are several predefined modules in Pandora FMS with which we can monitor logs of our Windows environments in a simple way. This time we are going to see how to use the logevent and regexp modules through the log collector. Remember that it is necessary to have an ElasticSearch server installed in order to use these modules from the agent plugins section.

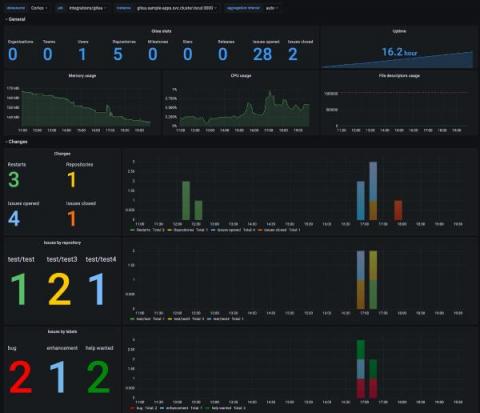
Why we created a Prometheus Agent mode from the Grafana Agent

On 2021-10-29, initial support for Prometheus Agent was merged, and it is slated for inclusion in Prometheus v2.32! This feature has a bit of a lengthy history to it: It took a little while to get to where we are today, but I’m thrilled that we were able to use the Grafana Agent code to enable agent-like functionality in the prometheus/prometheus repository.

Deploying your first Serverless REST API within minutes

In this video, we'll show you how to get started with the serverless framework in minutes. To make sure your app will be running smoothly at all times, we'll also take you through how to set up observability for debugging, alerting, and troubleshooting so that you don't miss any critical errors and warning signs.

Generate span-based metrics to track historical trends in application performance

Tracing has become essential for monitoring today’s increasingly distributed architectures. But complex production applications produce an extremely high volume of traces, which are prohibitively expensive to store and nearly impossible to sift through in time-sensitive situations. Most traditional tracing solutions address these operational challenges by making sampling decisions before a request even begins its path through your system (i.e., head-based sampling).

The Importance of Application Performance Monitoring.

In this digital era, applications are used on a daily basis to make our life easier. A lot of software applications are launched every day, continuously increasing competition in the market. There are thousands of applications available for a task. But, the success of any application highly depends on its performance. A good-performing application provides a flawless user experience to the customers. Ultimately, making performance a crucial metric for benefitting the company owning the software product.

How Using Annotations with OpenTelemetry Can Lower Your MTTR

When it comes to gaining control over complex distributed systems, there are many indicators of performance that we must understand. One of the secrets to understanding complicated systems is the use of additional cardinality within our metrics, which provides further information about our distributed systems’ overall health and performance. Developers rely on the telemetry captured from these distributed workloads to determine what really went wrong and place it in context.

Full-Stack Infrastructure Observability with DX Unified Infrastructure Management

The IT infrastructure landscape has seen tremendous changes over last few years due to evolving technologies, newer business models, and ever-changing market demands. Business, market, and consumer demands are pushing such IT advancements as cloud, mobility, and IoT.