Operations | Monitoring | ITSM | DevOps | Cloud
Monitoring
The latest News and Information on Monitoring for Websites, Applications, APIs, Infrastructure, and other technologies.
Windows Server Monitoring with Pandora FMS
Pandora FMS is a proactive, advanced, flexible and easy-to-configure monitoring tool tailored to business itself. It adapts to all needs both in servers, network computers, devices and whatever is necessary. In this article, we will focus on Windows Server monitoring, using the software agent installed on our server.
AppDynamics Achieves AWS Outposts-Ready Designation
AppDynamics has received a new AWS Service Ready Program designation for Outposts. Learn what that means for your business.
Webpagetest Joins Forces with Catchpoint
I’m incredibly excited about the future of Webpagetest and web performance testing in general with today’s announcement that Webpagetest and Catchpoint will be joining forces and I hope you’re as excited as I am for the possibilities it will bring.
Announcing the ServiceNow Service Graph Connector for LogicMonitor
We are pleased to announce another integration with one of our strategic partners, ServiceNow. Available today with the launch of ServiceNow’s Paris release, LogicMonitor supports the Service Graph Connector! LogicMonitor was selected by ServiceNow as a key player and one of the first monitoring platforms invited to this new, exclusive program.
Netdata named to the Forbes Cloud 100 Rising Stars
We’re excited to announce that we’ve been named to the Forbes 2020 Cloud 100 Rising Stars. This is a list of the top 100 private cloud companies in the world, published by Forbes in partnership with Bessemer Venture Partners and Salesforce Ventures. The 20 Rising Stars represent young, high-growth and category-leading cloud companies who are poised to join the Cloud 100 ranks.
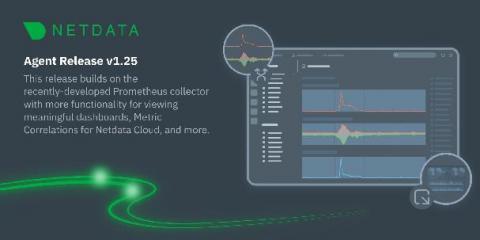
Netdata Agent v1.25 and Cloud enhancements
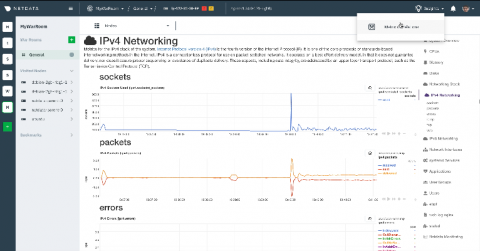
The v1.25.0 release of the Netdata Agent delivers on our commitment to make our metrics collection, visualization, and troubleshooting platform more stable and usable. We enhanced our recently-added Prometheus collector with user-configurable filtering and grouping, made dramatic improvements to the reliability of the Agent-Cloud link that streams metrics on-demand to your browser when you use Netdata Cloud, and more. Let’s jump in and look at each improvement.
Netdata versus Datadog: root cause analysis with metric correlations
When an incident strikes, and every minute spent on root cause analysis delays the time to resolution, the real-world consequences can be dire. Troubleshooting an event requires a certain data set: every metric, at the greatest granularity, in one place, available in real time. Limits on the number or type of metrics, collection frequency, or time to visualization can mean the difference between timely resolution and unacceptable losses in time, money, and productivity.
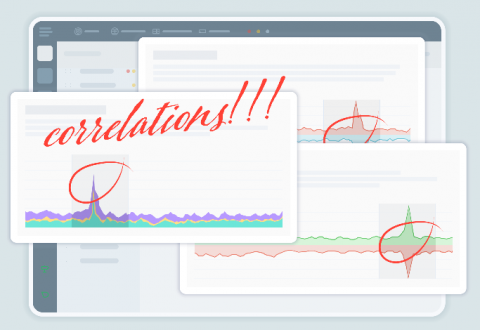
Introducing our first Netdata Cloud Insights feature: Metric Correlations for faster root cause analysis
Today, we are excited to launch our first Netdata Cloud Insights feature, Metric Correlations, developed for discovering underlying issues more quickly and identifying the root cause more efficiently. Read on to learn more about our approach to developing this new feature, how it works, and the many benefits you’ll find incorporating this into your team’s troubleshooting workflow.
How we're making it easier to use the Loki logging system with AWS Lambda and other short-lived services
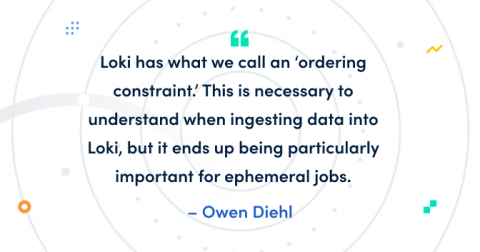
There are so many great things that can be said about Loki – I recently wrote about them here. But today, I want to talk about something technical that has been difficult for Loki users, and how we might make it easier: using Loki for short-lived services. Historically, one of Loki’s blind spots is ingesting logs from infrastructure you don’t control, because you can’t co-locate a forwarding agent like promtail with your application logs.


