Operations | Monitoring | ITSM | DevOps | Cloud

Monitoring

The latest News and Information on Monitoring for Websites, Applications, APIs, Infrastructure, and other technologies.

Monitor AWS Step Functions with Datadog

AWS Step Functions is a service that abstracts distributed applications into state machines, with each state representing a component of an application. Not only does this automatically generate an architectural diagram of your application’s workflow, it also makes it straightforward to reorder your states as well as implement parallel execution, retries, and other tasks.

The Key Benefits of Service Monitoring

When it comes to delivering the very best services to your customers, consistency is essential! That’s why many businesses choose to implement a service monitoring tool that will enable them to get greater control over their services. As one of today’s leading network and server monitoring softwares, Pandora FMS is here to share some of the benefits of service monitoring.

Jaeger Essentials: Jaeger Persistent Storage With Elasticsearch, Cassandra & Kafka

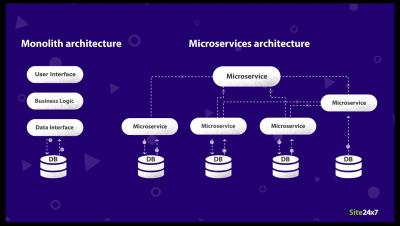
Running systems in production involves requirements for high availability, resilience and recovery from failure. When running cloud native applications this becomes even more critical, as the base assumption in such environments is that compute nodes will suffer outages, Kubernetes nodes will go down and microservices instances are likely to fail, yet the service is expected to remain up and running.

Finding and Fixing Django N+1 Problems

The Django Python framework allows people to build websites extremely fast. One of its best features is the Object-relational mapper (ORM), which allows you to make queries to the database without having to write any SQL. Django will allow you to write your queries in Python and then it will try to turn those statements into efficient SQL. Most of the time the ORM creates the SQL flawlessly, but sometimes the results are less than ideal.

Site24x7 Application Performance Monitoring

Site24x7 APM Insight provides you with unmatched visibility into the way your web applications behave. It is the developer's handy tool to better visualize web transactions end to end, with performance metrics of all components starting from URLs to SQL queries. Identify and resolve performance degradation no matter where they originate. It's a one-stop solution for monitoring your Java, .NET, PHP, Ruby on Rails and Node.js web transactions.

Webinar Highlights: How Texas Instruments Uses InfluxDB

It’s back to school season, and oftentimes, that means people are purchasing TI-84 calculators for their kids. But did you know that Texas Instruments makes so much more than calculators? 😁 Michael Hinkle, a Probe Engineering and Manufacturing Supervisor at Texas Instruments, recently presented on “How Texas Instruments Uses InfluxDB to Upload Product Standards and to Improve Efficiencies”.

Analyze your logs quickly with suggested queries beta in Cloud Logging

Cloud Logging is a popular tool to help developers, operators, and other users identify and find the root cause of issues in their infrastructure. With features like the Logs Explorer, you can quickly and efficiently retrieve, view, and analyze logs. To help you get the most out of your logs, we’re excited to introduce suggested queries in Cloud Logging to help highlight important logs, so you can start analyzing and troubleshoot issues quickly.

Visualizing NOC Operations with GroundWork NOC Boards

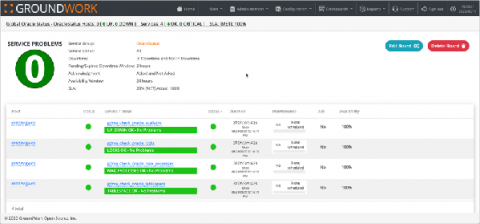
A monitoring system is a shared tool. It’s useful for teams to operate from the same source of information, since subjective opinions can lead insights astray, especially when troubleshooting systems and network issues. You need a single source of truth. A monitoring dashboard with drill-down capability is a basic tool for any NOC staff. Often displayed on kiosks or wall-mounted in the Network Operations Center (NOC), dashboards let you know at a glance whether anything needs attention.