Operations | Monitoring | ITSM | DevOps | Cloud

Monitoring

The latest News and Information on Monitoring for Websites, Applications, APIs, Infrastructure, and other technologies.

Putting You in Control of Your InfluxDB Cloud Spend

We recently changed the pricing of InfluxDB Cloud to let you control your cloud database spend so you spend only as much as you need to run your software and systems — with no wasted budget. If you just want a summary, check the InfluxDB Cloud pricing page. But if you’d like to nerd out on the changes we made, why we made them, and how to estimate your monthly spend on InfluxDB, then buckle up for a deep dive.

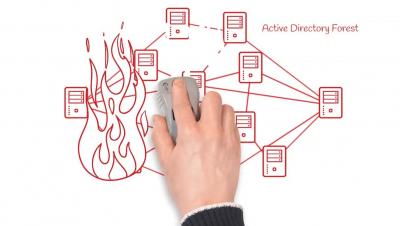
Prepare and Recover from any Active Directory catastrophe

Mistakes, cyber attacks and disasters happen, and without a recovery plan, an Active Directory disaster can stop your business in its tracks. But see in just two minutes how you can prepare and recover from any AD disaster with Quest® Recovery Manager for Active Directory Disaster Recovery Edition.

Your Burning Questions about AIOps and Observability Answered

A fireside chat to discuss use cases and deployment tips for AIOps with observability generated a stream of compelling questions from attendees, which the Moogsoft hosts answered with depth and expertise. Combining AIOps analysis with detailed observability data is key for DevOps and SRE teams to attain continuous service assurance, so Moogsoft just published a new ebook about this topic titled “Observability with AIOps For Dummies.”

How to Use the Triple-A Framework to Optimize Your IT Services

Marketing teams have the 4 Ps (product, price, place, and promotion). Sales teams have ABC (Always Be Closing). As far as frameworks go, there are a lot of great examples out there for how we can effectively do our jobs, create processes, and make decisions. But what about IT teams looking to optimize their services? Do any frameworks exist? One does, it’s called the triple-A framework—and it’s got nothing to do with batteries.

Nexthink Named in Gartner's Guide for Digital Experience Monitoring (DEM)

We’re proud to announce that Nexthink has been named, once again, as a leading technology vendor in Gartner’s latest Market Guide for Digital Experience Monitoring (DEM). More than ever, the topics in the guide are striking a chord for many Infrastructure & Operations (I&O) leaders. According to Gartner, in the first few months of 2020 inquiries for end-user experience grew five times compared to 2019.

Kubernetes Logging and Monitoring: What Kubernetes Can and Can't Do Natively

Kubernetes is a container orchestration tool, but its functionality extends far beyond just orchestrating containers in a narrow sense. It offers a range of additional features that—to a limited extent—address needs such as load balancing, access control, security policy enforcement, and even logging and monitoring. Indeed, Kubernetes’s broad functionality has led some folks to call it an “operating system” in its own right.

The difference between Event Logging and Tracing in Observability

I have been noticing that a lot of folks are often confused between event logging and tracing. In terms of building out a generic SD for devs to report on observability data, should Event APIs be distinct from Trace APIs? Is an Event just a single Trace Span ? If you look at Honeycomb’s implementation, an Event seems to be equivalent to a single span trace. The middleware wrapper creates a Honeycomb event in the request context as a span in the overall trace.

How to Avoid SLA-Killing, Budget-Busting Cloud Performance Problems

There are lots of excellent reasons to move applications into the public cloud. But those benefits cannot come at the expense (pun intended) of performance. Your SLAs, whether explicitly stated and written into contracts or implicitly promised through your commitment to quality, are part of your brand. Falling short is costly. Even if you don’t have to pay penalty fees, your reputation and customer loyalty can take a hit.

Datadog and Relay for Incident Response

Datadog is an awesome tool for aggregating and visualizing the metrics that matter to you. Recently, Datadog launched a new Incident Management feature, which allows you to coordinate the activities around a problem that affected your service. In this example, I’ll walk through using Relay to roll back a Kubernetes deployment that caused a service impact, and show how the Datadog Incident timeline can keep everyone working on the incident in sync.