Operations | Monitoring | ITSM | DevOps | Cloud

Monitoring

The latest News and Information on Monitoring for Websites, Applications, APIs, Infrastructure, and other technologies.

How to monitor your AWS servers via MetricFire

In this article we explore the basics of monitoring Amazon Web Services (AWS) by feeding metrics to Grafana through Hosted Graphite’s agent and also through Hosted Graphite’s AWS add-on. This will allow us to monitor metrics from applications and servers hosted in AWS with clarity and depth. This article assumes you have created a Hosted Graphite account.

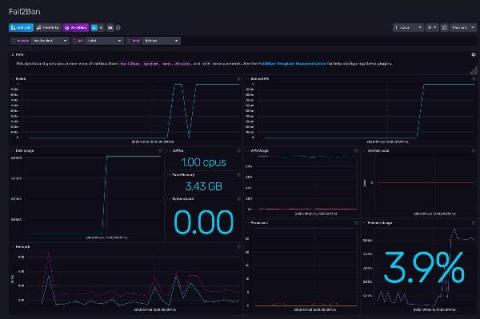
Fail2ban Monitoring with InfluxDB and Telegraf

If you have a server open to the internet on Port 22 (the default port for SSH servers), it’s common to find several “Failed password” in your auth.log (log file) every minute, due to bots constantly browsing the internet for servers that are easy to hack with common passwords. But if your auth.log is growing very fast and SSH daemon randomly refuses to create new connections, then someone probably marked your server as a target for coordinated SSH brute-force attack.

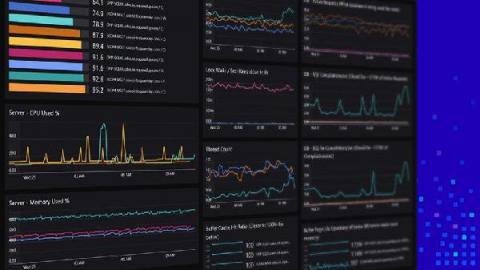
Better Dashboarding - Grafana or SquaredUp?

As part of my job as a tech evangelist and a pre-sales engineer here at SquaredUp, I often find myself talking to a lot of people. And understandably, when you as a consumer are trying to evaluate a product that you may potentially invest in, it’s only natural that you want to compare different products and decide which one’s better and/or offers more value for money and why.

Getting to Know Google Cloud Audit Logs

So you've set up a Google Cloud Logging sink along with a Dataflow pipeline and are happily ingesting these events into your Splunk infrastructure — great! But now what? How do you start to get meaningful insights from this data? In this blog post, I'll share eight useful signals hiding within Google Cloud audit logs that will help you uncover meaningful insights. You'll learn how to detect: Finally, we’ll wrap up with a simple dashboard that captures all these queries in one place.

A Practical Guide to Logstash: Input Plugins

In a previous post, we went through a few input plugins like the file input plugin, the TCP/UDP input plugins, etc for collecting data using Logstash. In this post, we will see a few more useful input plugins like the HTTP, HTTP poller, dead letter queue, twitter input plugins, and see how these input plugins work.

How to connect and monitor your Raspberry Pi with Grafana Cloud

The Raspberry Pi is a popular and inexpensive device that comes in many shapes and forms. It’s a popular hobbyist tool that is generally purchased to run all kinds of software experiments on. But make no mistake, even though a Raspberry Pi comes in a tiny form factor, it’s a fully functional computer!