Operations | Monitoring | ITSM | DevOps | Cloud

DevOps

The latest News and Information on DevOps, CI/CD, Automation and related technologies.

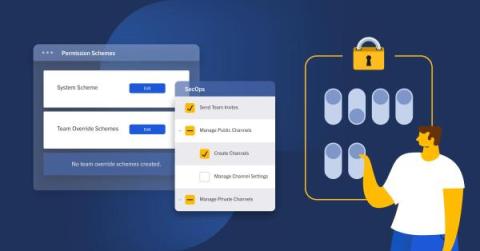
Advanced Access Controls with Mattermost Enterprise Edition

While some smaller companies may only need to use standard access controls to shore up systems, large organizations — particularly those with strict security, confidentiality, and compliance requirements — often require advanced functionality that gives them more authority over which users can access what systems and when.

The Evolution of DevOps From Concept to Best Practice

Software development, the evolution of DevOps has been nothing short of revolutionary. What began as a simple concept has transformed into a best practice that is reshaping the way organisations develop, deploy, and maintain their software. In this blog post, we will take a journey through the evolution of DevOps, from its humble beginnings to its current status as an indispensable part of modern software development.

Automation Cheat Sheet: How Telco Leaders Ace the Test of Driving Process Efficiency

Telecommunication (Telco) companies everywhere share a similar vision: future-proofing their organizations for an unpredictable era of challenges and opportunities in an unreliable economy. Rebounds from the pandemic started out slow and patchy, and leading up to present day, moves like inflation-laced price increases and merger and acquisition (M&A) deals have ramped up share prices across the global telecoms sector to climb back up from 2020’s rock bottom.

Exploring the 2023 Enhancements in SharePoint Online

In the realm of collaborative platforms, SharePoint Online stands as a robust solution that continually evolves to meet the dynamic needs of modern enterprises. The 2023 updates have notably elevated the platform’s capabilities, particularly in terms of file and document management and integration with other Microsoft 365 offerings.

What Happens to DevOps when the Kubernetes Adrenaline Rush Ends?

Kubernetes has been around for nearly 10 years now. In the past five years, we’ve seen a drastic increase in adoption by engineering teams of all sizes. The promise of standardization of deployments and scaling across different types of applications, from static websites to full-blown microservice solutions, has fueled this sharp increase.

Staying Ahead of Threats with Continuous Security Monitoring Tools for DevOps

According to the latest Crowdstrike report, in 2022 cloud-based exploitation increased by 95%, and there was an average eCrime breakout time of 84 minutes. Just as significantly, in 2021, the Biden administration passed an executive order to improve the nation’s cybersecurity standards. There are also upcoming laws like DORA in the European Union. So, increased cyber attacks and legislative pressures mean you need to (a) actively protect against threats and (b) prove that you are doing so.

Webinar: The Top 5 Use Cases for Internal Developer Portals

Internal developer portals (IDPs) have received a lot of attention lately. Internal Developer Portals serve as the engineering system of record—providing developers with the context and tools they need to ensure services and resources they own align with best practices for deployment readiness, operational maturity, security compliance, and more. But they do more than just act as a system of record for your whole stack. They also help drive alignment, improve MTTR, and can even reduce cloud spend.

What Is Continuous Security Monitoring Software?

Many DevOps teams work proactively to meet security and compliance standards. They consider security best practices when developing software with open source components, scanning code for vulnerabilities, deploying changes, and maintaining applications and infrastructure. Security is a key feature of many of the tools they’re using, and the policies and industry standards they’re following.

Kafka Monitoring Using Prometheus

In this article, we are going to discuss how to set up Kafka monitoring using Prometheus. Kafka is one of the most widely used streaming platforms, and Prometheus is a popular way to monitor Kafka. We will use Prometheus to pull metrics from Kafka and then visualize the important metrics on a Grafana dashboard. We will also look at some of the challenges of running a self-hosted Prometheus and Grafana instance versus the Hosted Grafana offered by MetricFire.