August Monthly Roundup
Here is a quick round up of the newest product features, resources, and events!


The latest News and Information on Monitoring for Websites, Applications, APIs, Infrastructure, and other technologies.
Here is a quick round up of the newest product features, resources, and events!
We are excited to announce that Elastic is joining forces with Cmd to accelerate our efforts in Cloud security - specifically in cloud workload runtime security. By integrating the capabilities of Cmd's expertise and product into Elastic Security, we will enable customers to detect, prevent, and respond to attacks on their cloud workloads.
While we know the many benefits of going serverless – reduced costs via pay-per-use pricing models, less operational burden/overhead, instant scalability, increased automation – the challenges of going serverless are often not addressed as comprehensively. The understandable concerns over migrating can stop any architectural decisions and actions being made for fear of getting it wrong and not having the right resources.
A WS is a comprehensive platform with over 200+ types of cloud services available globally. As organizations adopt these services, monitoring their performance can seem overwhelming. The majority of AWS workloads behind the scenes are dependent on a core set of services: EC2 (the compute service), EBS (block storage), and ELB (load balancing).
This post was written by James Hickey. Scroll below for full bio and picture following this article. Time series databases (TSDBs) can transform the way you handle streams of data in real time or IoT applications. In this tutorial, you’ll learn how to set one up in a C# application. Relational databases have their place. They’re great at things like data normalization, avoiding duplication, indexing over specific data points (like columns), and handling atomic changes to the schema.
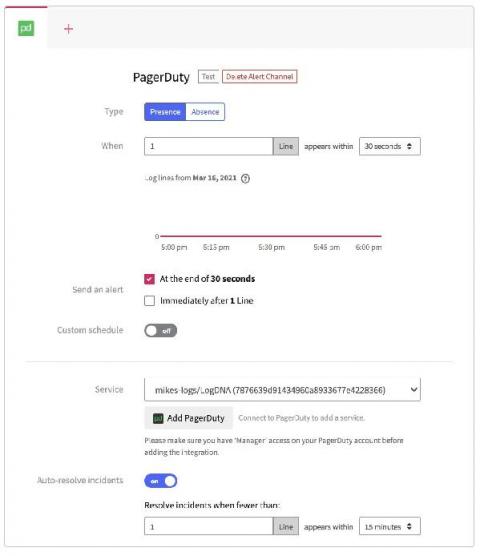
LogDNA integrates with your PagerDuty instance to help trigger incidents based on log data coming in from your ingestion sources. This allows your teams to quickly understand when there are issues with your application, and where in the logs you can investigate to understand root cause. To help further accelerate your team’s ability to understand the state of your applications, we are introducing the ability to automatically resolve those PagerDuty Incidents directly from LogDNA.
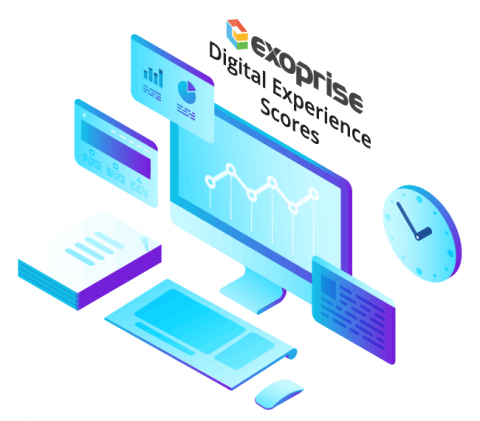
User experience is subjective. For example, asking tourists visiting New York City about their experiences gives different answers. Likewise, end-users who work remotely with different resources and disparate assets can have varied experiences with their business applications. How can IT teams gather this experience data and react faster to improve experience? The answer is Digital Experience Scores.
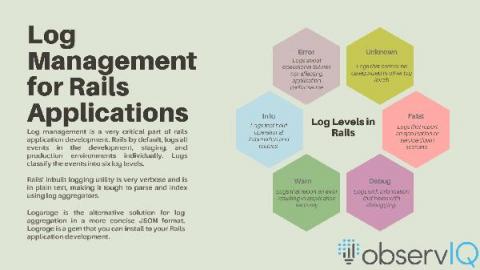
Logging is useful in building, managing and debugging Rails applications. Most logging functionalities are built into the application, and it is fairly simple to find the logs. However, as your applications scale up in volume, it becomes difficult to trace the source of an issue. That’s when you want to implement a cloud based log management system to get a unified view of all logs from your Rails application.
A few weeks before I sat down to write this article, I reshared my two month review of OnlineOrNot around the internet. Surprisingly, the article was quite popular: So I thought I'd clear up some confusion for the folks who only just read my two month review: I started OnlineOrNot on February 25, 2021, shipped the first version for people to use on March 2, 2021, and here I am in August writing the six month review.