Operations | Monitoring | ITSM | DevOps | Cloud

The latest News and Information on Monitoring for Websites, Applications, APIs, Infrastructure, and other technologies.

5 Reasons To Use DynamoDB In Serverless Applications

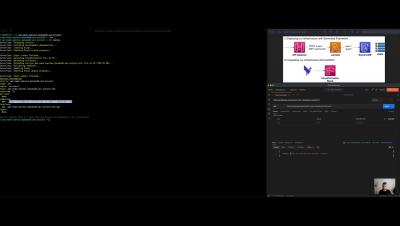
In this webinar, AWS Data Hero Alex Debrie and Uri Parush System Architect at Lumigo will introduce DynamoDB by understanding its unique properties and why it's so popular in serverless applications. They will walk through some tips for using DynamoDB correctly, including identifying and fixing common issues using Lumigo.

An Introduction to OpenTelemetry

The growth of technology has led to more efficient and relevant digital experiences, and customers continue to expect more out of those interactions. That’s true no matter their location and no matter which device they choose to use. Companies that cannot provide these kinds of personalized interactions for their customers find themselves falling behind the competition as technology continues to advance.

Monitoring and Improving Employee Experience In Virtual Desktop (DaaS/VDI) Environments (Part 1)

A common pain point we repeatedly hear from our customers that use Desktop as a Service (DaaS)/Virtual Desktop Infrastructure (VDI) environments is, “We have monitoring in place for physical hosts and infrastructure, but our employees still complain a lot.” If DaaS or VDI is part of your IT environment and you lack visibility into such environments to ensure effective employee experience, read on.

How Slack Transformed Their CI With Tracing

Slack experienced meteoric growth between 2017 and 2020—but that level of growth came with growing pains. In his talk at the 2021 o11ycon+hnycon, Frank Chen (LinkedIn), a Slack Senior Staff Engineer, detailed one of Slack’s biggest pain points in that period: flaky tests. A flaky test returns both a passing and failing result despite no changes in the code. At one point, between 2017 and 2020, Slack’s flaky test rate reached as high as 50%.

Practical CPU time performance tuning for security software: Part 2

In a previous blog, we discussed how to monitor, troubleshoot, and fix high %CPU issues. We also revealed a system API that could have an unexpected impact on CPU consumption. In this episode, we’ll discuss another time-related performance aspect that is unique to security software: application startup time. You don’t need to be a developer to benefit from this article.

Debugging with Dashbird: AWS Lambda Process Exited Before Completing Request

Another generic error message from our favorite FaaS provider AWS Lambda. And again, there are multiple reasons why this issue could arise. Let’s first look at the basics of AWS Lambda to get a better intuition for when things go wrong later. Lambda is an asynchronous event-based service at heart.

Why Serverless Apps Fail and How to Design Resilient Architectures?

We’ve been monitoring 100,000’s of serverless backend components for 3+ years at Dashbird. In our experience, Serverless infrastructure failures boil down to: These isolated faults become causes of failure due to dependencies in our cloud architectures (ref. Difference of Fault vs. Failure). If a serverless Lambda function relies on a database that is under stress, the entire API may start returning 5XX errors.

How to Move Kubernetes Logs to S3 with Logstash

Sometimes, the data you want to analyze lives in AWS S3 buckets by default. If that’s the case for the data you need to work with, good on you: You can easily ingest it into an analytics tool that integrates with S3. But what if you have a data source — such as logs generated by applications running in a Kubernetes cluster — that isn’t stored natively in S3? Can you manage and analyze that data in a cost-efficient, scalable way? The answer is yes, you can.