Operations | Monitoring | ITSM | DevOps | Cloud

The latest News and Information on Monitoring for Websites, Applications, APIs, Infrastructure, and other technologies.

Synthetic testing: A definition and how it compares to Real User Monitoring

Performance monitoring is critical for a healthy software application. If you don’t have synthetic testing or real user monitoring in place, opportunities for performance optimizations are slipping through the cracks. With the guidance of a monitoring tool, on the other hand, you could be fixing problems such as slow-loading pages within the hour. The two main types of application monitoring are Real User Monitoring (RUM) and synthetic testing (or synthetic monitoring).
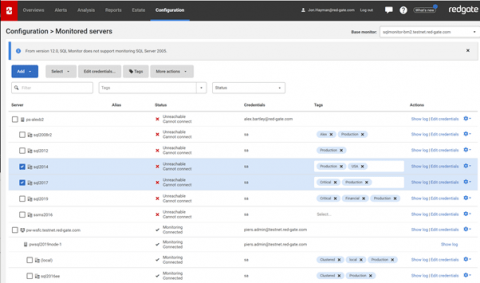
Tagging in a monitoring tool: what is it and how can it benefit your team?

As you start to have responsibility for more than a handful of SQL Server instances, you’ll need to get more organised. Everyone around you benefits if you’ve recorded basic things like what the server does and who is responsible for it, and we think that a great place to do this is in your monitoring tool (and, better still, if that’s SQL Monitor!).

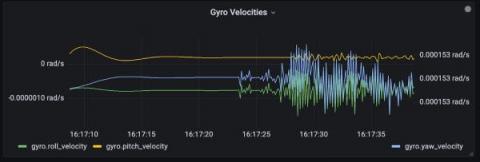
Real-time drone tracking and management with Grafana

The number of internet-connected assets around us that are powering services and utilities in a wide array of sectors is rising at an exponential rate. As a result, it’s becoming critical for businesses that provide such services and utilities to have an observability stack tailored to the type of physical hardware devices that are generally deployed in swarms.

Financial Services Customer Maintains 99.99% Uptime With LogicMonitor

In this case study video, LogicMonitor is joined by Abrigo, a software company for financial institutions, to discuss the evolution of the financial technology space through the digital transformation era. From supporting PPP loans throughout the pandemic to consolidating a plethora of monitoring tools into one platform for greater visibility and ease of use – LogicMonitor provides Abrigo with the enterprise-grade SaaS monitoring solution it needs to support its customers 24/7, around the globe.

GCISD Accelerates Digital Transformation With LogicMonitor

In this case study video, LogicMonitor is joined by Grapevine-Colleyville Independent School District to discuss the evolution of the education space through the digital transformation era. From keeping tabs on thousands of devices, consolidating a plethora of monitoring tools into one platform for greater visibility and ease of use, and leveraging AI powered alerting and forecasting, LogicMonitor provides GCISD with the enterprise-grade SaaS monitoring solution it needs to support its students 24/7, wherever they are learning.

DeveloperWeek 2022: Front-end Code Observability: Errors, Performance, Web Vitals

Good user experience requires a well performing frontend application. Code observability on a frontend application—to understand errors and their relevancy, performance of transactions, and Web Vitals to quantify website quality—is complex. By watching this video on-demand, you'll learn more about the tools that are available to aggregate and organize relevant frontend data to provide necessary visibility on errors and performance to keep users engaged.

Parallelizing Queries with Rails 7's `load_async`

As you're likely well aware, Rails 7 was released last month bringing a number of new features with it. One of the features we're most excited about is load_async. This features allows for multiple Active Record queries to be executed in parallel which can be a great tool for speeding up slow requests. Since Rails introduces an entirely new infrastructure for load_async, Skylight's existing integration wasn't capturing all of these queries.

Datadog on Profiling in Production

Depending on your chosen programming language and stack, you may have never used a profiler in production. The very idea of using a profiler in production for a web service may seem unrealistic, due to the amount of overhead involved. After all, aren’t profilers extremely computationally expensive to run? Despite a reputation for being computationally expensive, many programming languages have examples of profilers built to run in production. The importance of seeing how your application behaves in production is critically important to understanding how it performs in the real world.

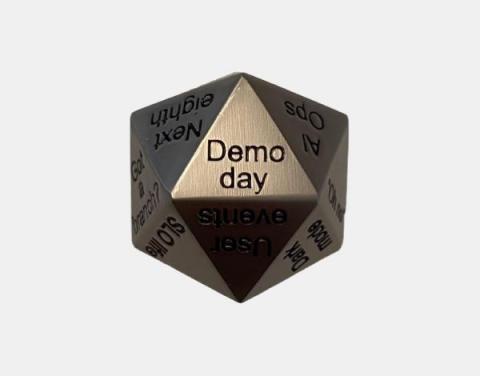
Share Progress and Celebrate Wins With Demo Days

In my last blog post, I talked about the cadence of product planning and delivery at Honeycomb. Tucked away in there was a mention of “demo day”—and I’m back to tell you all about that because it’s a pretty big deal around here, and I want to encourage you to give it a try as a way to see progress on new feature development and get folks excited about what’s on the horizon.