Operations | Monitoring | ITSM | DevOps | Cloud
opsdemon
Latest posts
Azure VM health monitoring - what's right for you?
How to Enable Confidential Computing with Ubuntu and Google Cloud
Taking The Mystery Out of AIOps
AIOps has been shrouded in mystery since its inception in 2017- offering little guidance beyond the promise of AI/ML-driven insights. To make AIOps less of a mystery, the experts from Forrester Research have tried to help...
RabbitMQ vs. Kafka
Putting HC3's Cyber Posture Recommendations into Practice
Of growing concern to both patients and the professionals who facilitate their care is the growing trend of healthcare organizations being preyed upon by cybercriminals. In the United States, recent political dialogue has brought special attention to patients’ privacy rights under HIPAA and the ongoing security of their records.
GripMatix releases new SCOM MP for Citrix DaaS
We are happy to announce that we have released a brand-new SCOM Management Pack for monitoring Citrix Desktop as a Service (DaaS). Citrix DaaS is a Citrix Cloud service that allows you to securely deliver virtual apps and desktops from on-premise data centers and public cloud platforms in a hybrid deployment.
Create Alerts on Cloud Monitoring
InfluxDB is Once Again a Leader in G2's Fall 2022 Reports
G2 has released their Fall 2022 reports, and we are thrilled to share that InfluxDB – the purpose- built time series platform, has once again ranked #1 in the G2 Grid for Time Series Databases. InfluxDB has also held its leading position in the Momentum Grid for Time Series Databases. The Momentum Grid® identifies products that are on a high growth trajectory based on user satisfaction scores, employee growth, and digital presence.
Data Center Redundancy 101
The world depends on data centers in all aspects of daily life. To meet all-time high levels of demand that continue to grow with no end in sight, downtime is unacceptable for most organizations. The cost of downtime is rising and 40% of businesses report that just one hour of downtime can cost anywhere from $1 million to $5 million, not including the other associated fees. Large companies report that an interruption during peak business hours can cost almost $1 million per minute.
Driving Efficiency with Custom APM Dashboards
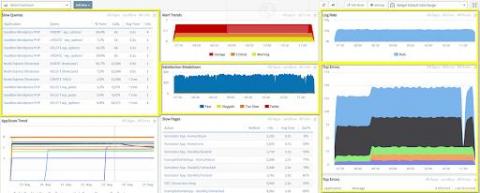
Have you ever struggled to have efficient visibility into your APM and log data? Have you ever been called on to display real-time data to your Sales or Marketing department, only to find yourself fumbling over the numbers without a way to display relevant data? Look no further! Retrace collects huge amounts of data about your application’s health and performance, then provides a customizable display in one place – your customizable APM Dashboards.


