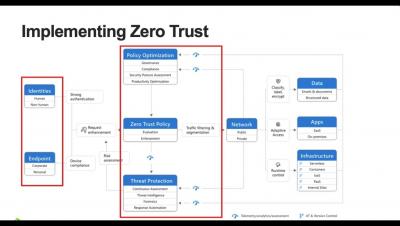
Operations | Monitoring | ITSM | DevOps | Cloud

Monitoring

The latest News and Information on Monitoring for Websites, Applications, APIs, Infrastructure, and other technologies.

Introducing Rollbar Analyze

We are excited to announce the rollout of our new Rollbar Improve component, Analyze. As we strive to provide you with the best possible tools to monitor, understand, and improve your code, we've combined two powerful features, RQL and Metrics API, into one comprehensive package. Analyze is designed to deliver even more powerful insights to help your teams better understand your code and make data-driven decisions.

Monitor OTel-instrumented apps with support for W3C Trace Context

To get visibility into highly distributed applications, organizations often use various tracing tools that are best suited to each individual service owner’s specifications. However, when a request travels between services that have been instrumented with different tools, the trace data may be formatted differently, resulting in broken traces.

How to use Elasticsearch and Time Series Data Streams for observability metrics

Elasticsearch is used for a wide variety of data types — one of these is metrics. With the introduction of Metricbeat many years ago and later our APM Agents, the metric use case has become more popular. Over the years, Elasticsearch has made many improvements on how to handle things like metrics aggregations and sparse documents. At the same time, TSVB visualizations were introduced to make visualizing metrics easier.

Introducing the Grafana Labs Bug Bounty Program

At Grafana Labs, we value the open source community and recognize the power of crowdsourcing. This is why we have decided to launch our very own bug bounty program, managed in-house by our own team, to encourage ethical hackers from around the world to help us find and responsibly report security vulnerabilities in Grafana Labs software.

Deciphering Complex Logs With Regex Using BindPlane OP and OpenTelemetry

Parsing logs with regex is a valuable technique for extracting essential information from large volumes of log data. By employing this method, one can effectively identify patterns, errors, and other key insights, ultimately streamlining log analysis and enhancing system performance.

Using Practical Alerting to Stay on Top of Teams Call Quality - Part 2

Running your business using Teams isn’t without its challenges. We already did a post here about some of the Microsoft Teams alerts IT teams need to be alerted to sooner rather than later. But, because of how complex large Teams setups are, we’ve got a few more to add to the collection. Today, we’re focusing on the Microsoft-specific challenges you might face.

Kentique - The Fragrance of Observability

What does observability smell like? For ages, humans have relied on sight to observe network, cloud, container, and data center traffic. Kentik is proud to usher in the next step in the evolution of network observability. Welcome to the age of scent! Introducing Kentique, a new fragrance from the creators of Kentik. Whether managing network infrastructure in the server room or entertaining guests at an AWS re:Invent afterparty, you need to smell the part – an aromatic infusion of routers, clouds, clusters, and telemetry dancing in a symphony of observability.

We tell you with lots of humor why monitoring your equipment is no laughing matter

Let’s face it, enough chit chat, without monitoring, your computer walks on a tightrope, 30 floors high and without safety net: a false movement and BAM! It’s over! Brains omelette for the pigeons of your neighborhood! Therefore, today, in the sacred and glaucous Pandora FMS blog, we bring you a series of testimonies, of real cases, sent by our esteemed users, where we ask them to tell us their miseries in exchange for taking the only moral possible.